Global Machine Learning Market Report: Trends, Growth and Forecast (2027-2033)
By Component (Hardware, Software, Services), By Deployment (Cloud-based, On-premises), By Enterprise Size (Large Enterprises, Small and Medium-sized Enterprises), By End Use (BFSI, Healthcare, Retail, Manufacturing, Agriculture, Automotive and Transportation, Advertising and Media, IT and Telecommunications, Government and Public Sector, Others), By Region (North America, South America, Europe, Middle East & Africa, Asia Pacific) ... Read more
|
Major Players
|
Machine Learning Market Overview
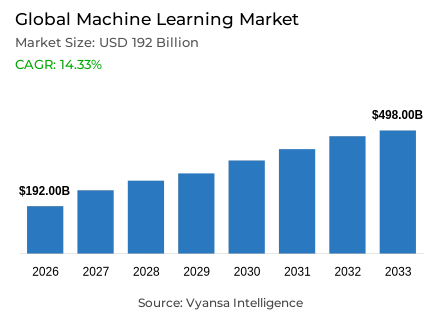
Machine learning is consumed as accelerator hardware, platform software and integration services that turn organizational data into predictions, generated content and automated actions. Large enterprises, small and medium-sized enterprises and public bodies use it across advertising, banking, healthcare, manufacturing, telecommunications and government workflows. The Machine Learning market is forecast to grow at a compound annual growth rate (CAGR) of 14.33% between 2027 and 2033.
Key Highlights of the Machine Learning Market
- The machine learning market was valued at USD 192 billion in 2026. The market is estimated at USD 223 billion in 2027 and projected to reach USD 498 billion by 2033.
- The machine learning market is projected to grow at a CAGR of 14.33% during 2027–2033.
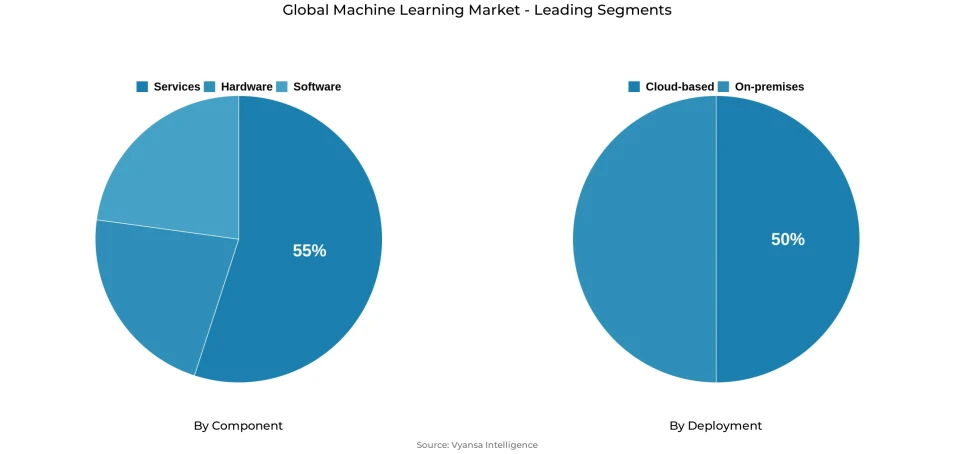
- Services are estimated to lead the component category with approximately 55% of the market in 2026.
- Hardware is projected to be the fastest-growing component, at an estimated 32.81% CAGR during the forecasted period of 2027 to 2033.
- Cloud-based deployment is estimated to account for approximately 50% of the market in 2026.
- Cloud-based deployment is projected to grow at an estimated 18.20% CAGR during the forecasted period of 2027 to 2033.
- North America is estimated to lead the market with approximately 35% of global value in 2026.
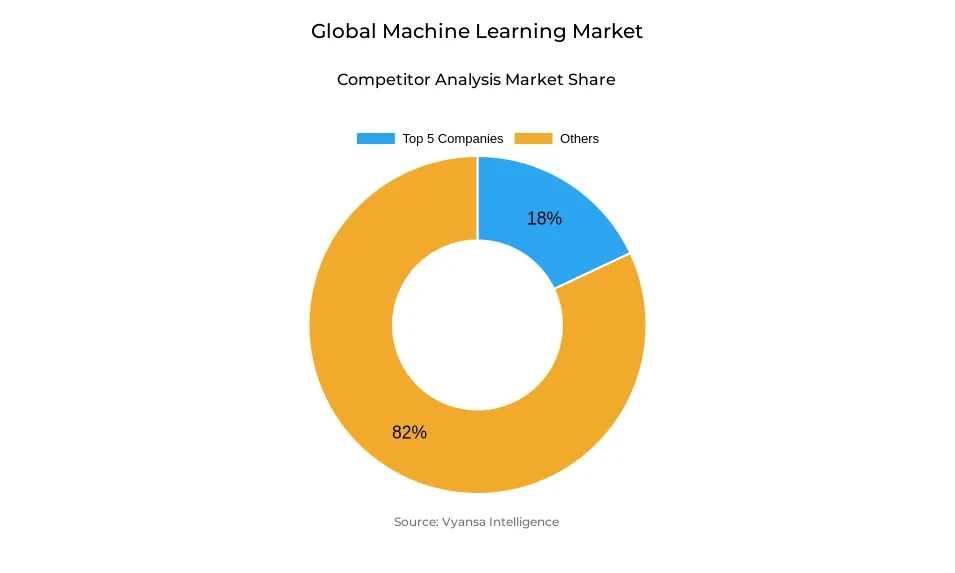
- The five leading companies are estimated to account for approximately 18% of the market in 2026.
Machine learning adoption is widening internationally while becoming more deeply embedded within individual organizations. The proportion of firms using artificial intelligence across OECD countries increased from 8.7% in 2023 to 14.2% in 2024 and 20.2% in 2025. A 2026 global survey found that 44% of participating organizations were scaling artificial intelligence across their enterprises, up from 38% a year earlier, while 56% were using it in at least three business functions.
Deeper deployment changes the nature of expenditure. A pilot may require temporary development resources, but a production workload continuously consumes inference capacity, data processing, monitoring and technical support. Around 20% of respondents to the 2026 global survey said operating expenditure, including token costs, had constrained their use of artificial intelligence, even as most planned to increase investment. This shows that model operation is becoming a continuing budget item whose value depends on sustained usage and measurable results.
Through the forecast period, expenditure should expand as financial institutions, manufacturers, healthcare providers, retailers and public bodies apply models to greater volumes of transactions, documents, images and operational data. Growth will remain uneven because many Organizations have adopted models without integrating them broadly. Suppliers combining efficient infrastructure, usable platforms and implementation support should be best positioned to convert wider adoption into recurring production workloads and continued market growth.
Machine Learning Market Government Compliance
Obligations for general-purpose artificial-intelligence models under the EU AI Act became applicable in August 2025. Where covered, model providers must maintain technical documentation, give downstream suppliers information required for integration, implement copyright-compliance policies and publish summaries of model-training content. Providers of models carrying systemic risk face additional requirements relating to model evaluation, risk mitigation, incident reporting and cybersecurity.
Transparency requirements applicable from August 2026 affect providers and deployers of systems producing or manipulating synthetic content. These obligations create purchasing requirements for content identification, model documentation, testing, monitoring and audit records. Platform suppliers need to preserve information about the models made available to customers, while integrators must carry relevant documentation and controls into completed applications.
The commercial impact depends on jurisdiction, model type and intended application. Not every customer requires the same governance system. However, affected model providers, regulated enterprises and implementation partners need controls that remain effective throughout development and production. This supports demand for governance platforms, model evaluation, security testing and implementation services that can be integrated with existing machine-learning environments.
Machine Learning Market Drivers
Falling Inference Costs and Expanding Accelerator Supply Make Continuous Workloads Economic
Inference occurs whenever a trained model processes new information and produces an output. Lower inference costs allow Organizations to apply machine learning continuously across document review, customer assistance, fraud screening and multi-step agent workflows. Between November 2022 and October 2024, the cost of inference at performance comparable with GPT-3.5 fell more than 280-fold, lowering the commercial threshold for workloads that require large and repeated volumes of model activity.
The infrastructure supporting this usage continues to expand. The IEA reported that global data-center electricity demand increased 17% in 2025, compared with 3% for total electricity demand, while consumption by AI-focused data center rose approximately 50%. Its base case projects electricity consumption by accelerated servers to grow around 30% annually through 2030, compared with 9% for conventional servers. This divergence signals stronger expansion in accelerated computing capacity and supports demand for processors, servers and networking equipment.
In January 2026, Microsoft introduced Maia 200, an inference accelerator that the company says delivers 30% better performance per dollar than the latest-generation hardware in its fleet and supports clusters containing up to 6,144 accelerators. Through 2033, lower unit costs should make continuous model use viable across more industries. Market revenue will nevertheless depend on workload volumes increasing faster than effective inference prices decline, favoring suppliers that combine efficient infrastructure with expanding production usage.
Machine Learning Market Challenges
Limited Readiness for Production Deployment
Moving machine learning from successful pilots into routine operations remains a major implementation challenge. Production systems must integrate with live data, operate within existing infrastructure and maintain reliable performance as business conditions change. Organizations also require clear accountability, evaluation procedures and continuous monitoring. Where these capabilities are insufficient, implementation costs increase and deployment timelines lengthen, limiting the conversion of experimental projects into sustained demand for machine learning platforms and services.
The OECD’s Digital Government Outlook 2026 found that nearly all member governments use AI, but only 28% of countries systematically assess its impact. Separately, Eurostat reported that 70.89% of EU enterprises that considered AI but did not adopt it in 2025 cited insufficient expertise. These gaps make it harder for buyers to validate business benefits and manage production workloads, increasing their dependence on external engineering, model evaluation and operational support.
The Financial Stability Board’s 12 sound practices for responsible AI adoption further emphasise governance, performance assessment and lifecycle controls. These expectations strengthen the commercial importance of platforms offering integrated validation, documentation and monitoring. Over the forecast period, inadequate production readiness is likely to delay some deployments while directing spending towards suppliers that can address implementation requirements alongside model development.
Machine Learning Market Recent Trends
Embedded Engineering Strengthens Enterprise Delivery
Machine learning suppliers are increasingly embedding engineering teams within customer operations to accelerate implementation. Working directly with business, technology and security functions helps suppliers adapt models to operational requirements and resolve integration issues during development. This approach makes delivery expertise an increasingly important part of the product offering, particularly for enterprises that have acquired AI platforms but lack the internal engineering capacity to deploy them effectively.
AWS supported this approach with a USD 1 billion commitment to its Forward Deployed Engineering organization. Industry reporting described teams of five or six engineers working through 45-day sprints, while AWS stated that engagements focus on shared business results rather than billable hours. The model connects platform adoption with implementation support, helping customers establish production workloads and acquire the skills needed to operate them independently.
AWS is also extending embedded delivery through consulting partners using reusable engineering frameworks and operational tooling. This can broaden implementation capacity and reduce the need to rebuild delivery processes for each customer. Through 2033, suppliers combining platforms with effective deployment support are likely to strengthen customer relationships and generate additional service demand as more workloads enter production.
Agentic Systems Expand into Enterprise Workflows
Agentic systems are extending machine learning applications from responding to individual requests to executing connected business tasks. Their ability to retrieve information, use software tools and coordinate actions reduces manual work between enterprise systems. For buyers, the value increasingly depends on completing a defined process reliably, creating demand for products that combine model capabilities with workflow integration, access controls and human approval mechanisms.
It was reported that a deployment at a European chemicals manufacturer reduced a vendor-onboarding process previously taking approximately two weeks to under five minutes of active processing, with manual effort declining by more than 99%. These results demonstrate the potential to reduce administrative workloads through automated data collection, compliance checks and communications. Such applications expand the commercial role of machine learning from employee assistance to direct participation in operational processes.
FIS’s commercially available AML Investigations Agent provides further evidence of this shift. Amalgamated Bank projected reductions exceeding 90% in initial alert-review time and approximately 98% in deeper investigation time, with analyst approval retained for final decisions. Over the forecast period, measurable workflow benefits could support wider adoption of agentic products, favouring suppliers that combine automation with traceable evidence and institutional control.
Machine Learning Market Future Opportunities
Sovereign and Private Infrastructure for Regulated Organizations
Sovereign and private infrastructure creates opportunities to serve Organizations requiring greater control over sensitive data, model access and system operations. Banks, insurers, healthcare institutions and public bodies need deployment options aligned with workload-specific confidentiality and governance requirements. Meeting these needs creates demand for machine learning platforms that can operate within locally controlled environments, supported by integrated infrastructure, security controls and ongoing technical services.
EuroHPC’s network comprises 19 AI Factories and 13 Antennas, while its AI Gigafactories tender supports up to seven additional facilities through a model involving public procurement of compute access. This expansion can improve access to European sovereign computing resources and support the development, training and deployment of machine learning applications. The commercial opportunity extends beyond computing equipment to platform software, infrastructure integration and specialized operational support.
Enterprise purchasing also demonstrates demand for deployment flexibility. DataRobot introduced capabilities supporting on-premises, air-gapped and cloud environments, while Etisalat UAE expanded its partnership with the company to host the platform within its own data center. Dell’s introduction of Deskside Agentic AI further broadens local deployment options. Together, these developments indicate a market for suppliers that can deliver advanced AI capabilities within customer-controlled infrastructure.
Through 2033, expansion into additional private and hybrid workloads could generate recurring software, maintenance and managed-service demand. Suppliers offering validated configurations, deployment expertise and consistent governance across environments are positioned to capture this opportunity.
Unlock Market Intelligence
Explore the market potential with our data-driven report
Machine Learning Market Segmentation Analysis
By Component:
- Hardware
- Software
- Services
Services Take 55% of Component Demand as Integration Follows Every Deployment
Services lead because most Organizations lack the in-house skills, evaluation criteria and governance capability to move a model from pilot to production, so integration, managed operation and embedded engineering are contracted from suppliers. They also recur, since every live workload needs monitoring, retraining and change control after launch. Services should hold their lead through 2033 unless standardized tooling removes much of the integration labor.
In May 2026, Anthropic PBC announced a joint venture with Blackstone, Hellman & Friedman and Goldman Sachs to deploy enterprise AI services, which shows model suppliers treating delivery capacity as part of the product. In July 2026, Cognizant Technology Solutions Corporation and Domyn announced a partnership to deliver sovereign AI on premises for regulated Organizations across Europe, the Middle East and Africa, which adds contracted integration work for the industry.
Hardware is the fastest-growing component, expanding at a CAGR of 32.81% across the 2027 to 2033 forecast period, as public bodies and operators install accelerator capacity ahead of demand. The Government of India's IndiaAI Mission has onboarded more than 38,000 graphics processing units (GPUs) for subsidised shared access, announced 20,000 more in February 2026 and set a target of at least 200,000. Hardware outgrows Services because capacity is installed in large steps and compounds with inference volume, while Services scales with delivery staff.
By Deployment:
- Cloud-based
- On-premises
Cloud-based Delivery Takes 50%of Deployment Demand and Keeps Widening Its Lead
Cloud-based deployment leads because end users rent accelerator capacity and managed model services by consumption instead of financing racks, power and cooling themselves. It also gives end users access to current accelerators and models without a separate infrastructure build, which shortens the move from pilot to production. The lead should hold through the forecast period unless data-residency rules push regulated workloads off shared infrastructure faster than expected.
In January 2026, Amazon Web Services, Inc. made the AWS European Sovereign Cloud generally available, with a first region in Brandenburg, Germany and sovereign local zones planned for Belgium, the Netherlands and Portugal, which brings regulated European workloads into cloud-based consumption. In June 2026, Nokia Oyj and Google Cloud announced agents built with Gemini models inside Nokia's autonomous network suite, offered as a software-as-a-service product on the Google Cloud Marketplace from September 2026, giving telecom operators a cloud route to agent deployment.
Cloud-based deployment is also the fastest-growing deployment segment, at a CAGR of 18.20% across the 2027 to 2033 forecast period. It outgrows on-premises because small and medium-sized enterprises, which lack the capital for owned racks, consume machine learning through rented capacity and pre-trained models, while on-premises growth depends on a narrower set of regulated Organizations building private estates.
Unlock Market Intelligence
Explore the market potential with our data-driven report
Machine Learning Market Regional Analysis
North America Leads with Established Enterprise Demand and Research Support
North America is estimated to account for approximately 35% of the global machine learning market in 2026, supported by established enterprise demand and a strong technology ecosystem. The U.S. Census Bureau reported AI usage among 39.7% of information-sector businesses and 33.9% of finance and insurance businesses in May 2026. Adoption within these data-intensive industries provides a substantial customer base for machine learning applications supporting information processing, risk assessment and business decision-making.
Canada is contributing to regional demand expansion. Statistics Canada reported that 25.2% of businesses planned to use AI to produce goods or deliver services over the following year, compared with 14.5% in the corresponding 2025 survey. Among businesses planning adoption, data analytics was the most frequently identified application, at 41.7%. This prospective demand creates opportunities for suppliers offering analytical models and industry-specific applications that translate business data into operational improvements.
Public research infrastructure further strengthens the region’s development capabilities. The U.S. National Science Foundation reported that its National Artificial Intelligence Research Resource pilot had supported more than 800 research projects, alongside the establishment of an operations center to coordinate computing resources, datasets, tools and training. Broader access can support model development and workforce capabilities. Through 2033, this research foundation and expanding enterprise adoption should reinforce North America’s position as a major center of machine learning demand and innovation.

Machine Learning Market Competitive Landscape
The industry is fragmented, with the top five companies holding an approximately 18% combined share in 2026, based on an indicative estimate. The five companies are NVIDIA Corporation, Microsoft Corporation, Amazon.com, Inc. (Amazon Web Services), Google LLC (Google Cloud) and International Business Machines Corporation.
Key Companies in the Machine Learning Market
- NVIDIA Corporation
- Microsoft Corporation
- Amazon.com, Inc. (Amazon Web Services)
- Google LLC (Google Cloud)
- International Business Machines Corporation
- Super Micro Computer, Inc. (Supermicro)
- Dell Technologies Inc.
- Broadcom Inc.
- Oracle Corporation
- Advanced Micro Devices, Inc.
- Huawei Technologies Co. Ltd
- Accenture PLC
- Hewlett Packard Enterprise Company
- Alibaba Group Holding Limited (Alibaba Cloud)
- Databricks, Inc.
Company Profiling
The following profiles cover the five leading companies shaping accelerator supply, cloud delivery and enterprise deployment across the industry.
NVIDIA Corporation: NVIDIA competes through an integrated machine-learning infrastructure portfolio covering accelerators, networking, complete systems and software development tools. Its ability to support training and inference through a common computing ecosystem gives cloud operators and enterprise customers a more integrated deployment route. In October 2026, Google Cloud and NVIDIA announced that A5X instances based on NVIDIA Vera Rubin NVL72 systems would become generally available the following month, expanding customer access to the platform through Google Cloud.
Microsoft Corporation: Microsoft combines Azure computing and machine-learning services with enterprise software, workplace applications and data platforms. This gives the company a distribution advantage among Organizations already using its applications and cloud environment. In October 2026, Microsoft announced plans to extend Azure Maia systems into multi-gigawatt deployments and said it expects Maia 300 to deliver 40% more tokens per megawatt than leading GPU-based systems when introduced in 2027.
Amazon.com Inc. (Amazon Web Services): Amazon Web Services competes through infrastructure breadth, consumption-based delivery and managed services covering model development, deployment and operation. Its position is strongest among customers seeking scalable computing without owning the complete infrastructure. In October 2026, Amazon Web Services placed Amazon Bedrock Managed Agents powered by OpenAI into public preview, giving customers another route to develop agent applications through its managed environment.
Google LLC (Google Cloud): Google Cloud combines custom processors, machine-learning platforms, data services and internally developed models. Its competitive position rests on connecting model development with enterprise data and cloud infrastructure through a common environment. In October 2026, Google Cloud added OpenAI models to Model Garden, expanding the catalogue to more than 200 models and enabling customers to access another model supplier through existing Google Cloud security and administration controls.
International Business Machines Corporation: IBM concentrates on hybrid deployment, machine-learning governance and integration for enterprises operating across cloud and privately controlled infrastructure. Its position is particularly relevant to regulated Organizations requiring model traceability and operational control. In October 2026, IBM introduced identity and control capabilities for AI agents operating across Amazon Bedrock, Microsoft Foundry and Google Gemini environments, extending its governance offering across platforms supplied by competing providers.
Recent Developments in the Machine Learning Market
October 2026: Oracle announced its Deep Trust AI Architecture with controls covering infrastructure, data, models and applications. The architecture gives enterprise customers an integrated route for securing model development and operation across several technology layers.
October 2026: AMD announced Helion, an open rack blueprint for large-scale agentic computing, with planned availability from November 2026. The design supports configurations containing up to 32,768 processor cores and gives infrastructure operators another architecture for building large training and inference environments.
June 2026: Databricks introduced Genie One alongside Genie Code and ZeroOps capabilities. The additions allow business and technical users to query enterprise data, develop data applications and automate selected platform operations through the same data environment.
Frequently Asked Questions
Related Report
- Market Segmentation
- Research Scope
- Research Methodology
- Definitions and Assumptions
- Executive Summary
- Global Machine Learning Market Policies, Regulations, and Standards
- Global Machine Learning Market Dynamics
- Growth Factors
- Challenges
- Trends
- Opportunities
- Global Machine Learning Market Statistics, 2023-2033F
- Market Size & Growth Outlook
- By Revenues in USD Million
- Market Segmentation & Growth Outlook
- By Component
- Hardware- Market Insights and Forecast 2023-2033, USD Million
- Software- Market Insights and Forecast 2023-2033, USD Million
- Services- Market Insights and Forecast 2023-2033, USD Million
- By Deployment
- Cloud-based- Market Insights and Forecast 2023-2033, USD Million
- On-premises- Market Insights and Forecast 2023-2033, USD Million
- By Enterprise Size
- Large Enterprises- Market Insights and Forecast 2023-2033, USD Million
- Small and Medium-sized Enterprises- Market Insights and Forecast 2023-2033, USD Million
- By End Use
- BFSI- Market Insights and Forecast 2023-2033, USD Million
- Healthcare- Market Insights and Forecast 2023-2033, USD Million
- Retail- Market Insights and Forecast 2023-2033, USD Million
- Manufacturing- Market Insights and Forecast 2023-2033, USD Million
- Agriculture- Market Insights and Forecast 2023-2033, USD Million
- Automotive and Transportation- Market Insights and Forecast 2023-2033, USD Million
- Advertising and Media- Market Insights and Forecast 2023-2033, USD Million
- IT and Telecommunications- Market Insights and Forecast 2023-2033, USD Million
- Government and Public Sector- Market Insights and Forecast 2023-2033, USD Million
- Others- Market Insights and Forecast 2023-2033, USD Million
- By Region
- North America
- South America
- Europe
- Middle East & Africa
- Asia Pacific
- By Competitors
- Competition Characteristics
- Market Share & Analysis
- By Component
- Market Size & Growth Outlook
- North America Machine Learning Market Statistics, 2023-2033F
- Market Size & Growth Outlook
- By Revenues in USD Million
- Market Segmentation & Growth Outlook
- By Component- Market Insights and Forecast 2023-2033, USD Million
- By Deployment- Market Insights and Forecast 2023-2033, USD Million
- By Enterprise Size- Market Insights and Forecast 2023-2033, USD Million
- By End Use- Market Insights and Forecast 2023-2033, USD Million
- By Country
- The US
- Canada
- Mexico
- The US Machine Learning Market Statistics, 2023-2033F
- Market Size & Growth Outlook
- By Revenues in USD Million
- Market Segmentation & Growth Outlook
- By Component- Market Insights and Forecast 2023-2033, USD Million
- By Deployment- Market Insights and Forecast 2023-2033, USD Million
- By Enterprise Size- Market Insights and Forecast 2023-2033, USD Million
- By End Use- Market Insights and Forecast 2023-2033, USD Million
- Market Size & Growth Outlook
- Canada Machine Learning Market Statistics, 2023-2033F
- Market Size & Growth Outlook
- By Revenues in USD Million
- Market Segmentation & Growth Outlook
- By Component- Market Insights and Forecast 2023-2033, USD Million
- By Deployment- Market Insights and Forecast 2023-2033, USD Million
- By Enterprise Size- Market Insights and Forecast 2023-2033, USD Million
- By End Use- Market Insights and Forecast 2023-2033, USD Million
- Market Size & Growth Outlook
- Mexico Machine Learning Market Statistics, 2023-2033F
- Market Size & Growth Outlook
- By Revenues in USD Million
- Market Segmentation & Growth Outlook
- By Component- Market Insights and Forecast 2023-2033, USD Million
- By Deployment- Market Insights and Forecast 2023-2033, USD Million
- By Enterprise Size- Market Insights and Forecast 2023-2033, USD Million
- By End Use- Market Insights and Forecast 2023-2033, USD Million
- Market Size & Growth Outlook
- Market Size & Growth Outlook
- South America Machine Learning Market Statistics, 2023-2033F
- Market Size & Growth Outlook
- By Revenues in USD Million
- Market Segmentation & Growth Outlook
- By Component- Market Insights and Forecast 2023-2033, USD Million
- By Deployment- Market Insights and Forecast 2023-2033, USD Million
- By Enterprise Size- Market Insights and Forecast 2023-2033, USD Million
- By End Use- Market Insights and Forecast 2023-2033, USD Million
- By Country
- Brazil
- Argentina
- Chile
- Rest of South America
- Brazil Machine Learning Market Statistics, 2023-2033F
- Market Size & Growth Outlook
- By Revenues in USD Million
- Market Segmentation & Growth Outlook
- By Component- Market Insights and Forecast 2023-2033, USD Million
- By Deployment- Market Insights and Forecast 2023-2033, USD Million
- By Enterprise Size- Market Insights and Forecast 2023-2033, USD Million
- By End Use- Market Insights and Forecast 2023-2033, USD Million
- Market Size & Growth Outlook
- Argentina Machine Learning Market Statistics, 2023-2033F
- Market Size & Growth Outlook
- By Revenues in USD Million
- Market Segmentation & Growth Outlook
- By Component- Market Insights and Forecast 2023-2033, USD Million
- By Deployment- Market Insights and Forecast 2023-2033, USD Million
- By Enterprise Size- Market Insights and Forecast 2023-2033, USD Million
- By End Use- Market Insights and Forecast 2023-2033, USD Million
- Market Size & Growth Outlook
- Chile Machine Learning Market Statistics, 2023-2033F
- Market Size & Growth Outlook
- By Revenues in USD Million
- Market Segmentation & Growth Outlook
- By Component- Market Insights and Forecast 2023-2033, USD Million
- By Deployment- Market Insights and Forecast 2023-2033, USD Million
- By Enterprise Size- Market Insights and Forecast 2023-2033, USD Million
- By End Use- Market Insights and Forecast 2023-2033, USD Million
- Market Size & Growth Outlook
- Market Size & Growth Outlook
- Europe Machine Learning Market Statistics, 2023-2033F
- Market Size & Growth Outlook
- By Revenues in USD Million
- Market Segmentation & Growth Outlook
- By Component- Market Insights and Forecast 2023-2033, USD Million
- By Deployment- Market Insights and Forecast 2023-2033, USD Million
- By Enterprise Size- Market Insights and Forecast 2023-2033, USD Million
- By End Use- Market Insights and Forecast 2023-2033, USD Million
- By Country
- Germany
- The UK
- France
- Italy
- Spain
- BENELUX
- Nordics
- Rest of Europe
- Germany Machine Learning Market Statistics, 2023-2033F
- Market Size & Growth Outlook
- By Revenues in USD Million
- Market Segmentation & Growth Outlook
- By Component- Market Insights and Forecast 2023-2033, USD Million
- By Deployment- Market Insights and Forecast 2023-2033, USD Million
- By Enterprise Size- Market Insights and Forecast 2023-2033, USD Million
- By End Use- Market Insights and Forecast 2023-2033, USD Million
- Market Size & Growth Outlook
- The UK Machine Learning Market Statistics, 2023-2033F
- Market Size & Growth Outlook
- By Revenues in USD Million
- Market Segmentation & Growth Outlook
- By Component- Market Insights and Forecast 2023-2033, USD Million
- By Deployment- Market Insights and Forecast 2023-2033, USD Million
- By Enterprise Size- Market Insights and Forecast 2023-2033, USD Million
- By End Use- Market Insights and Forecast 2023-2033, USD Million
- Market Size & Growth Outlook
- France Machine Learning Market Statistics, 2023-2033F
- Market Size & Growth Outlook
- By Revenues in USD Million
- Market Segmentation & Growth Outlook
- By Component- Market Insights and Forecast 2023-2033, USD Million
- By Deployment- Market Insights and Forecast 2023-2033, USD Million
- By Enterprise Size- Market Insights and Forecast 2023-2033, USD Million
- By End Use- Market Insights and Forecast 2023-2033, USD Million
- Market Size & Growth Outlook
- Italy Machine Learning Market Statistics, 2023-2033F
- Market Size & Growth Outlook
- By Revenues in USD Million
- Market Segmentation & Growth Outlook
- By Component- Market Insights and Forecast 2023-2033, USD Million
- By Deployment- Market Insights and Forecast 2023-2033, USD Million
- By Enterprise Size- Market Insights and Forecast 2023-2033, USD Million
- By End Use- Market Insights and Forecast 2023-2033, USD Million
- Market Size & Growth Outlook
- Spain Machine Learning Market Statistics, 2023-2033F
- Market Size & Growth Outlook
- By Revenues in USD Million
- Market Segmentation & Growth Outlook
- By Component- Market Insights and Forecast 2023-2033, USD Million
- By Deployment- Market Insights and Forecast 2023-2033, USD Million
- By Enterprise Size- Market Insights and Forecast 2023-2033, USD Million
- By End Use- Market Insights and Forecast 2023-2033, USD Million
- Market Size & Growth Outlook
- BENELUX Machine Learning Market Statistics, 2023-2033F
- Market Size & Growth Outlook
- By Revenues in USD Million
- Market Segmentation & Growth Outlook
- By Component- Market Insights and Forecast 2023-2033, USD Million
- By Deployment- Market Insights and Forecast 2023-2033, USD Million
- By Enterprise Size- Market Insights and Forecast 2023-2033, USD Million
- By End Use- Market Insights and Forecast 2023-2033, USD Million
- Market Size & Growth Outlook
- Nordics Machine Learning Market Statistics, 2023-2033F
- Market Size & Growth Outlook
- By Revenues in USD Million
- Market Segmentation & Growth Outlook
- By Component- Market Insights and Forecast 2023-2033, USD Million
- By Deployment- Market Insights and Forecast 2023-2033, USD Million
- By Enterprise Size- Market Insights and Forecast 2023-2033, USD Million
- By End Use- Market Insights and Forecast 2023-2033, USD Million
- Market Size & Growth Outlook
- Market Size & Growth Outlook
- Middle East & Africa Machine Learning Market Statistics, 2023-2033F
- Market Size & Growth Outlook
- By Revenues in USD Million
- Market Segmentation & Growth Outlook
- By Component- Market Insights and Forecast 2023-2033, USD Million
- By Deployment- Market Insights and Forecast 2023-2033, USD Million
- By Enterprise Size- Market Insights and Forecast 2023-2033, USD Million
- By End Use- Market Insights and Forecast 2023-2033, USD Million
- By Country
- UAE
- Saudi Arabia
- South Africa
- Turkey
- Rest of Middle East & Africa
- UAE Machine Learning Market Statistics, 2023-2033F
- Market Size & Growth Outlook
- By Revenues in USD Million
- Market Segmentation & Growth Outlook
- By Component- Market Insights and Forecast 2023-2033, USD Million
- By Deployment- Market Insights and Forecast 2023-2033, USD Million
- By Enterprise Size- Market Insights and Forecast 2023-2033, USD Million
- By End Use- Market Insights and Forecast 2023-2033, USD Million
- Market Size & Growth Outlook
- Saudi Arabia Machine Learning Market Statistics, 2023-2033F
- Market Size & Growth Outlook
- By Revenues in USD Million
- Market Segmentation & Growth Outlook
- By Component- Market Insights and Forecast 2023-2033, USD Million
- By Deployment- Market Insights and Forecast 2023-2033, USD Million
- By Enterprise Size- Market Insights and Forecast 2023-2033, USD Million
- By End Use- Market Insights and Forecast 2023-2033, USD Million
- Market Size & Growth Outlook
- South Africa Machine Learning Market Statistics, 2023-2033F
- Market Size & Growth Outlook
- By Revenues in USD Million
- Market Segmentation & Growth Outlook
- By Component- Market Insights and Forecast 2023-2033, USD Million
- By Deployment- Market Insights and Forecast 2023-2033, USD Million
- By Enterprise Size- Market Insights and Forecast 2023-2033, USD Million
- By End Use- Market Insights and Forecast 2023-2033, USD Million
- Market Size & Growth Outlook
- Turkey Machine Learning Market Statistics, 2023-2033F
- Market Size & Growth Outlook
- By Revenues in USD Million
- Market Segmentation & Growth Outlook
- By Component- Market Insights and Forecast 2023-2033, USD Million
- By Deployment- Market Insights and Forecast 2023-2033, USD Million
- By Enterprise Size- Market Insights and Forecast 2023-2033, USD Million
- By End Use- Market Insights and Forecast 2023-2033, USD Million
- Market Size & Growth Outlook
- Market Size & Growth Outlook
- Asia Pacific Machine Learning Market Statistics, 2023-2033F
- Market Size & Growth Outlook
- By Revenues in USD Million
- Market Segmentation & Growth Outlook
- By Component- Market Insights and Forecast 2023-2033, USD Million
- By Deployment- Market Insights and Forecast 2023-2033, USD Million
- By Enterprise Size- Market Insights and Forecast 2023-2033, USD Million
- By End Use- Market Insights and Forecast 2023-2033, USD Million
- By Country
- China
- India
- Japan
- South Korea
- Australia
- Southeast Asia
- Rest of Asia Pacific
- China Machine Learning Market Statistics, 2023-2033F
- Market Size & Growth Outlook
- By Revenues in USD Million
- Market Segmentation & Growth Outlook
- By Component- Market Insights and Forecast 2023-2033, USD Million
- By Deployment- Market Insights and Forecast 2023-2033, USD Million
- By Enterprise Size- Market Insights and Forecast 2023-2033, USD Million
- By End Use- Market Insights and Forecast 2023-2033, USD Million
- Market Size & Growth Outlook
- India Machine Learning Market Statistics, 2023-2033F
- Market Size & Growth Outlook
- By Revenues in USD Million
- Market Segmentation & Growth Outlook
- By Component- Market Insights and Forecast 2023-2033, USD Million
- By Deployment- Market Insights and Forecast 2023-2033, USD Million
- By Enterprise Size- Market Insights and Forecast 2023-2033, USD Million
- By End Use- Market Insights and Forecast 2023-2033, USD Million
- Market Size & Growth Outlook
- Japan Machine Learning Market Statistics, 2023-2033F
- Market Size & Growth Outlook
- By Revenues in USD Million
- Market Segmentation & Growth Outlook
- By Component- Market Insights and Forecast 2023-2033, USD Million
- By Deployment- Market Insights and Forecast 2023-2033, USD Million
- By Enterprise Size- Market Insights and Forecast 2023-2033, USD Million
- By End Use- Market Insights and Forecast 2023-2033, USD Million
- Market Size & Growth Outlook
- South Korea Machine Learning Market Statistics, 2023-2033F
- Market Size & Growth Outlook
- By Revenues in USD Million
- Market Segmentation & Growth Outlook
- By Component- Market Insights and Forecast 2023-2033, USD Million
- By Deployment- Market Insights and Forecast 2023-2033, USD Million
- By Enterprise Size- Market Insights and Forecast 2023-2033, USD Million
- By End Use- Market Insights and Forecast 2023-2033, USD Million
- Market Size & Growth Outlook
- Australia Machine Learning Market Statistics, 2023-2033F
- Market Size & Growth Outlook
- By Revenues in USD Million
- Market Segmentation & Growth Outlook
- By Component- Market Insights and Forecast 2023-2033, USD Million
- By Deployment- Market Insights and Forecast 2023-2033, USD Million
- By Enterprise Size- Market Insights and Forecast 2023-2033, USD Million
- By End Use- Market Insights and Forecast 2023-2033, USD Million
- Market Size & Growth Outlook
- Southeast Asia Machine Learning Market Statistics, 2023-2033F
- Market Size & Growth Outlook
- By Revenues in USD Million
- Market Segmentation & Growth Outlook
- By Component- Market Insights and Forecast 2023-2033, USD Million
- By Deployment- Market Insights and Forecast 2023-2033, USD Million
- By Enterprise Size- Market Insights and Forecast 2023-2033, USD Million
- By End Use- Market Insights and Forecast 2023-2033, USD Million
- Market Size & Growth Outlook
- Market Size & Growth Outlook
- Competitive Outlook
- Company Profiles
- NVIDIA Corporation
- Business Description
- Product Portfolio
- Collaborations & Alliances
- Recent Developments
- Financial Details
- Others
- Microsoft Corporation
- Business Description
- Product Portfolio
- Collaborations & Alliances
- Recent Developments
- Financial Details
- Others
- Amazon.com, Inc. (Amazon Web Services)
- Business Description
- Product Portfolio
- Collaborations & Alliances
- Recent Developments
- Financial Details
- Others
- Google LLC (Google Cloud)
- Business Description
- Product Portfolio
- Collaborations & Alliances
- Recent Developments
- Financial Details
- Others
- Super Micro Computer, Inc. (Supermicro)
- Business Description
- Product Portfolio
- Collaborations & Alliances
- Recent Developments
- Financial Details
- Others
- Dell Technologies Inc.
- Business Description
- Product Portfolio
- Collaborations & Alliances
- Recent Developments
- Financial Details
- Others
- Broadcom Inc.
- Business Description
- Product Portfolio
- Collaborations & Alliances
- Recent Developments
- Financial Details
- Others
- Oracle Corporation
- Business Description
- Product Portfolio
- Collaborations & Alliances
- Recent Developments
- Financial Details
- Others
- Advanced Micro Devices, Inc.
- Business Description
- Product Portfolio
- Collaborations & Alliances
- Recent Developments
- Financial Details
- Others
- Huawei Technologies Co. Ltd
- Business Description
- Product Portfolio
- Collaborations & Alliances
- Recent Developments
- Financial Details
- Others
- International Business Machines Corporation
- Business Description
- Product Portfolio
- Collaborations & Alliances
- Recent Developments
- Financial Details
- Others
- Accenture PLC
- Business Description
- Product Portfolio
- Collaborations & Alliances
- Recent Developments
- Financial Details
- Others
- Hewlett Packard Enterprise Company
- Business Description
- Product Portfolio
- Collaborations & Alliances
- Recent Developments
- Financial Details
- Others
- Alibaba Group Holding Limited (Alibaba Cloud)
- Business Description
- Product Portfolio
- Collaborations & Alliances
- Recent Developments
- Financial Details
- Others
- Databricks, Inc.
- Business Description
- Product Portfolio
- Collaborations & Alliances
- Recent Developments
- Financial Details
- Others
- NVIDIA Corporation
- Company Profiles
- Disclaimer
| Segment | Sub-Segment |
|---|---|
| By Component |
|
| By Deployment |
|
| By Enterprise Size |
|
| By End Use |
|
| By Region |
|
Research Methodology
This study followed a structured approach comprising four key phases to assess the size and scope of the electro-oxidation market. The process began with thorough secondary research to collect data on the target market, related markets, and broader industry context. These findings, along with preliminary assumptions and estimates, were then validated through extensive primary research involving industry experts from across the value chain. To calculate the overall market size, both top-down and bottom-up methodologies were employed. Finally, market segmentation and data triangulation techniques were applied to refine and validate segment-level estimations.
Secondary Research
The secondary research phase involved gathering data from a wide range of credible and published sources. This step helped in identifying industry trends, defining market segmentation, and understanding the market landscape and value chain.
Sources consulted during this phase included:
- Company annual reports, investor presentations, and press releases
- Industry white papers and certified publications
- Trade directories and market-recognized databases
- Articles from authoritative authors and reputable journals
- Gold and silver standard websites
Secondary research was critical in mapping out the industry's value chain and monetary flow, identifying key market segments, understanding regional variations, and tracking significant industry developments.
Other key sources:
- Financial disclosures
- Industry associations and trade bodies
- News outlets and business magazines
- Academic journals and research studies
- Paid industry databases
Primary Research
To validate secondary data and gain deeper market insights, primary research was conducted with key stakeholders across both the supply and demand sides of the market.
On the demand side, participants included decision-makers and influencers from end-user industries—such as CIOs, CTOs, and CSOs—who provided first-hand perspectives on market needs, product usage, and future expectations.
On the supply side, interviews were conducted with manufacturers, industry associations, and institutional participants to gather insights into current offerings, product pipelines, and market challenges.
Primary interviews provided critical inputs such as:
- Market size and revenue data
- Product and service breakdowns
- Market forecasts
- Regional and application-specific trends
Stakeholders consulted included:
- Leading OEM and solution providers
- Channel and distribution partners
- End users across various applications
- Independent consultants and industry specialists
Market Size Estimation and Data Triangulation
- Identifying Key Market Participants (Secondary Research)
- Goal: To identify the major players or companies in the target market. This typically involves using publicly available data sources such as industry reports, market research publications, and financial statements of companies.
- Tools: Reports from firms like Gartner, Forrester, Euromonitor, Statista, IBISWorld, and others. Public financial statements, news articles, and press releases from top market players.
- Extracting Earnings of Key Market Participants
- Goal: To estimate the earnings generated from the product or service being analyzed. This step helps in understanding the revenue potential of each market player in a specific geography.
- Methods: Earnings data can be gathered from:
- Publicly available financial reports (for listed companies).
- Interviews and primary data sources from professionals, such as Directors, VPs, SVPs, etc. This is especially useful for understanding more nuanced, internal data that isn't publicly disclosed.
- Annual reports and investor presentations of key players.
- Data Collation and Development of a Relevant Data Model
- Goal: To collate inputs from both primary and secondary sources into a structured, data-driven model for market estimation. This model will incorporate key market KPIs and any independent variables relevant to the market.
- Key KPIs: These could include:
- Market size, growth rate, and demand drivers.
- Industry-specific metrics like market share, average revenue per customer (ARPC), or average deal size.
- External variables, such as economic growth rates, inflation rates, or commodity prices, that could affect the market.
- Data Modeling: Based on this data, the market forecasts are developed for the next 5 years. A combination of trend analysis, scenario modeling, and statistical regression might be used to generate projections.
- Scenario Analysis
- Goal: To test different assumptions and validate how sensitive the market is to changes in key variables (e.g., market demand, regulatory changes, technological disruptions).
- Types of Scenarios:
- Base Case: Based on current assumptions and historical data.
- Best-Case Scenario: Assuming favorable market conditions, regulatory environments, and technological advancements.
- Worst-Case Scenario: Accounting for adverse factors, such as economic downturns, stricter regulations, or unexpected disruptions.