Global Reinsurance Market Report: Trends, Growth and Forecast (2027-2033)
By Reinsurance Type (Facultative Reinsurance, Treaty Reinsurance), By Line of Business (Property & Casualty, Life & Health, Specialty, Aviation, Marine, Energy, Others), By Distribution Channel (Direct Writing, Broker-Mediated), By Capital Source (Traditional Rated Reinsurers, Alternative Capital, ILS, Sidecars), By Region (North America, South America, Europe, Middle East & Africa, Asia Pacific) ... Read more
|
Major Players
|
Reinsurance Market Overview
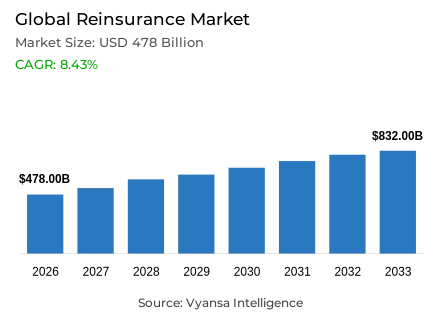
The reinsurance market involves the transfer of insurance risks from primary insurers to reinsurers in exchange for premiums. It enables insurers to manage potential losses, strengthen financial stability, and expand underwriting capacity. The market encompasses treaty and facultative reinsurance across life, non-life, property, casualty, and specialty insurance segments. The Reinsurance market is forecast to grow at a compound annual growth rate (CAGR) of 8.43% between 2027 and 2033.
Key Highlights of the Reinsurance Market
- The Reinsurance market was valued at USD 478 billion in 2026 and is estimated at USD 512 billion in 2027 and projected to reach USD 832 billion by 2033.
- The market is forecast to expand at a CAGR of 8.43% between 2027 and 2033.
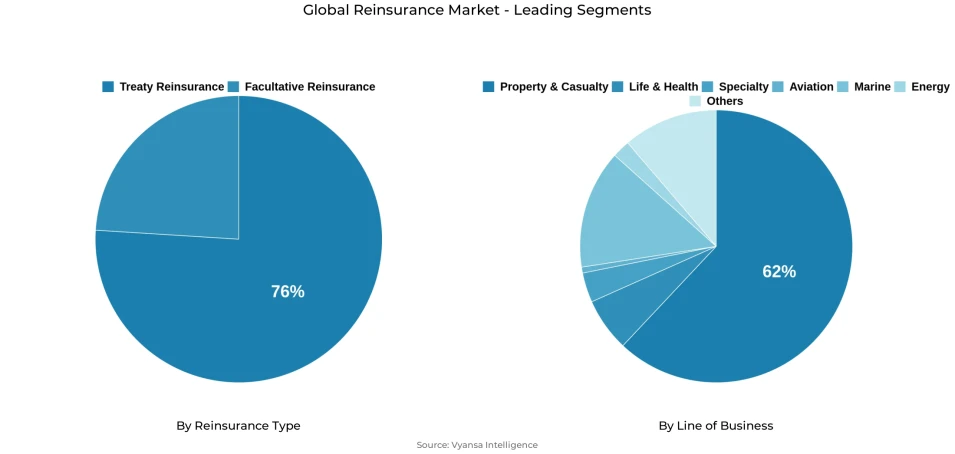
- By reinsurance type, treaty reinsurance led the market with a 76% share in 2026.
- Facultative reinsurance is the fastest-growing reinsurance type in the market, expanding at a CAGR of 10.58% between 2027 and 2033.
- By line of business, Property & Casualty led the market with a 62% share in 2026.
- Specialty (Aviation, Marine, Energy) is the fastest-growing line of business in the market, expanding at a CAGR of 16.01% between 2027 and 2033.
- Europe led the Reinsurance market with a 40% market share in 2026.
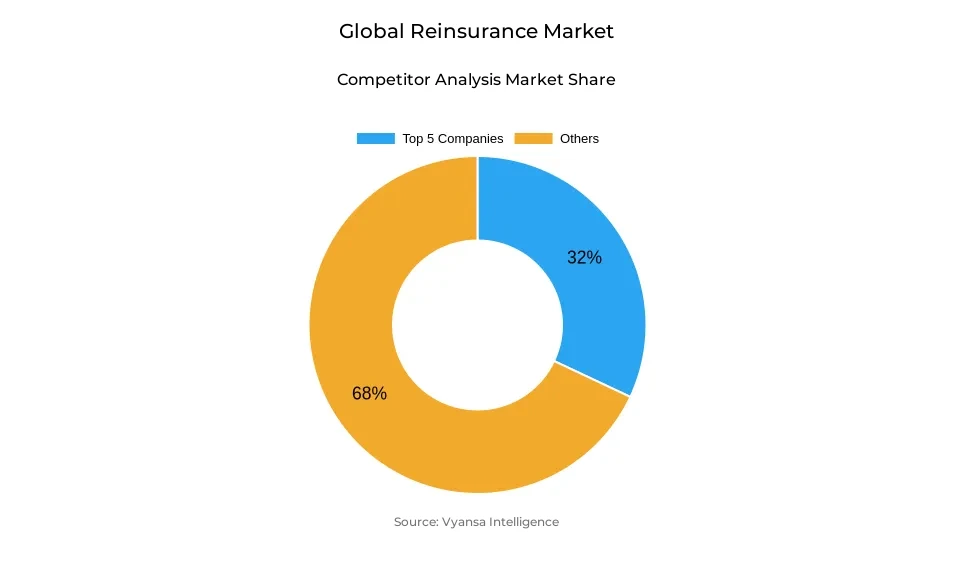
- The market is moderately fragmented, with the top five companies holding a combined 32% share in 2026.
Insurance exposures are increasing globally as property values, infrastructure investment and business concentration raise the potential cost of individual events. Natural catastrophes generated approximately USD 220 billion in economic losses during 2025, of which USD 107 billion was insured. Only 49% of the losses were covered, while secondary perils such as floods, severe storms and wildfires represented 92% of insured catastrophe losses. This combination of rising losses and limited protection gives insurers and governments a continuing reason to secure additional reinsurance capacity.
Available capacity remains capable of supporting this demand. Reinsurance capital reached approximately USD 800 billion by June 2026, providing insurers with access to traditional balance sheets and third-party capital. A broader capital base allows cedants to purchase higher limits, obtain protection against a wider range of events and use reinsurance to support new underwriting rather than only recover from exceptional losses.
Demand should continue to expand as insurers manage property accumulation, liability volatility, longevity exposure and increasingly specialized commercial assets. Competitive capacity may place pressure on pricing, but lower prices can also make additional layers and wider coverage more affordable. Through the forecast period, growth should increasingly depend on the amount and variety of risk transferred, with reinsurers that combine substantial capital, specialist underwriting and flexible structures positioned to capture continuing demand.
Reinsurance Market Government Compliance
Saudi Arabia Strengthens Domestic Reinsurance Participation
Effective January 2025, Saudi Arabia introduced a requirement for insurers to offer at least 30% of treaty reinsurance programs and facultative risks to locally licensed reinsurers under a first-right-of-refusal mechanism. The regulation prioritizes domestic reinsurance capacity before insurers approach international providers. This measure creates opportunities for local reinsurers to expand their participation in existing business while increasing the importance of maintaining adequate underwriting capacity and regulatory compliance.
Japan Introduces Economic Value-Based Solvency Requirements
Japan implemented its economic value-based solvency framework for financial years ending on or after March 31, 2026. The framework strengthens the assessment of insurers' financial positions by measuring assets and liabilities on an economic value basis and improving the evaluation of market and insurance risks. This regulatory shift may encourage insurers to reassess their reinsurance arrangements to manage capital requirements, reduce solvency volatility, and strengthen balance-sheet resilience. However, the extent of additional demand for capital-relief and longevity reinsurance will depend on individual insurers' risk exposures and capital positions.
Brazil Updates Its Reinsurance Regulatory Framework
In July 2026, Brazil published Resolution CNSP No. 494, which takes effect on January 2, 2027. The resolution updates requirements governing reinsurance, retrocession, co-insurance, foreign-currency contracts, and overseas placements. The revised framework establishes updated operating requirements for insurers and reinsurers, including contractual and procedural obligations. Its implementation may improve regulatory clarity and placement processes, although international participants will need to align their documentation and contracting arrangements with the revised requirements.
Reinsurance Market Drivers
Rising Insured Values Increase Required Reinsurance Limits
The amount of reinsurance purchased depends partly on the maximum losses that primary insurers could face. Higher property values, construction costs and infrastructure concentration increase the amount that can be lost in a single event, even when the number of insured properties remains unchanged. Cedants must therefore raise program limits or purchase additional layers to keep their retained exposure within capital tolerances.
Swiss Re estimates that real insured natural catastrophe losses have followed a long-term annual growth trend of 5% to 7%. Exposure accumulation accounts for more than 80% of this increase, and annual insured losses could approach USD 186 billion by 2030 if the trend continues. These losses would require more catastrophe capacity from reinsurers rather than relying entirely on price increases within existing programs.
The effect extends beyond catastrophe cover. Larger industrial facilities, transport assets and commercial portfolios require higher liability and specialty limits, while growing life portfolios create additional mortality and longevity exposure. Reinsurers can address this demand through excess-of-loss layers, quota-share arrangements and aggregate covers. Continued growth in insured values should therefore increase the amount of risk transferred throughout the forecast period.
Reinsurance Market Challenges
Abundant Capacity Pressures Reinsurance Pricing
Reinsurance capacity has expanded faster than demand in several property catastrophe programs, giving cedants greater negotiating power during renewals. Insurers can obtain broader terms, additional reinstatements, and lower attachment points while paying less for each unit of protection. Although this makes reinsurance more accessible, it reduces the premium earned by reinsurers for assuming comparable exposure.
Hannover Re reported that risk-adjusted prices declined 3.2% during the January 2026 renewals and 4.5% during the June and July renewals. Wider market assessments also indicate double-digit price reductions for some loss-free property catastrophe programs. Competitive pressure is particularly strong where traditional reinsurers and insurance-linked securities funds are both willing to provide capacity.
Reinsurers must consequently balance volume growth against underwriting quality. Reducing prices too aggressively can weaken returns if catastrophe activity normalizes or earlier casualty claims develop more severely than expected. Suppliers will need to preserve adequate terms, diversify their portfolios and direct capacity toward risks where technical expertise supports more sustainable pricing.
Reinsurance Market Recent Trends
Third-Party Capital Expands Beyond Catastrophe Bonds
Pension funds, asset managers and other institutional investors are supplying more capital to reinsurance through catastrophe bonds, collateralized reinsurance and sidecars. Global insurance-linked securities capital reached USD 144.5 billion by June 2026, representing average annual growth of 8.3% over five years. Catastrophe bond issuance reached USD 24.9 billion during the preceding 12 months, increasing the capacity available for catastrophe protection.
Investor participation is also moving beyond conventional property catastrophe transactions. In January 2026, QBE Re completed George Street Re, a fully collateralized casualty sidecar supported by more than USD 550 million of investor commitments. The structure allows investors to participate in casualty underwriting while giving the reinsurer additional capacity without funding the complete exposure through its own balance sheet.
This development broadens the range of risks that can attract alternative capital. Reinsurers with established underwriting records and portfolio data can use sidecars and quota-share structures to expand capacity, while investors gain access to insurance risk that is less directly connected to financial markets.
Artificial Intelligence Standardizes Underwriting and Placement Data
Reinsurance underwriting frequently depends on information submitted through emails, spreadsheets and differently formatted documents. Underwriters must organise this information before evaluating exposure, checking appetite and preparing terms. Artificial intelligence is increasingly being introduced to extract submission data, identify missing information and route risks to suitable underwriting teams.
Concirrus introduced its Inspire platform for specialty insurance in February 2026. The platform covers submission intake, triage, exposure management, quoting, sanctions screening and binding, with the company reporting reductions of up to 70% in manual work. In May 2026, ACORD Solutions Group added architecture that enables artificial intelligence agents to interact with its ADEPT and Transcriber data systems.
These systems can improve quotation speed and consistency when supported by reliable data standards and human oversight. Reinsurers can also reuse structured placement information for accounting, claims and exposure aggregation. Adoption should therefore be strongest among companies seeking to handle more submissions without proportionately increasing administrative workloads.
Reinsurance Market Future Opportunities
Data Centre Expansion Creates High-Limit Reinsurance Demand
Rapid construction of artificial intelligence and cloud infrastructure is creating individual sites with unusually high concentrations of property, machinery and business-interruption exposure. Swiss Re expects data center insurance premiums to increase from USD 10.6 billion to USD 24.2 billion by 2030. Some individual facilities could represent more than USD 20 billion of accumulated value once buildings, servers and supporting infrastructure are considered.
These facilities face interconnected risks from fire, cooling-system failure, power interruption, cyber incidents and natural catastrophes. Their dependence on specialized equipment and continuous operation can also make business-interruption losses substantially larger than the physical damage. Primary insurers may therefore be unable to retain sufficient capacity for an entire site or development program.
Reinsurers can address the gap through project-specific facultative placements, construction treaties, quota shares and consortium arrangements. The Fidelis Partnership launched a construction consortium for artificial intelligence data centers in 2026 with USD 250 million of capacity. Continued investment in hyperscale facilities should create demand for additional reinsurance limits and specialist modelling throughout construction and subsequent operation.
Unlock Market Intelligence
Explore the market potential with our data-driven report
Reinsurance Market Segmentation Analysis
By Reinsurance Type:
- Facultative Reinsurance
- Treaty Reinsurance
Portfolio Treaties Command 76% of Reinsurance Demand
Treaty reinsurance accounted for 76% of the Reinsurance market in 2026. It enables an insurer to transfer an agreed portion of an entire portfolio under one contract, making it suitable for recurring property, casualty, life and catastrophe books. Proportional treaties can share premiums and losses, while excess-of-loss treaties protect the cedant when losses exceed an agreed retention. This portfolio-level coverage supports substantial and recurring demand at annual renewals.
Facultative reinsurance is forecast to grow at a CAGR of 10.58% between 2027 and 2033. It is arranged for individual risks that are unusually large, complex or outside the terms of an existing treaty. In a 2026 survey of 380 insurance decision-makers, 60% expected their organizations to increase facultative use over the following two years, while 52% identified capital management as an important reason for purchasing it. Growth should be supported by data centers, infrastructure, energy projects and other assets requiring individually negotiated capacity.
By Line of Business:
- Property & Casualty
- Life & Health
- Specialty (Aviation, Marine, Energy)
- Others
Property and Casualty Cover Anchors 62% of Reinsurance Demand
Property and casualty accounted for 62% of the Reinsurance market in 2026. The segment covers frequently renewed property catastrophe, motor, liability and commercial insurance portfolios. Reinsurance helps primary insurers manage the accumulation of losses across many policyholders and protect their capital against severe events. Its leadership is reinforced by the recurring nature of annual programmes and the substantial limits required for catastrophe-exposed property portfolios.
Specialty reinsurance is forecast to grow at a CAGR of 16.01% between 2027 and 2033. Global energy investment is expected to reach USD 3.4 trillion in 2026, expanding the value of power-generation, transmission and fuel infrastructure requiring insurance. In June 2026, Lloyd’s and Chubb led a consortium offering up to USD 200 million of hull and protection and indemnity capacity and a further USD 200 million for cargo exposed to conflict-related disruption around the Strait of Hormuz. Increasingly concentrated aviation, marine and energy risks should sustain demand for specialist reinsurance expertise and capacity
Unlock Market Intelligence
Explore the market potential with our data-driven report
Reinsurance Market Regional Analysis
Europe accounted for 40% of the Reinsurance market in 2026. The region contains several of the world’s largest reinsurance groups and mature primary insurance markets that generate recurring property, casualty, life and specialty placements. In February 2026, the European Insurance and Occupational Pensions Authority opened consultation on recognizing natural catastrophe adaptation measures under Solvency II. Incorporating risk-reduction measures into insurance assessment could support continued coverage of properties facing flood, wildfire and storm exposure while giving reinsurers better information for pricing ceded portfolios.
Asia Pacific is forecast to grow at a CAGR of 12.70% between 2027 and 2033. Growth is supported by expanding insured assets, substantial infrastructure investment and increasing use of capital-market protection. Australia finalized changes to its general insurance framework in July 2026 to improve access to alternative reinsurance structures from January 2027. The Asian Development Bank also issued its first disaster-relief catastrophe bonds in May 2026, providing USD 160 million of earthquake and extreme-precipitation protection for Kyrgyzstan and Tajikistan. These developments widen the region’s sources of risk-transfer capacity and support faster adoption of reinsurance solutions.

Reinsurance Market Competitive Landscape
The industry is moderately fragmented, with the top five companies holding a combined 32% share in 2026 and a long tail of other reinsurers sharing the remainder. The five leading companies, ranked by presence, are Munich Reinsurance Company, Swiss Re Ltd, Hannover Rück SE, Berkshire Hathaway Inc. (including brands) and SCOR SE, all of which are profiled in the section that follows.
Key Companies in the Reinsurance Market
- Munich Reinsurance Company
- Swiss Re Ltd
- Hannover Rück SE
- Berkshire Hathaway Inc. (including brands)
- SCOR SE
- Reinsurance Group of America, Incorporated
- China Reinsurance (Group) Corporation (including brands)
- Everest Group, Ltd.
- RenaissanceRe Holdings Ltd.
- Arch Capital Group Ltd.
- Fairfax Financial Holdings Limited (including brands)
- MAPFRE RE, COMPAÑÍA DE REASEGUROS, S.A.
- MS&AD Insurance Group Holdings, Inc. (including brands)
- Korean Reinsurance Company
- Sompo Holdings, Inc. (Sompo)
Company Profiling
The following profiles cover the five leading companies shaping product development, capacity and competitive positioning in the industry.
Munich Reinsurance Company: Munich Reinsurance Company provides treaty and facultative reinsurance across property and casualty, life and health, cyber and specialty risks. Its international operations and technical risk-modelling capabilities allow it to support both large global programmes and specialised placements. In August 2026, the company agreed to acquire cyber insurance and risk-management company At-Bay, strengthening its position in cyber underwriting and loss prevention.
Swiss Re Ltd: Swiss Re Ltd provides property and casualty and life and health reinsurance to insurers, corporations and public-sector clients. The company also participates in insurance-linked securities, public-sector risk transfer and structured capital solutions. In March 2026, Swiss Re completed its first longevity reinsurance transaction covering retirees in the United States, extending its longevity-risk operations into another major pension market.
Hannover Rück SE: Hannover Rück SE provides property and casualty and life and health reinsurance through a global network. Its business includes conventional treaties, structured reinsurance and access to third-party capital. In September 2026, the company reported that Hannover Re Capital Partners had written additional non-proportional catastrophe business under its first third-party capital mandates, expanding its role in managing investor-backed reinsurance capacity.
Berkshire Hathaway Inc. (General Re and National Indemnity Company): Berkshire Hathaway participates in Reinsurance through General Re and National Indemnity Company. Its substantial capital base supports long-duration, high-limit and portfolio-scale transactions that can be difficult for smaller reinsurers to absorb. In March 2026, National Indemnity Company entered a strategic partnership with Tokio Marine to assume part of its non-life insurance portfolio and provide long-term underwriting capacity.
SCOR SE: SCOR SE provides property and casualty and life and health reinsurance through operations across major insurance markets. Its portfolio includes catastrophe, agriculture, credit, marine, energy, mortality and longevity risks. In July 2026, SCOR signed an agreement with Japan Post Insurance concerning the retrocession of postal life policies and the proposed establishment of a dedicated reinsurance vehicle.
Recent Developments in the Reinsurance Market
May 2026: The Fidelis Partnership (TFP) and Howden introduced the Broker Connect system to facilitate reinsurance placements and strengthen collaboration between brokers and underwriters. The platform aimed to improve placement efficiency, accelerate submission processing, and streamline communication workflows, supporting more coordinated interactions among market participants.
December 2025: Allianz and Oaktree Capital Management established Syndicate 1890 at Lloyd’s to strengthen Allianz’s reinsurance capabilities. The syndicate provides multi-year, AA-rated capacity and facilitates access to third-party capital, supporting diversified risk transfer strategies and expanding reinsurance capacity for complex risks.
Frequently Asked Questions
Related Report
- Market Segmentation
- Research Scope
- Research Methodology
- Definitions and Assumptions
- Executive Summary
- Global Reinsurance Market Policies, Regulations, and Standards
- Global Reinsurance Market Dynamics
- Growth Factors
- Challenges
- Trends
- Opportunities
- Global Reinsurance Market Statistics, 2023-2033F
- Market Size & Growth Outlook
- By Revenues in USD Million
- Market Segmentation & Growth Outlook
- By Reinsurance Type
- Facultative Reinsurance- Market Insights and Forecast 2023-2033, USD Million
- Treaty Reinsurance- Market Insights and Forecast 2023-2033, USD Million
- By Line of Business
- Property & Casualty- Market Insights and Forecast 2023-2033, USD Million
- Life & Health- Market Insights and Forecast 2023-2033, USD Million
- Specialty- Market Insights and Forecast 2023-2033, USD Million
- Aviation- Market Insights and Forecast 2023-2033, USD Million
- Marine- Market Insights and Forecast 2023-2033, USD Million
- Energy- Market Insights and Forecast 2023-2033, USD Million
- Others- Market Insights and Forecast 2023-2033, USD Million
- By Distribution Channel
- Direct Writing- Market Insights and Forecast 2023-2033, USD Million
- Broker-Mediated- Market Insights and Forecast 2023-2033, USD Million
- By Capital Source
- Traditional Rated Reinsurers- Market Insights and Forecast 2023-2033, USD Million
- Alternative Capital- Market Insights and Forecast 2023-2033, USD Million
- ILS- Market Insights and Forecast 2023-2033, USD Million
- Sidecars- Market Insights and Forecast 2023-2033, USD Million
- By Region
- North America
- South America
- Europe
- Middle East & Africa
- Asia Pacific
- By Competitors
- Competition Characteristics
- Market Share & Analysis
- By Reinsurance Type
- Market Size & Growth Outlook
- North America Reinsurance Market Statistics, 2023-2033F
- Market Size & Growth Outlook
- By Revenues in USD Million
- Market Segmentation & Growth Outlook
- By Reinsurance Type- Market Insights and Forecast 2023-2033, USD Million
- By Line of Business- Market Insights and Forecast 2023-2033, USD Million
- By Distribution Channel- Market Insights and Forecast 2023-2033, USD Million
- By Capital Source- Market Insights and Forecast 2023-2033, USD Million
- By Country
- The US
- Canada
- Mexico
- The US Reinsurance Market Statistics, 2023-2033F
- Market Size & Growth Outlook
- By Revenues in USD Million
- Market Segmentation & Growth Outlook
- By Reinsurance Type- Market Insights and Forecast 2023-2033, USD Million
- By Line of Business- Market Insights and Forecast 2023-2033, USD Million
- By Distribution Channel- Market Insights and Forecast 2023-2033, USD Million
- By Capital Source- Market Insights and Forecast 2023-2033, USD Million
- Market Size & Growth Outlook
- Canada Reinsurance Market Statistics, 2023-2033F
- Market Size & Growth Outlook
- By Revenues in USD Million
- Market Segmentation & Growth Outlook
- By Reinsurance Type- Market Insights and Forecast 2023-2033, USD Million
- By Line of Business- Market Insights and Forecast 2023-2033, USD Million
- By Distribution Channel- Market Insights and Forecast 2023-2033, USD Million
- By Capital Source- Market Insights and Forecast 2023-2033, USD Million
- Market Size & Growth Outlook
- Mexico Reinsurance Market Statistics, 2023-2033F
- Market Size & Growth Outlook
- By Revenues in USD Million
- Market Segmentation & Growth Outlook
- By Reinsurance Type- Market Insights and Forecast 2023-2033, USD Million
- By Line of Business- Market Insights and Forecast 2023-2033, USD Million
- By Distribution Channel- Market Insights and Forecast 2023-2033, USD Million
- By Capital Source- Market Insights and Forecast 2023-2033, USD Million
- Market Size & Growth Outlook
- Market Size & Growth Outlook
- South America Reinsurance Market Statistics, 2023-2033F
- Market Size & Growth Outlook
- By Revenues in USD Million
- Market Segmentation & Growth Outlook
- By Reinsurance Type- Market Insights and Forecast 2023-2033, USD Million
- By Line of Business- Market Insights and Forecast 2023-2033, USD Million
- By Distribution Channel- Market Insights and Forecast 2023-2033, USD Million
- By Capital Source- Market Insights and Forecast 2023-2033, USD Million
- By Country
- Brazil
- Argentina
- Chile
- Rest of South America
- Brazil Reinsurance Market Statistics, 2023-2033F
- Market Size & Growth Outlook
- By Revenues in USD Million
- Market Segmentation & Growth Outlook
- By Reinsurance Type- Market Insights and Forecast 2023-2033, USD Million
- By Line of Business- Market Insights and Forecast 2023-2033, USD Million
- By Distribution Channel- Market Insights and Forecast 2023-2033, USD Million
- By Capital Source- Market Insights and Forecast 2023-2033, USD Million
- Market Size & Growth Outlook
- Argentina Reinsurance Market Statistics, 2023-2033F
- Market Size & Growth Outlook
- By Revenues in USD Million
- Market Segmentation & Growth Outlook
- By Reinsurance Type- Market Insights and Forecast 2023-2033, USD Million
- By Line of Business- Market Insights and Forecast 2023-2033, USD Million
- By Distribution Channel- Market Insights and Forecast 2023-2033, USD Million
- By Capital Source- Market Insights and Forecast 2023-2033, USD Million
- Market Size & Growth Outlook
- Chile Reinsurance Market Statistics, 2023-2033F
- Market Size & Growth Outlook
- By Revenues in USD Million
- Market Segmentation & Growth Outlook
- By Reinsurance Type- Market Insights and Forecast 2023-2033, USD Million
- By Line of Business- Market Insights and Forecast 2023-2033, USD Million
- By Distribution Channel- Market Insights and Forecast 2023-2033, USD Million
- By Capital Source- Market Insights and Forecast 2023-2033, USD Million
- Market Size & Growth Outlook
- Market Size & Growth Outlook
- Europe Reinsurance Market Statistics, 2023-2033F
- Market Size & Growth Outlook
- By Revenues in USD Million
- Market Segmentation & Growth Outlook
- By Reinsurance Type- Market Insights and Forecast 2023-2033, USD Million
- By Line of Business- Market Insights and Forecast 2023-2033, USD Million
- By Distribution Channel- Market Insights and Forecast 2023-2033, USD Million
- By Capital Source- Market Insights and Forecast 2023-2033, USD Million
- By Country
- Germany
- The UK
- France
- Italy
- Spain
- BENELUX
- Nordics
- Rest of Europe
- Germany Reinsurance Market Statistics, 2023-2033F
- Market Size & Growth Outlook
- By Revenues in USD Million
- Market Segmentation & Growth Outlook
- By Reinsurance Type- Market Insights and Forecast 2023-2033, USD Million
- By Line of Business- Market Insights and Forecast 2023-2033, USD Million
- By Distribution Channel- Market Insights and Forecast 2023-2033, USD Million
- By Capital Source- Market Insights and Forecast 2023-2033, USD Million
- Market Size & Growth Outlook
- The UK Reinsurance Market Statistics, 2023-2033F
- Market Size & Growth Outlook
- By Revenues in USD Million
- Market Segmentation & Growth Outlook
- By Reinsurance Type- Market Insights and Forecast 2023-2033, USD Million
- By Line of Business- Market Insights and Forecast 2023-2033, USD Million
- By Distribution Channel- Market Insights and Forecast 2023-2033, USD Million
- By Capital Source- Market Insights and Forecast 2023-2033, USD Million
- Market Size & Growth Outlook
- France Reinsurance Market Statistics, 2023-2033F
- Market Size & Growth Outlook
- By Revenues in USD Million
- Market Segmentation & Growth Outlook
- By Reinsurance Type- Market Insights and Forecast 2023-2033, USD Million
- By Line of Business- Market Insights and Forecast 2023-2033, USD Million
- By Distribution Channel- Market Insights and Forecast 2023-2033, USD Million
- By Capital Source- Market Insights and Forecast 2023-2033, USD Million
- Market Size & Growth Outlook
- Italy Reinsurance Market Statistics, 2023-2033F
- Market Size & Growth Outlook
- By Revenues in USD Million
- Market Segmentation & Growth Outlook
- By Reinsurance Type- Market Insights and Forecast 2023-2033, USD Million
- By Line of Business- Market Insights and Forecast 2023-2033, USD Million
- By Distribution Channel- Market Insights and Forecast 2023-2033, USD Million
- By Capital Source- Market Insights and Forecast 2023-2033, USD Million
- Market Size & Growth Outlook
- Spain Reinsurance Market Statistics, 2023-2033F
- Market Size & Growth Outlook
- By Revenues in USD Million
- Market Segmentation & Growth Outlook
- By Reinsurance Type- Market Insights and Forecast 2023-2033, USD Million
- By Line of Business- Market Insights and Forecast 2023-2033, USD Million
- By Distribution Channel- Market Insights and Forecast 2023-2033, USD Million
- By Capital Source- Market Insights and Forecast 2023-2033, USD Million
- Market Size & Growth Outlook
- BENELUX Reinsurance Market Statistics, 2023-2033F
- Market Size & Growth Outlook
- By Revenues in USD Million
- Market Segmentation & Growth Outlook
- By Reinsurance Type- Market Insights and Forecast 2023-2033, USD Million
- By Line of Business- Market Insights and Forecast 2023-2033, USD Million
- By Distribution Channel- Market Insights and Forecast 2023-2033, USD Million
- By Capital Source- Market Insights and Forecast 2023-2033, USD Million
- Market Size & Growth Outlook
- Nordics Reinsurance Market Statistics, 2023-2033F
- Market Size & Growth Outlook
- By Revenues in USD Million
- Market Segmentation & Growth Outlook
- By Reinsurance Type- Market Insights and Forecast 2023-2033, USD Million
- By Line of Business- Market Insights and Forecast 2023-2033, USD Million
- By Distribution Channel- Market Insights and Forecast 2023-2033, USD Million
- By Capital Source- Market Insights and Forecast 2023-2033, USD Million
- Market Size & Growth Outlook
- Market Size & Growth Outlook
- Middle East & Africa Reinsurance Market Statistics, 2023-2033F
- Market Size & Growth Outlook
- By Revenues in USD Million
- Market Segmentation & Growth Outlook
- By Reinsurance Type- Market Insights and Forecast 2023-2033, USD Million
- By Line of Business- Market Insights and Forecast 2023-2033, USD Million
- By Distribution Channel- Market Insights and Forecast 2023-2033, USD Million
- By Capital Source- Market Insights and Forecast 2023-2033, USD Million
- By Country
- UAE
- Saudi Arabia
- South Africa
- Turkey
- Rest of Middle East & Africa
- UAE Reinsurance Market Statistics, 2023-2033F
- Market Size & Growth Outlook
- By Revenues in USD Million
- Market Segmentation & Growth Outlook
- By Reinsurance Type- Market Insights and Forecast 2023-2033, USD Million
- By Line of Business- Market Insights and Forecast 2023-2033, USD Million
- By Distribution Channel- Market Insights and Forecast 2023-2033, USD Million
- By Capital Source- Market Insights and Forecast 2023-2033, USD Million
- Market Size & Growth Outlook
- Saudi Arabia Reinsurance Market Statistics, 2023-2033F
- Market Size & Growth Outlook
- By Revenues in USD Million
- Market Segmentation & Growth Outlook
- By Reinsurance Type- Market Insights and Forecast 2023-2033, USD Million
- By Line of Business- Market Insights and Forecast 2023-2033, USD Million
- By Distribution Channel- Market Insights and Forecast 2023-2033, USD Million
- By Capital Source- Market Insights and Forecast 2023-2033, USD Million
- Market Size & Growth Outlook
- South Africa Reinsurance Market Statistics, 2023-2033F
- Market Size & Growth Outlook
- By Revenues in USD Million
- Market Segmentation & Growth Outlook
- By Reinsurance Type- Market Insights and Forecast 2023-2033, USD Million
- By Line of Business- Market Insights and Forecast 2023-2033, USD Million
- By Distribution Channel- Market Insights and Forecast 2023-2033, USD Million
- By Capital Source- Market Insights and Forecast 2023-2033, USD Million
- Market Size & Growth Outlook
- Turkey Reinsurance Market Statistics, 2023-2033F
- Market Size & Growth Outlook
- By Revenues in USD Million
- Market Segmentation & Growth Outlook
- By Reinsurance Type- Market Insights and Forecast 2023-2033, USD Million
- By Line of Business- Market Insights and Forecast 2023-2033, USD Million
- By Distribution Channel- Market Insights and Forecast 2023-2033, USD Million
- By Capital Source- Market Insights and Forecast 2023-2033, USD Million
- Market Size & Growth Outlook
- Market Size & Growth Outlook
- Asia Pacific Reinsurance Market Statistics, 2023-2033F
- Market Size & Growth Outlook
- By Revenues in USD Million
- Market Segmentation & Growth Outlook
- By Reinsurance Type- Market Insights and Forecast 2023-2033, USD Million
- By Line of Business- Market Insights and Forecast 2023-2033, USD Million
- By Distribution Channel- Market Insights and Forecast 2023-2033, USD Million
- By Capital Source- Market Insights and Forecast 2023-2033, USD Million
- By Country
- China
- India
- Japan
- South Korea
- Australia
- Southeast Asia
- Rest of Asia Pacific
- China Reinsurance Market Statistics, 2023-2033F
- Market Size & Growth Outlook
- By Revenues in USD Million
- Market Segmentation & Growth Outlook
- By Reinsurance Type- Market Insights and Forecast 2023-2033, USD Million
- By Line of Business- Market Insights and Forecast 2023-2033, USD Million
- By Distribution Channel- Market Insights and Forecast 2023-2033, USD Million
- By Capital Source- Market Insights and Forecast 2023-2033, USD Million
- Market Size & Growth Outlook
- India Reinsurance Market Statistics, 2023-2033F
- Market Size & Growth Outlook
- By Revenues in USD Million
- Market Segmentation & Growth Outlook
- By Reinsurance Type- Market Insights and Forecast 2023-2033, USD Million
- By Line of Business- Market Insights and Forecast 2023-2033, USD Million
- By Distribution Channel- Market Insights and Forecast 2023-2033, USD Million
- By Capital Source- Market Insights and Forecast 2023-2033, USD Million
- Market Size & Growth Outlook
- Japan Reinsurance Market Statistics, 2023-2033F
- Market Size & Growth Outlook
- By Revenues in USD Million
- Market Segmentation & Growth Outlook
- By Reinsurance Type- Market Insights and Forecast 2023-2033, USD Million
- By Line of Business- Market Insights and Forecast 2023-2033, USD Million
- By Distribution Channel- Market Insights and Forecast 2023-2033, USD Million
- By Capital Source- Market Insights and Forecast 2023-2033, USD Million
- Market Size & Growth Outlook
- South Korea Reinsurance Market Statistics, 2023-2033F
- Market Size & Growth Outlook
- By Revenues in USD Million
- Market Segmentation & Growth Outlook
- By Reinsurance Type- Market Insights and Forecast 2023-2033, USD Million
- By Line of Business- Market Insights and Forecast 2023-2033, USD Million
- By Distribution Channel- Market Insights and Forecast 2023-2033, USD Million
- By Capital Source- Market Insights and Forecast 2023-2033, USD Million
- Market Size & Growth Outlook
- Australia Reinsurance Market Statistics, 2023-2033F
- Market Size & Growth Outlook
- By Revenues in USD Million
- Market Segmentation & Growth Outlook
- By Reinsurance Type- Market Insights and Forecast 2023-2033, USD Million
- By Line of Business- Market Insights and Forecast 2023-2033, USD Million
- By Distribution Channel- Market Insights and Forecast 2023-2033, USD Million
- By Capital Source- Market Insights and Forecast 2023-2033, USD Million
- Market Size & Growth Outlook
- Southeast Asia Reinsurance Market Statistics, 2023-2033F
- Market Size & Growth Outlook
- By Revenues in USD Million
- Market Segmentation & Growth Outlook
- By Reinsurance Type- Market Insights and Forecast 2023-2033, USD Million
- By Line of Business- Market Insights and Forecast 2023-2033, USD Million
- By Distribution Channel- Market Insights and Forecast 2023-2033, USD Million
- By Capital Source- Market Insights and Forecast 2023-2033, USD Million
- Market Size & Growth Outlook
- Market Size & Growth Outlook
- Competitive Outlook
- Company Profiles
- Munich Reinsurance Company
- Business Description
- Product Portfolio
- Collaborations & Alliances
- Recent Developments
- Financial Details
- Others
- Swiss Re Ltd
- Business Description
- Product Portfolio
- Collaborations & Alliances
- Recent Developments
- Financial Details
- Others
- Hannover Rück SE
- Business Description
- Product Portfolio
- Collaborations & Alliances
- Recent Developments
- Financial Details
- Others
- Berkshire Hathaway Inc.
- Business Description
- Product Portfolio
- Collaborations & Alliances
- Recent Developments
- Financial Details
- Others
- SCOR SE
- Business Description
- Product Portfolio
- Collaborations & Alliances
- Recent Developments
- Financial Details
- Others
- Reinsurance Group of America, Incorporated
- Business Description
- Product Portfolio
- Collaborations & Alliances
- Recent Developments
- Financial Details
- Others
- China Reinsurance (Group) Corporation
- Business Description
- Product Portfolio
- Collaborations & Alliances
- Recent Developments
- Financial Details
- Others
- Everest Group, Ltd.
- Business Description
- Product Portfolio
- Collaborations & Alliances
- Recent Developments
- Financial Details
- Others
- RenaissanceRe Holdings Ltd.
- Business Description
- Product Portfolio
- Collaborations & Alliances
- Recent Developments
- Financial Details
- Others
- Arch Capital Group Ltd.
- Business Description
- Product Portfolio
- Collaborations & Alliances
- Recent Developments
- Financial Details
- Others
- Fairfax Financial Holdings Limited
- Business Description
- Product Portfolio
- Collaborations & Alliances
- Recent Developments
- Financial Details
- Others
- MAPFRE RE, COMPAÑÍA DE REASEGUROS, S.A.
- Business Description
- Product Portfolio
- Collaborations & Alliances
- Recent Developments
- Financial Details
- Others
- MS&AD Insurance Group Holdings, Inc.
- Business Description
- Product Portfolio
- Collaborations & Alliances
- Recent Developments
- Financial Details
- Others
- Korean Reinsurance Company
- Business Description
- Product Portfolio
- Collaborations & Alliances
- Recent Developments
- Financial Details
- Others
- Sompo Holdings, Inc. (Sompo)
- Business Description
- Product Portfolio
- Collaborations & Alliances
- Recent Developments
- Financial Details
- Others
- Munich Reinsurance Company
- Company Profiles
- Disclaimer
| Segment | Sub-Segment |
|---|---|
| By Reinsurance Type |
|
| By Line of Business |
|
| By Distribution Channel |
|
| By Capital Source |
|
| By Region |
|
Research Methodology
This study followed a structured approach comprising four key phases to assess the size and scope of the electro-oxidation market. The process began with thorough secondary research to collect data on the target market, related markets, and broader industry context. These findings, along with preliminary assumptions and estimates, were then validated through extensive primary research involving industry experts from across the value chain. To calculate the overall market size, both top-down and bottom-up methodologies were employed. Finally, market segmentation and data triangulation techniques were applied to refine and validate segment-level estimations.
Secondary Research
The secondary research phase involved gathering data from a wide range of credible and published sources. This step helped in identifying industry trends, defining market segmentation, and understanding the market landscape and value chain.
Sources consulted during this phase included:
- Company annual reports, investor presentations, and press releases
- Industry white papers and certified publications
- Trade directories and market-recognized databases
- Articles from authoritative authors and reputable journals
- Gold and silver standard websites
Secondary research was critical in mapping out the industry's value chain and monetary flow, identifying key market segments, understanding regional variations, and tracking significant industry developments.
Other key sources:
- Financial disclosures
- Industry associations and trade bodies
- News outlets and business magazines
- Academic journals and research studies
- Paid industry databases
Primary Research
To validate secondary data and gain deeper market insights, primary research was conducted with key stakeholders across both the supply and demand sides of the market.
On the demand side, participants included decision-makers and influencers from end-user industries—such as CIOs, CTOs, and CSOs—who provided first-hand perspectives on market needs, product usage, and future expectations.
On the supply side, interviews were conducted with manufacturers, industry associations, and institutional participants to gather insights into current offerings, product pipelines, and market challenges.
Primary interviews provided critical inputs such as:
- Market size and revenue data
- Product and service breakdowns
- Market forecasts
- Regional and application-specific trends
Stakeholders consulted included:
- Leading OEM and solution providers
- Channel and distribution partners
- End users across various applications
- Independent consultants and industry specialists
Market Size Estimation and Data Triangulation
- Identifying Key Market Participants (Secondary Research)
- Goal: To identify the major players or companies in the target market. This typically involves using publicly available data sources such as industry reports, market research publications, and financial statements of companies.
- Tools: Reports from firms like Gartner, Forrester, Euromonitor, Statista, IBISWorld, and others. Public financial statements, news articles, and press releases from top market players.
- Extracting Earnings of Key Market Participants
- Goal: To estimate the earnings generated from the product or service being analyzed. This step helps in understanding the revenue potential of each market player in a specific geography.
- Methods: Earnings data can be gathered from:
- Publicly available financial reports (for listed companies).
- Interviews and primary data sources from professionals, such as Directors, VPs, SVPs, etc. This is especially useful for understanding more nuanced, internal data that isn't publicly disclosed.
- Annual reports and investor presentations of key players.
- Data Collation and Development of a Relevant Data Model
- Goal: To collate inputs from both primary and secondary sources into a structured, data-driven model for market estimation. This model will incorporate key market KPIs and any independent variables relevant to the market.
- Key KPIs: These could include:
- Market size, growth rate, and demand drivers.
- Industry-specific metrics like market share, average revenue per customer (ARPC), or average deal size.
- External variables, such as economic growth rates, inflation rates, or commodity prices, that could affect the market.
- Data Modeling: Based on this data, the market forecasts are developed for the next 5 years. A combination of trend analysis, scenario modeling, and statistical regression might be used to generate projections.
- Scenario Analysis
- Goal: To test different assumptions and validate how sensitive the market is to changes in key variables (e.g., market demand, regulatory changes, technological disruptions).
- Types of Scenarios:
- Base Case: Based on current assumptions and historical data.
- Best-Case Scenario: Assuming favorable market conditions, regulatory environments, and technological advancements.
- Worst-Case Scenario: Accounting for adverse factors, such as economic downturns, stricter regulations, or unexpected disruptions.