Global Food Tech Market Report: Trends, Growth and Forecast (2027-2033)
By Component (Hardware, Software, Services), By Application (Food Science & Product Innovation, Kitchen & Restaurant Technology, Food Delivery & Ordering, Supply Chain & Traceability, Others), By Industry (Fish, Meat & Seafood, Fruits & Vegetables, Grains & Oils, Dairy Products, Beverages, Bakery & Confectionery, Other Food Industries), By Region (North America, South America, Europe, Middle East & Africa, Asia Pacific) ... Read more
|
Major Players
|
Food Tech Market Overview
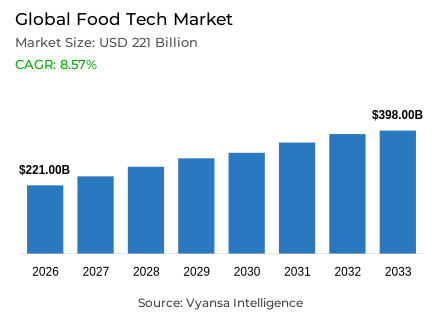
Food technology covers the software, equipment and platforms used to develop food products, run food businesses, manage supply chains and connect buyers with meals and groceries. Its applications range from formulation and restaurant systems to delivery, automation and traceability. The market forecast indicates a CAGR of 8.57% between 2027 and 2033.
Key Highlights of the Food Tech Market
- The market was valued at USD 221 billion in 2026 and is estimated at USD 243 billion in 2027.
- It is forecast to reach USD 398 billion by 2033, at a CAGR of 8.57% during 2027-2033.
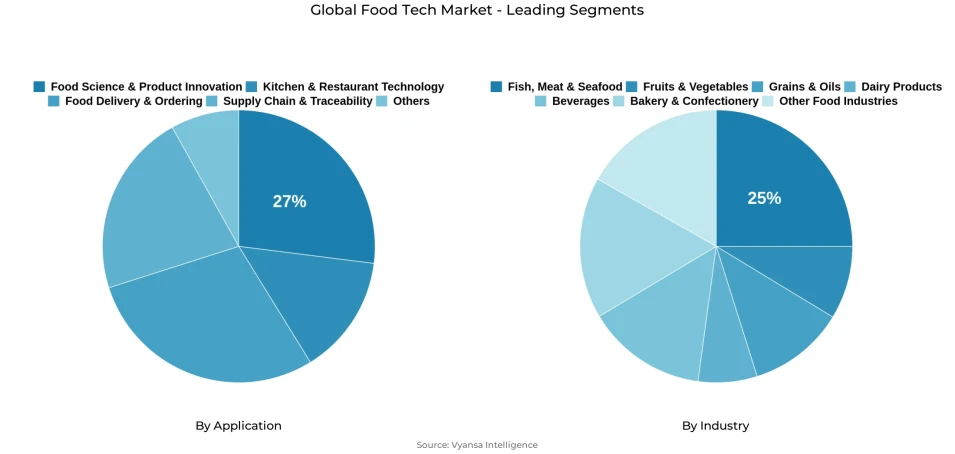
- Food science and product innovation led applications with an estimated 27% share in 2026.
- Supply chain and traceability is the fastest-growing application, with a projected 14.47% during 2027 and 2033.
- Fish, meat and seafood led industry demand with an estimated 25% share in 2026.
- Beverages is the fastest-growing industry segment, with a projected 13.04% CAGR during 2027 and 2033.
- North America accounts for an estimated 35% of Food Tech demand in 2026.
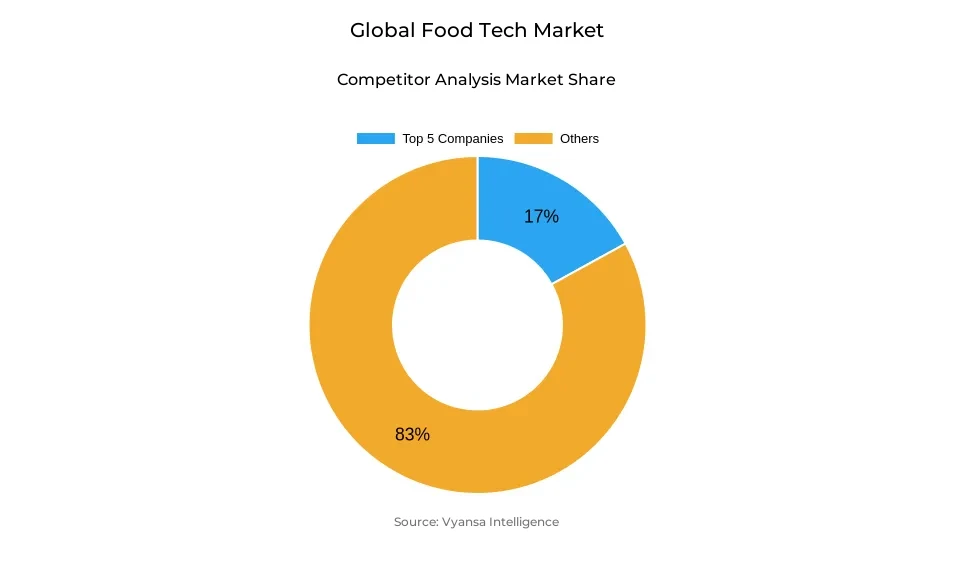
- The market is fragmented and it estimates a combined 17% share for the five leading companies in 2026.
The food technology market is expanding as food production, processing, distribution, and retail increasingly integrate digital solutions with physical operations. According to the International Telecommunication Union, 74% of the global population was online in 2025, reflecting the growing potential for food businesses to connect customer-facing platforms with production and point-of-sale systems. This integration creates opportunities across food processing, foodservice, and grocery retail, although technology requirements vary according to operational scale and business models.
The market's investment structure highlights the continued importance of physical infrastructure alongside digital transformation. Hardware is estimated to account for 44.2% of market spending in 2026, supported by investments in equipment for food preparation, processing, and retail operations. In the United States, robot installations in the food industry increased by 30% in 2025, illustrating the growing adoption of automation in food-related operations. Meanwhile, software is projected to register a CAGR of 13.25%, reflecting increasing demand for solutions that improve operational visibility, streamline workflows, and derive actionable insights from business data.
Asia Pacific is estimated to account for 32.3% of global market demand in 2026, positioning the region as a significant market for food technology providers. Demand patterns are expected to vary across countries, depending on the scale of food production, the maturity of retail infrastructure, and businesses' capacity to invest in technology. Over the forecast period, competitive opportunities are likely to favor providers offering interoperable solutions, demonstrable operational benefits, and flexible deployment models that accommodate businesses with different investment capacities.
Food Tech Market Driver
Multi-Category Delivery Increases the Use of Existing Platforms
A delivery platform already has ordering software, payment systems, merchants and a courier network. Adding groceries and convenience products lets it serve more of a customer’s routine purchases through that infrastructure. For restaurants and retailers, the same network provides access to buyers and delivery capacity without building an independent consumer app and courier operation.
The expansion is visible in operating reach. DoorDash reported that, in the first quarter of 2026, fast third-party convenience delivery was available to more than 60% of the US population. In September 2026, Costco launched on the DoorDash marketplace across its US warehouse network, allowing customers to order groceries and other products for same-day delivery. These developments extend an established meal-delivery network into additional food and retail purchases.
The growth effect depends on customers placing repeat orders and merchants finding the service worthwhile after fees and fulfillment costs. Platforms that meet those conditions can increase use of their existing technology across several purchasing occasions, supporting demand for ordering, merchant and logistics systems through the forecast period.
Food Tech Market Challenge
Delivery Labor Standards Increase Fulfillment Costs
Food-delivery platforms need enough couriers to meet demand when and where orders arrive. Minimum pay requirements change the cost of maintaining that capacity, particularly in areas where couriers spend more time waiting or traveling between orders. Platforms may have to adjust delivery fees, service areas or merchant terms to keep lower-density routes commercially viable.
Australia introduced minimum standards for eligible on-demand delivery workers on 17 August 2026, including a minimum hourly pay rate. The change directly affects the cost of fulfilling food and grocery orders for covered platforms. In a separate pay-practices case, the New York Attorney General secured a USD 16.75 million settlement with DoorDash in February 2025 over its treatment of customer tips. The cases involve different obligations, but both show why worker-payment systems require operational attention.
The effect will differ by jurisdiction and order density. Platforms with frequent orders across compact service areas have more scope to spread fulfillment costs across deliveries. Where orders are sparse, higher labor costs may limit coverage or raise the price customers pay, moderating growth in delivery-led food technology.
Food Tech Market Trends
Conversational AI Enters Food Discovery and Ordering
Ordering food digitally still involves searching, comparing options and assembling a cart. Conversational tools can reduce those steps by interpreting a request, recipe or shopping list and presenting relevant products. Their value to food businesses lies in helping customers reach a suitable order while keeping menus, availability and prices accurate.
DoorDash introduced Ask DoorDash in June 2026, enabling customers in selected areas to build a grocery cart from a recipe link, cookbook image or photographed list, as well as search for restaurant meals in their own words. In July, Square launched ChatGPT and Claude integrations through which eligible US food and beverage sellers could be discovered and receive orders using their existing Square setup. These are deployed capabilities, although neither announcement establishes an industry-wide change in ordering behavior.
Adoption will depend on whether recommendations are accurate and customers find the process easier than conventional search. Providers that connect AI discovery to dependable inventory and checkout may gain more orders, creating demand for integrated menus, catalog data and payment systems.
Food Tech Market Opportunity
Supplier Traceability Gaps Create Demand for Shared Data Tools
Tracing a food shipment requires usable records from several businesses, including producers, processors and distributors. A supplier may record its own activities but still struggle to connect those records with information received from trading partners. Shared tools that capture lot information and exchange it across businesses can reduce repeated manual work and improve the speed of tracing affected products.
The US food traceability rule creates a defined reason for covered businesses supplying the US market to prepare these records. Congress has directed the Food and Drug Administration not to enforce the rule before 20 July 2028. The agency has also identified coordination between supply-chain partners as an important readiness issue. GS1-based methods may help businesses exchange data, but the FDA does not require a particular technology or data standard for compliance.
Providers have an opportunity to offer affordable onboarding and record-sharing tools to smaller suppliers and their larger customers. Demand will be strongest where a platform makes information easier to gather and retrieve during normal operations, as well as supporting preparation for the rule.
Unlock Market Intelligence
Explore the market potential with our data-driven report
Food Tech Market Segmentation Analysis
By Application
- Food Science and Product Innovation
- Kitchen and Restaurant Technology
- Food Delivery and Ordering
- Supply Chain and Traceability
- Other Applications
Food Science Leads Application Spending as Traceability Accelerates
Food Science and Product Innovation accounted for an estimated 27% of application spending in 2026. The segment includes formulation tools, food biotechnology and technology used to develop or test new products. Its breadth supports demand from manufacturers pursuing different ingredients, processing methods and product characteristics. In April 2026, AuX Labs announced progress toward commercializing its precision-fermentation platform for cheese ingredients, illustrating investment in food development beyond conventional formulation.
Supply Chain and Traceability is projected to grow fastest, at a 14.47% CAGR during 2027-2033. Suppliers increasingly need records that can follow food across separate businesses, particularly for perishable products. In March 2026, Fujitsu and Umios reported completing a pilot system for tracing seafood distribution and said they aimed to begin using it for selected species in fiscal 2027. The pilot demonstrates the application directly; its broader rollout remains planned.
By Industry
- Fish, Meat and Seafood
- Fruits and Vegetables
- Grains and Oils
- Dairy Products
- Beverages
- Bakery and Confectionery
- Other Food Industries
Perishable Proteins Lead Industry Demand While Beverages Grow Faster
Fish, Meat and Seafood accounted for an estimated 25% of industry demand in 2026. These products require careful handling across processing, storage and transport, making monitoring and traceability commercially important. India’s 2025 national framework for fisheries and aquaculture traceability, followed by a July 2026 government update on its implementation plans, illustrates the demand for digital records across a seafood supply chain. The development concerns technology used for seafood, rather than a new food product.
Beverages is projected to grow fastest, at a 13.04% CAGR during 2027-2033. Producers can use automation to manage high-volume processing, filling and quality checks. In April 2026, Hindustan Coca-Cola Beverages commissioned a highly automated Kinley water production line in India. That investment provides a direct example of beverage manufacturing technology adoption, rather than treating a beverage launch itself as evidence of technology spending.
Unlock Market Intelligence
Explore the market potential with our data-driven report
Food Tech Market Regional Analysis
North America Leads Demand and Asia Pacific Records the Fastest Growth
North America accounted for an estimated 35% of the global food tech market in 2026. The region combines a large food-processing industry with established restaurant networks, online grocery services and widespread access to digital payment and operational systems. In 2026, 60% of US restaurant operators described their businesses as being within the technology mainstream, while almost three in ten remained behind it. This combination of existing adoption and further upgrade potential supports continuing demand for ordering, payment, kitchen-management and back-office technologies across the region.
Asia Pacific is projected to record the fastest growth in the global food tech market, at approximately 10.5% during 2027–2033. Expanding food-processing capacity, urban foodservice networks and organized retail are increasing the number of businesses that must coordinate production, inventory and fulfilment at scale. The region also contains markets at different stages of technology adoption, giving suppliers opportunities to serve both large operators seeking integrated systems and smaller businesses adopting individual digital tools. These conditions should allow Asia Pacific to gain market share through the forecast period.

Food Tech Market Competitive Landscape
The supplied market is fragmented and estimates a combined 17% share for its leading companies in 2026. Meituan, Uber, Delivery Hero, DoorDash and HelloFresh compete through different activities, from delivery marketplaces to digitally managed meal preparation and distribution.
Key Companies in the Food Tech Market
- Beijing Sankuai Online Technology Co., Ltd.
- Uber Technologies, Inc.
- Delivery Hero SE
- DoorDash, Inc.
- HelloFresh SE
- Toast, Inc.
- Eternal Limited
- Domino’s Pizza, Inc.
- Maplebear Inc.
- Swiggy Limited
- iFood.com Agência de Restaurantes Online S.A.
- Ocado Group plc
- Grab Holdings Limited
- Lightspeed Commerce Inc.
- Beyond Meat, Inc.
Company Profiling
Beijing Sankuai Online Technology Co., Ltd.: Meituan connects consumers and merchants through food delivery and other local-commerce services in China, while its Keeta brand operates in international delivery markets. Its technology position rests on matching orders, merchants and couriers across a large operating network. In its August 2026 business update, the company described continued work to integrate AI into consumer and merchant services, extending its platform tools beyond basic order placement.
Uber Technologies, Inc.: Uber Eats connects restaurants, grocery merchants, couriers and customers through Uber’s delivery platform. Its wider consumer app and logistics systems support purchases across multiple categories. In July 2026, Uber completed the acquisition of Getir’s food-delivery business in Türkiye; later that month, it announced a proposed takeover of Delivery Hero. The Delivery Hero transaction remained a proposal subject to the takeover process.
Delivery Hero SE: Delivery Hero operates food-delivery and local-commerce brands across multiple countries, using shared platform capabilities to support consumers and merchants. Its business remains distinct from Uber’s while the proposed takeover is pending. In August 2026, Delivery Hero introduced an AI assistant intended to help local shops and restaurants manage and grow their businesses through its platform.
DoorDash, Inc.: DoorDash provides marketplace technology for restaurant, grocery and retail ordering and delivery. Its expanding merchant tools also give brands ways to manage how products appear across the platform. In September 2026, DoorDash introduced Brand Center, which brings catalog management, advertising and retailer insights together for participating brands. The launch extends its technology offering beyond the delivery transaction itself.
HelloFresh SE: HelloFresh uses digital ordering, planning and fulfillment to sell meal kits and ready-to-eat food directly to consumers. Its position differs from a restaurant marketplace because it manages the food offering and delivery process around its own brands. In September 2026, its Factor brand expanded prepared meals into more than 800 Target stores across 47 US states, adding a national retail route alongside its direct customer channels.
Recent Developments in the Food Tech Market
- April 2026: Toast launched a drive-through system combining point-of-sale software, kitchen systems, hardware and AI voice-ordering integration. It targeted eligible restaurant chains; the approximately 140,000 US drive-through locations cited in the announcement described the wider industry, not Toast deployments.
Frequently Asked Questions
Related Report
- Market Segmentation
- Research Scope
- Research Methodology
- Definitions and Assumptions
- Executive Summary
- Food Tech Market Policies, Regulations, and Standards
- Food Tech Market Dynamics
- Growth Factors
- Challenges
- Trends
- Opportunities
- Food Tech Market Statistics, 2023-2033F
- Market Size & Growth Outlook
- By Revenues in USD Million
- Market Segmentation & Growth Outlook
- By Component
- Hardware- Market Insights and Forecast 2023-2033, USD Million
- Software- Market Insights and Forecast 2023-2033, USD Million
- Services- Market Insights and Forecast 2023-2033, USD Million
- By Application
- Food Science & Product Innovation- Market Insights and Forecast 2023-2033, USD Million
- Kitchen & Restaurant Technology- Market Insights and Forecast 2023-2033, USD Million
- Food Delivery & Ordering- Market Insights and Forecast 2023-2033, USD Million
- Supply Chain & Traceability- Market Insights and Forecast 2023-2033, USD Million
- Others- Market Insights and Forecast 2023-2033, USD Million
- By Industry
- Fish, Meat & Seafood- Market Insights and Forecast 2023-2033, USD Million
- Fruits & Vegetables- Market Insights and Forecast 2023-2033, USD Million
- Grains & Oils- Market Insights and Forecast 2023-2033, USD Million
- Dairy Products- Market Insights and Forecast 2023-2033, USD Million
- Beverages- Market Insights and Forecast 2023-2033, USD Million
- Bakery & Confectionery- Market Insights and Forecast 2023-2033, USD Million
- Other Food Industries- Market Insights and Forecast 2023-2033, USD Million
- By Region
- North America
- South America
- Europe
- Middle East & Africa
- Asia Pacific
- By Competitors
- Competition Characteristics
- Market Share & Analysis
- By Component
- Market Size & Growth Outlook
- North America Food Tech Market Statistics, 2023-2033F
- Market Size & Growth Outlook
- By Revenues in USD Million
- Market Segmentation & Growth Outlook
- By Component- Market Insights and Forecast 2023-2033, USD Million
- By Application- Market Insights and Forecast 2023-2033, USD Million
- By Industry- Market Insights and Forecast 2023-2033, USD Million
- By Country
- The US
- Canada
- Mexico
- The US Food Tech Market Statistics, 2023-2033F
- Market Size & Growth Outlook
- By Revenues in USD Million
- Market Segmentation & Growth Outlook
- By Component- Market Insights and Forecast 2023-2033, USD Million
- By Application- Market Insights and Forecast 2023-2033, USD Million
- By Industry- Market Insights and Forecast 2023-2033, USD Million
- Market Size & Growth Outlook
- Canada Food Tech Market Statistics, 2023-2033F
- Market Size & Growth Outlook
- By Revenues in USD Million
- Market Segmentation & Growth Outlook
- By Component- Market Insights and Forecast 2023-2033, USD Million
- By Application- Market Insights and Forecast 2023-2033, USD Million
- By Industry- Market Insights and Forecast 2023-2033, USD Million
- Market Size & Growth Outlook
- Mexico Food Tech Market Statistics, 2023-2033F
- Market Size & Growth Outlook
- By Revenues in USD Million
- Market Segmentation & Growth Outlook
- By Component- Market Insights and Forecast 2023-2033, USD Million
- By Application- Market Insights and Forecast 2023-2033, USD Million
- By Industry- Market Insights and Forecast 2023-2033, USD Million
- Market Size & Growth Outlook
- Market Size & Growth Outlook
- South America Food Tech Market Statistics, 2023-2033F
- Market Size & Growth Outlook
- By Revenues in USD Million
- Market Segmentation & Growth Outlook
- By Component- Market Insights and Forecast 2023-2033, USD Million
- By Application- Market Insights and Forecast 2023-2033, USD Million
- By Industry- Market Insights and Forecast 2023-2033, USD Million
- By Country
- Brazil
- Argentina
- Chile
- Rest of South America
- Brazil Food Tech Market Statistics, 2023-2033F
- Market Size & Growth Outlook
- By Revenues in USD Million
- Market Segmentation & Growth Outlook
- By Component- Market Insights and Forecast 2023-2033, USD Million
- By Application- Market Insights and Forecast 2023-2033, USD Million
- By Industry- Market Insights and Forecast 2023-2033, USD Million
- Market Size & Growth Outlook
- Argentina Food Tech Market Statistics, 2023-2033F
- Market Size & Growth Outlook
- By Revenues in USD Million
- Market Segmentation & Growth Outlook
- By Component- Market Insights and Forecast 2023-2033, USD Million
- By Application- Market Insights and Forecast 2023-2033, USD Million
- By Industry- Market Insights and Forecast 2023-2033, USD Million
- Market Size & Growth Outlook
- Chile Food Tech Market Statistics, 2023-2033F
- Market Size & Growth Outlook
- By Revenues in USD Million
- Market Segmentation & Growth Outlook
- By Component- Market Insights and Forecast 2023-2033, USD Million
- By Application- Market Insights and Forecast 2023-2033, USD Million
- By Industry- Market Insights and Forecast 2023-2033, USD Million
- Market Size & Growth Outlook
- Market Size & Growth Outlook
- Europe Food Tech Market Statistics, 2023-2033F
- Market Size & Growth Outlook
- By Revenues in USD Million
- Market Segmentation & Growth Outlook
- By Component- Market Insights and Forecast 2023-2033, USD Million
- By Application- Market Insights and Forecast 2023-2033, USD Million
- By Industry- Market Insights and Forecast 2023-2033, USD Million
- By Country
- Germany
- The UK
- France
- Italy
- Spain
- BENELUX
- Nordics
- Rest of Europe
- Germany Food Tech Market Statistics, 2023-2033F
- Market Size & Growth Outlook
- By Revenues in USD Million
- Market Segmentation & Growth Outlook
- By Component- Market Insights and Forecast 2023-2033, USD Million
- By Application- Market Insights and Forecast 2023-2033, USD Million
- By Industry- Market Insights and Forecast 2023-2033, USD Million
- Market Size & Growth Outlook
- The UK Food Tech Market Statistics, 2023-2033F
- Market Size & Growth Outlook
- By Revenues in USD Million
- Market Segmentation & Growth Outlook
- By Component- Market Insights and Forecast 2023-2033, USD Million
- By Application- Market Insights and Forecast 2023-2033, USD Million
- By Industry- Market Insights and Forecast 2023-2033, USD Million
- Market Size & Growth Outlook
- France Food Tech Market Statistics, 2023-2033F
- Market Size & Growth Outlook
- By Revenues in USD Million
- Market Segmentation & Growth Outlook
- By Component- Market Insights and Forecast 2023-2033, USD Million
- By Application- Market Insights and Forecast 2023-2033, USD Million
- By Industry- Market Insights and Forecast 2023-2033, USD Million
- Market Size & Growth Outlook
- Italy Food Tech Market Statistics, 2023-2033F
- Market Size & Growth Outlook
- By Revenues in USD Million
- Market Segmentation & Growth Outlook
- By Component- Market Insights and Forecast 2023-2033, USD Million
- By Application- Market Insights and Forecast 2023-2033, USD Million
- By Industry- Market Insights and Forecast 2023-2033, USD Million
- Market Size & Growth Outlook
- Spain Food Tech Market Statistics, 2023-2033F
- Market Size & Growth Outlook
- By Revenues in USD Million
- Market Segmentation & Growth Outlook
- By Component- Market Insights and Forecast 2023-2033, USD Million
- By Application- Market Insights and Forecast 2023-2033, USD Million
- By Industry- Market Insights and Forecast 2023-2033, USD Million
- Market Size & Growth Outlook
- BENELUX Food Tech Market Statistics, 2023-2033F
- Market Size & Growth Outlook
- By Revenues in USD Million
- Market Segmentation & Growth Outlook
- By Component- Market Insights and Forecast 2023-2033, USD Million
- By Application- Market Insights and Forecast 2023-2033, USD Million
- By Industry- Market Insights and Forecast 2023-2033, USD Million
- Market Size & Growth Outlook
- Nordics Food Tech Market Statistics, 2023-2033F
- Market Size & Growth Outlook
- By Revenues in USD Million
- Market Segmentation & Growth Outlook
- By Component- Market Insights and Forecast 2023-2033, USD Million
- By Application- Market Insights and Forecast 2023-2033, USD Million
- By Industry- Market Insights and Forecast 2023-2033, USD Million
- Market Size & Growth Outlook
- Market Size & Growth Outlook
- Middle East & Africa Food Tech Market Statistics, 2023-2033F
- Market Size & Growth Outlook
- By Revenues in USD Million
- Market Segmentation & Growth Outlook
- By Component- Market Insights and Forecast 2023-2033, USD Million
- By Application- Market Insights and Forecast 2023-2033, USD Million
- By Industry- Market Insights and Forecast 2023-2033, USD Million
- By Country
- UAE
- Saudi Arabia
- South Africa
- Turkey
- Rest of Middle East & Africa
- UAE Food Tech Market Statistics, 2023-2033F
- Market Size & Growth Outlook
- By Revenues in USD Million
- Market Segmentation & Growth Outlook
- By Component- Market Insights and Forecast 2023-2033, USD Million
- By Application- Market Insights and Forecast 2023-2033, USD Million
- By Industry- Market Insights and Forecast 2023-2033, USD Million
- Market Size & Growth Outlook
- Saudi Arabia Food Tech Market Statistics, 2023-2033F
- Market Size & Growth Outlook
- By Revenues in USD Million
- Market Segmentation & Growth Outlook
- By Component- Market Insights and Forecast 2023-2033, USD Million
- By Application- Market Insights and Forecast 2023-2033, USD Million
- By Industry- Market Insights and Forecast 2023-2033, USD Million
- Market Size & Growth Outlook
- South Africa Food Tech Market Statistics, 2023-2033F
- Market Size & Growth Outlook
- By Revenues in USD Million
- Market Segmentation & Growth Outlook
- By Component- Market Insights and Forecast 2023-2033, USD Million
- By Application- Market Insights and Forecast 2023-2033, USD Million
- By Industry- Market Insights and Forecast 2023-2033, USD Million
- Market Size & Growth Outlook
- Turkey Food Tech Market Statistics, 2023-2033F
- Market Size & Growth Outlook
- By Revenues in USD Million
- Market Segmentation & Growth Outlook
- By Component- Market Insights and Forecast 2023-2033, USD Million
- By Application- Market Insights and Forecast 2023-2033, USD Million
- By Industry- Market Insights and Forecast 2023-2033, USD Million
- Market Size & Growth Outlook
- Market Size & Growth Outlook
- Asia Pacific Food Tech Market Statistics, 2023-2033F
- Market Size & Growth Outlook
- By Revenues in USD Million
- Market Segmentation & Growth Outlook
- By Component- Market Insights and Forecast 2023-2033, USD Million
- By Application- Market Insights and Forecast 2023-2033, USD Million
- By Industry- Market Insights and Forecast 2023-2033, USD Million
- By Country
- China
- India
- Japan
- South Korea
- Australia
- Southeast Asia
- Rest of Asia Pacific
- China Food Tech Market Statistics, 2023-2033F
- Market Size & Growth Outlook
- By Revenues in USD Million
- Market Segmentation & Growth Outlook
- By Component- Market Insights and Forecast 2023-2033, USD Million
- By Application- Market Insights and Forecast 2023-2033, USD Million
- By Industry- Market Insights and Forecast 2023-2033, USD Million
- Market Size & Growth Outlook
- India Food Tech Market Statistics, 2023-2033F
- Market Size & Growth Outlook
- By Revenues in USD Million
- Market Segmentation & Growth Outlook
- By Component- Market Insights and Forecast 2023-2033, USD Million
- By Application- Market Insights and Forecast 2023-2033, USD Million
- By Industry- Market Insights and Forecast 2023-2033, USD Million
- Market Size & Growth Outlook
- Japan Food Tech Market Statistics, 2023-2033F
- Market Size & Growth Outlook
- By Revenues in USD Million
- Market Segmentation & Growth Outlook
- By Component- Market Insights and Forecast 2023-2033, USD Million
- By Application- Market Insights and Forecast 2023-2033, USD Million
- By Industry- Market Insights and Forecast 2023-2033, USD Million
- Market Size & Growth Outlook
- South Korea Food Tech Market Statistics, 2023-2033F
- Market Size & Growth Outlook
- By Revenues in USD Million
- Market Segmentation & Growth Outlook
- By Component- Market Insights and Forecast 2023-2033, USD Million
- By Application- Market Insights and Forecast 2023-2033, USD Million
- By Industry- Market Insights and Forecast 2023-2033, USD Million
- Market Size & Growth Outlook
- Australia Food Tech Market Statistics, 2023-2033F
- Market Size & Growth Outlook
- By Revenues in USD Million
- Market Segmentation & Growth Outlook
- By Component- Market Insights and Forecast 2023-2033, USD Million
- By Application- Market Insights and Forecast 2023-2033, USD Million
- By Industry- Market Insights and Forecast 2023-2033, USD Million
- Market Size & Growth Outlook
- Southeast Asia Food Tech Market Statistics, 2023-2033F
- Market Size & Growth Outlook
- By Revenues in USD Million
- Market Segmentation & Growth Outlook
- By Component- Market Insights and Forecast 2023-2033, USD Million
- By Application- Market Insights and Forecast 2023-2033, USD Million
- By Industry- Market Insights and Forecast 2023-2033, USD Million
- Market Size & Growth Outlook
- Market Size & Growth Outlook
- Competitive Outlook
- Company Profiles
- Beijing Sankuai Online Technology Co., Ltd. (Meituan Waimai)
- Business Description
- Product Portfolio
- Collaborations & Alliances
- Recent Developments
- Financial Details
- Others
- Uber Technologies, Inc. (Uber Eats)
- Business Description
- Product Portfolio
- Collaborations & Alliances
- Recent Developments
- Financial Details
- Others
- Delivery Hero SE
- Business Description
- Product Portfolio
- Collaborations & Alliances
- Recent Developments
- Financial Details
- Others
- DoorDash, Inc.
- Business Description
- Product Portfolio
- Collaborations & Alliances
- Recent Developments
- Financial Details
- Others
- HelloFresh SE
- Business Description
- Product Portfolio
- Collaborations & Alliances
- Recent Developments
- Financial Details
- Others
- Toast, Inc.
- Business Description
- Product Portfolio
- Collaborations & Alliances
- Recent Developments
- Financial Details
- Others
- Eternal Limited (Zomato)
- Business Description
- Product Portfolio
- Collaborations & Alliances
- Recent Developments
- Financial Details
- Others
- Domino's Pizza, Inc.
- Business Description
- Product Portfolio
- Collaborations & Alliances
- Recent Developments
- Financial Details
- Others
- Maplebear Inc. (Instacart)
- Business Description
- Product Portfolio
- Collaborations & Alliances
- Recent Developments
- Financial Details
- Others
- Swiggy Limited
- Business Description
- Product Portfolio
- Collaborations & Alliances
- Recent Developments
- Financial Details
- Others
- iFood.com Agência de Restaurantes Online S.A. (iFood)
- Business Description
- Product Portfolio
- Collaborations & Alliances
- Recent Developments
- Financial Details
- Others
- Ocado Group plc
- Business Description
- Product Portfolio
- Collaborations & Alliances
- Recent Developments
- Financial Details
- Others
- Grab Holdings Limited (Grab)
- Business Description
- Product Portfolio
- Collaborations & Alliances
- Recent Developments
- Financial Details
- Others
- Lightspeed Commerce Inc.
- Business Description
- Product Portfolio
- Collaborations & Alliances
- Recent Developments
- Financial Details
- Others
- Beyond Meat, Inc.
- Business Description
- Product Portfolio
- Collaborations & Alliances
- Recent Developments
- Financial Details
- Others
- Beijing Sankuai Online Technology Co., Ltd. (Meituan Waimai)
- Company Profiles
- Disclaimer
| Segment | Sub-Segment |
|---|---|
| By Component |
|
| By Application |
|
| By Industry |
|
| By Region |
|
Research Methodology
This study followed a structured approach comprising four key phases to assess the size and scope of the electro-oxidation market. The process began with thorough secondary research to collect data on the target market, related markets, and broader industry context. These findings, along with preliminary assumptions and estimates, were then validated through extensive primary research involving industry experts from across the value chain. To calculate the overall market size, both top-down and bottom-up methodologies were employed. Finally, market segmentation and data triangulation techniques were applied to refine and validate segment-level estimations.
Secondary Research
The secondary research phase involved gathering data from a wide range of credible and published sources. This step helped in identifying industry trends, defining market segmentation, and understanding the market landscape and value chain.
Sources consulted during this phase included:
- Company annual reports, investor presentations, and press releases
- Industry white papers and certified publications
- Trade directories and market-recognized databases
- Articles from authoritative authors and reputable journals
- Gold and silver standard websites
Secondary research was critical in mapping out the industry's value chain and monetary flow, identifying key market segments, understanding regional variations, and tracking significant industry developments.
Other key sources:
- Financial disclosures
- Industry associations and trade bodies
- News outlets and business magazines
- Academic journals and research studies
- Paid industry databases
Primary Research
To validate secondary data and gain deeper market insights, primary research was conducted with key stakeholders across both the supply and demand sides of the market.
On the demand side, participants included decision-makers and influencers from end-user industries—such as CIOs, CTOs, and CSOs—who provided first-hand perspectives on market needs, product usage, and future expectations.
On the supply side, interviews were conducted with manufacturers, industry associations, and institutional participants to gather insights into current offerings, product pipelines, and market challenges.
Primary interviews provided critical inputs such as:
- Market size and revenue data
- Product and service breakdowns
- Market forecasts
- Regional and application-specific trends
Stakeholders consulted included:
- Leading OEM and solution providers
- Channel and distribution partners
- End users across various applications
- Independent consultants and industry specialists
Market Size Estimation and Data Triangulation
- Identifying Key Market Participants (Secondary Research)
- Goal: To identify the major players or companies in the target market. This typically involves using publicly available data sources such as industry reports, market research publications, and financial statements of companies.
- Tools: Reports from firms like Gartner, Forrester, Euromonitor, Statista, IBISWorld, and others. Public financial statements, news articles, and press releases from top market players.
- Extracting Earnings of Key Market Participants
- Goal: To estimate the earnings generated from the product or service being analyzed. This step helps in understanding the revenue potential of each market player in a specific geography.
- Methods: Earnings data can be gathered from:
- Publicly available financial reports (for listed companies).
- Interviews and primary data sources from professionals, such as Directors, VPs, SVPs, etc. This is especially useful for understanding more nuanced, internal data that isn't publicly disclosed.
- Annual reports and investor presentations of key players.
- Data Collation and Development of a Relevant Data Model
- Goal: To collate inputs from both primary and secondary sources into a structured, data-driven model for market estimation. This model will incorporate key market KPIs and any independent variables relevant to the market.
- Key KPIs: These could include:
- Market size, growth rate, and demand drivers.
- Industry-specific metrics like market share, average revenue per customer (ARPC), or average deal size.
- External variables, such as economic growth rates, inflation rates, or commodity prices, that could affect the market.
- Data Modeling: Based on this data, the market forecasts are developed for the next 5 years. A combination of trend analysis, scenario modeling, and statistical regression might be used to generate projections.
- Scenario Analysis
- Goal: To test different assumptions and validate how sensitive the market is to changes in key variables (e.g., market demand, regulatory changes, technological disruptions).
- Types of Scenarios:
- Base Case: Based on current assumptions and historical data.
- Best-Case Scenario: Assuming favorable market conditions, regulatory environments, and technological advancements.
- Worst-Case Scenario: Accounting for adverse factors, such as economic downturns, stricter regulations, or unexpected disruptions.