China Proptech Market Report: Trends, Growth and Forecast (2027-2033)
By Property Type (Residential, Commercial, Industrial & Logistics, Hospitality), By Solution (Software, Services), By Deployment (Cloud, On-Premise), By End User (Property Owners & Developers, Real Estate Agents & Brokerages, Facility & Property Managers, Property Investors & REITs), By Technology (IoT & Smart Sensor Networks, AI & Big Data Analytics, AR, VR & Digital Twins, Blockchain & Distributed Ledger Technology) ... Read more
|
Major Players
|
China Proptech Market Overview
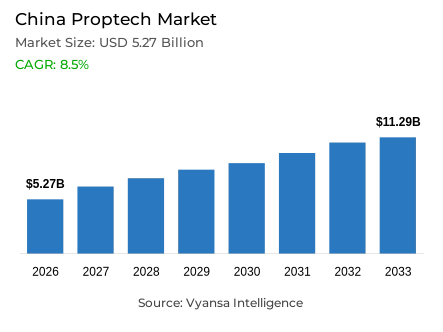
Proptech in China is a set of digital platforms that run listings, transactions, rentals and building operations instead of paper contracts and offline agent networks. Agents, property managers, landlords and real estate investment trust (REIT) investors use it for verified listings, settlement, resident service and asset reporting. The China proptech market is forecast to grow at a compound annual growth rate (CAGR) of 8.5% between 2027 and 2033.
Key Highlights of the China Proptech Market
- The China proptech market was valued at USD 5.27 billion in 2026 and is estimated at USD 6.92 billion in 2027 and is forecast to reach USD 11.29 billion by 2033.
- The market is forecast to expand at a CAGR of 8.5% between 2027 and 2033.
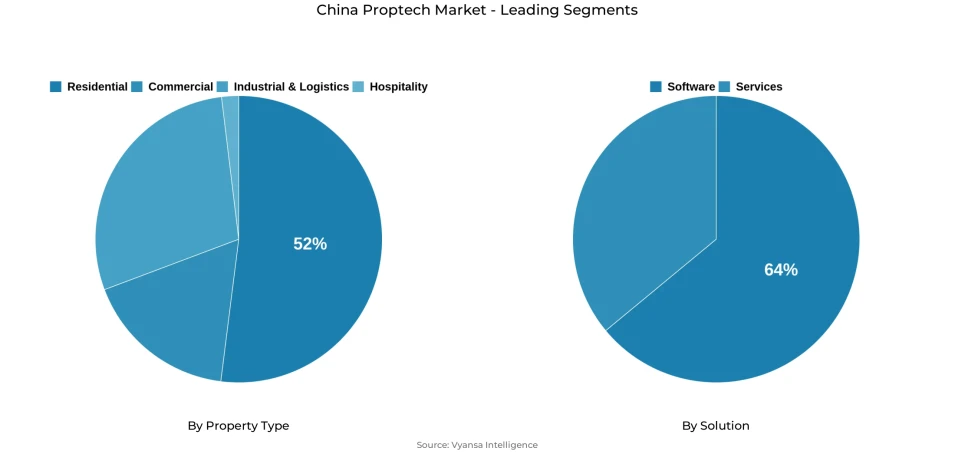
- By property type, Residential led the market with a 52% share in 2026.
- Commercial is the fastest-growing property type, expanding at a CAGR of 19.90% between 2027 and 2033.
- By solution, Software led the market with a 64% share in 2026.
- Services is the fastest-growing solution type, expanding at a CAGR of 18.50% between 2027 and 2033.
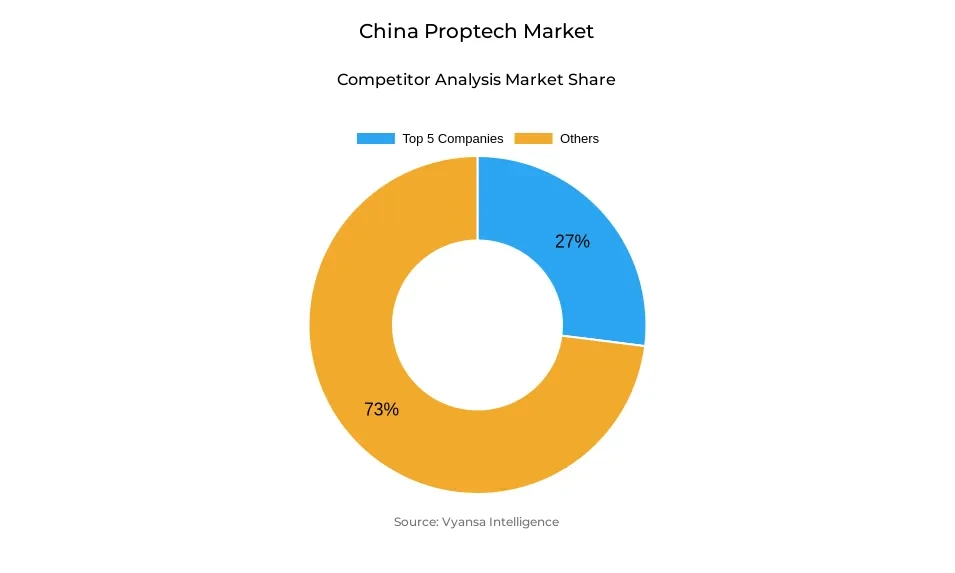
- The market is consolidated, with the top five companies holding a combined 27% share in 2026.
China's proptech market is increasingly shaped by transactions involving existing homes. Second-hand properties accounted for 52% of housing transactions in January–August 2026, up from 46% in 2025, while the floor area of online-registered resale transactions grew 10.6% year on year. As more homes change hands, brokerages need dependable listings, coordinated agent workflows and digital support for viewings and transfers. This creates recurring demand for platforms that can manage the steps between a property entering the market and a completed sale.
Demand continues after a transaction. By October 2025, more than 7.5 million previously delayed homes had been delivered, while renovation reached 27,100 older residential communities in 2025, benefiting 4.99 million households. These homes need rental administration, resident communication and maintenance over many years. Onewo's owner-service assistant was deployed across 4,140 projects by mid-2026, illustrating how property operators are using technology to handle that continuing workload. For proptech suppliers, the opportunity grows with the number of occupied properties brought into organised, digitally supported management.
Commercial assets add a further source of demand. Four commercial real estate REITs listed in June 2026, while 21 projects had been accepted across the REIT market, creating a growing need for reliable lease, occupancy and asset-performance records. Development investment fell 19.9% and new construction starts fell 24.8% in January–August 2026, constraining sales of software tied to new projects. Over the forecast period, growth should increasingly come from platforms that help transact existing homes and operate occupied residential and commercial assets more efficiently.
China Proptech Market Government Compliance
China’s housing rental regulations took effect on 15 September 2025. Rental brokerages must verify and record the parties commissioning them, inspect properties before listing and disclose service prices. These steps create a direct need for platforms that record who authorized a listing, retain inspection details and show the fees presented to renters. Shared workflows become particularly useful for brokerages managing listings across multiple agents or branches.
The regulation on network data security management took effect on 1 January 2025. It sets requirements for handling personal information and important data, including obligations for internet platform providers. Proptech platforms hold identity, ownership and resident information, so their customers need systems that can control access to those records and manage them securely. Data protection is therefore part of the purchasing decision for listing and property management software.
A further reform took effect in late May 2026 for companies purchasing property. It promotes online processing and information sharing across transfer registration, tax and mortgage procedures, including the use of electronic contracts and documents. This creates an opening for platforms serving enterprise property transactions to prepare records and coordinate the steps required for digital registration. Its scope is enterprise purchases, so it should not be presented as a reform of every household resale transaction.
China Proptech Market Drivers
Rising Existing-Home Sales Drive Demand for Property Platforms
The growing number of existing-home sales is increasing demand for proptech across the full transaction process. A resale property needs its listing checked, viewings arranged, buyers matched with agents, and ownership and financing details coordinated before completion. Brokers handling many properties need shared systems to keep this information current and move transactions between staff without repeating work. As resale activity expands, these tools become part of routine brokerage operations.
The shift extends beyond a few major cities. By October 2025, second-hand home transactions exceeded new-home sales in 15 provincial-level regions. Data from the China index academy show that the number of existing-home transactions across 20 tracked cities rose 6.1% in the first seven months of 2026. The geographic spread and continued growth give platforms a larger flow of properties and customers to serve, strengthening demand for accurate listings, agent coordination and transaction-management tools.
Consumers also need confidence in the information and process behind a resale listing. Property condition, ownership records and transaction timing vary from home to home, making errors costly for brokers and customers alike. Platforms that help agents verify information, manage enquiries and track progress through completion can improve service while allowing brokerages to handle a larger workload. This should support sustained spending on transaction technology as existing homes take a larger role in China's housing market.
China Proptech Market Challenges
Weak Developer Funding Limits Software Spending
Developers remain buyers of sales, marketing and project management software, but their ability to commit to new technology is constrained. Funds available to real estate development enterprises fell 21.0% year on year in January–August 2026. Over the same period, the floor area of newly built commercial buildings sold declined 12.1%. Lower funding and weaker sales give developers reason to delay purchases or limit software use to essential projects.
This affects suppliers whose products depend on a steady flow of launches. Fewer active sales projects mean fewer opportunities to deploy listing, marketing and customer management systems. Even where a developer continues to buy, it may favor tools that help existing teams complete sales or manage available properties over a broad new installation.
Moving toward occupied buildings offers another customer base, but it takes product changes. Rental operators and property managers work with tenants, service requests and maintenance records rather than launch schedules and buyer leads. Suppliers need to show that their systems improve these daily tasks enough to justify spending. Developer funding pressure is therefore likely to remain a challenge for project-focused products while vendors adapt to customers managing existing assets.
China Proptech Market Recent Trends
Rental Platforms Are Expanding Ongoing Services
Demand for rental platforms increasingly extends beyond finding a tenant. Once a home is occupied, landlords and renters still need help with repairs, cleaning, payments and tenancy questions. Platforms that manage these tasks can remain useful throughout the tenancy, creating a stronger reason for owners and operators to keep using them.
A 2026 study jointly prepared by Ziroom research institute and Xinhua found that around 80% of surveyed renters were open to renting for five years or longer. It also found thatnearly 60% of surveyed landlords preferred using a professional rental operator. These are survey preferences, not completed tenancy or management contracts, but they indicate demand on both sides for sustained rental services.
Longer relationships make service quality more consequential. Operators need to keep property records current, respond to residents and coordinate work across homes even when no new lease is being signed. Digital platforms can bring those activities into one workflow and give landlords a clearer view of how their properties are being managed. As professional rental management develops, suppliers that support reliable day-to-day service should find demand that continues between lettings.
AI Is Taking On Routine Property Service Tasks
AI tools are moving into specific tasks that take time from brokers and property managers. They can help draft listing material, respond to common questions and direct service requests to the appropriate team. Their usefulness depends on whether they draw from accurate property information and pass work to people who can resolve it.
Country Garden Services offers an example of operational use. In its 2026 interim report, the company said its work order assistant automatically assigned 74% of requests. For a property manager, assigning a request promptly can reduce manual sorting and give staff more time to complete repairs and follow up with residents. This is a company result, but it demonstrates a measurable task for which operators may pay.
Broker tools are developing along the same lines. Anjuke introduced its paid Intelligent Xiao An offering in 2025 to help agents with customer conversations, marketing content and follow-up. The next test for these products is whether they improve completed work, rather than simply generating a faster first response. Suppliers that connect AI to listings, service records and staff workflows should be better placed to retain customers as adoption grows.
China Proptech Market Future Opportunities
Commercial Buildings Need Better Operating Data
Commercial property owners need a reliable view of leases, vacant space, rent collection and operating costs across their buildings. That information helps managers decide where to focus leasing and maintenance work. It also becomes more valuable when investors require consistent reporting on an asset’s performance over time.
The operating pressure is clear in offices. Cushman & Wakefield reported a 22.5% vacancy rate for Shanghai’s office market in the second quarter of 2026. At the same time, the Shanghai Stock Exchange’s updated REIT reporting guidance, applied from 2025 annual reports, calls for more detailed checks of asset valuations and distributable amounts. These developments create distinct reasons to improve the underlying property records: managers need to act on weak occupancy, while listed asset owners need dependable figures for reporting.
Proptech suppliers can address this need by bringing lease, occupancy, maintenance and financial information into a usable view of each asset. The opportunity extends to connecting existing building systems and making information consistent across a portfolio. Adoption will depend on whether owners can use the resulting data to improve decisions and produce reports they trust. As more commercial assets are managed and assessed on continuing income, these capabilities should support demand beyond residential transactions.
Unlock Market Intelligence
Explore the market potential with our data-driven report
China Proptech Market Segmentation Analysis
By Property Type:
- Residential
- Commercial
- Industrial & Logistics
- Hospitality
Residential Stock Carries 52% of Property Type Demand
Residential accounts for an estimated 52% of China’s proptech market in 2026. Homes create demand at several stages: owners and agents need listing and transaction tools, rental operators need tenancy records, and property managers need systems for resident requests and maintenance. These activities give residential platforms a broad base of users across occupied properties as well as homes changing hands. For this segmentation, each property is classified by its principal use; hotels and industrial facilities sit outside Residential.
Commercialis the fastest-growing property type in the supplied market model, with a projected 19.90% CAGR during 2027–2033. Office and retail owners need clearer information on vacant space, tenants and operating performance as they compete to retain occupiers. In the second quarter of 2026, Shanghai’s retail property vacancy rate reached 10.03%, illustrating the leasing pressure that can make such tools useful. Commercial starts from a smaller proptech base than Residential, leaving more room for adoption as owners improve how they manage existing assets
By Solution:
- Software
- Services
Software Platforms Carry 64% of Solution Demand
Software holds an estimated 64% share in 2026. Listing platforms, rental applications and building management systems hold records that customers use repeatedly, supporting continued demand for subscriptions and licences. Digital tools are also becoming part of brokers’ normal work: a study released by Anjuke in July 2026 found that 27.7% of surveyed property agents used AI tools. That survey measures tool uses rather than software spending, but it shows how digital applications are entering daily property workflows.
Services is projected to grow fastest, at an 18.50% CAGR during 2027–2033. As customers adopt more applications, they need help connecting property records, migrating data, configuring workflows and supporting the systems in use. A landlord or operator with records spread across buildings may require substantial integration work before its software provides a dependable portfolio view. This category covers separately billed technology implementation and support; software subscriptions remain in Software, while routine offline property management is excluded.
Unlock Market Intelligence
Explore the market potential with our data-driven report
China Proptech Market Competitive Landscape
The industry is consolidated, with the top five companies together holding a combined 27% share in 2026. The five companies are Tianjin Xiaowu Information & Technology Co., Ltd. (Beike), Shanghai Ruijia Information Technology Co., Ltd. (Anjuke), Tianjin Chuangxiang Information Technology Co., Ltd. (Ziroom), Onewo Inc. and E-House (China) Enterprise Holdings Limited (E-House Enterprise Group). The remaining share is distributed across the other participants listed below.
Key Companies in the China Proptech Market
- Tianjin Xiaowu Information & Technology Co., Ltd. (Beike)
- Shanghai Ruijia Information Technology Co., Ltd. (Anjuke)
- Tianjin Chuangxiang Information Technology Co., Ltd. (Ziroom)
- Onewo Inc.
- E-House (China) Enterprise Holdings Limited
- Shenzhen Mingyuan Cloud Technology Co., Ltd.
- Country Garden Life Services Group Co., Ltd.
- Shanghai Moyu Investment Management Co., Ltd. (Mofang Apartment)
- Fangdd Network Group Ltd.
- Beijing SouFun Science and Technology Development Co., Ltd. (Fang.com)
Company Profiling
The following profiles cover the five leading companies shaping product development, distribution and competitive positioning in the industry.
Tianjin Xiaowu Information & Technology Co., Ltd (Beike): Beike connects buyers, sellers and agents through its property transaction platform and brokerage network, which had 60,274 storesat the end of June 2026. It also provides rental and home services. In August 2026, Beike reported expanding a Carefree Rent service model covering lease placement and management throughout the tenancy.
Shanghai Ruijia Information Technology Co., Ltd. (Anjuke): Anjuke combines property search and listing promotion with data and working tools for brokers. Its products support housing discovery, local market analysis and agent activity. In July 2026, its research institute released a brokerage industry study examining agents’ use of AI and digital property tools.
Tianjin Chuangxiang Information Technology Co., Ltd. (Ziroom): Ziroom operates a residential rental platform covering property search, tenancy and ongoing management for owners and renters. In June 2026, Ziroom Research Institute jointly released a study of the long-term rental market in ten major cities, examining rental demand and transaction patterns.
Onewo Inc.: Onewo manages residential and commercial properties and develops digital tools for building operations. Its September 2026 interim report described taking its Lingshi building operations technology from internal use into external customer projects.
E-House (China) Enterprise Holdings: E-House provides property data and related services through its CRIC business. Its2026 interim report says it has begun closing its brokerage network services, so that business should no longer be presented as an expanding part of its profile. The same report sets out plans to combine CRIC with its Deeplink real estate AI products under a new CRIC-Deeplink brand.
Recent Developments in the China Proptech Market
- In August 2026, Country Garden Life Services Group Co., Ltd. launched a dedicated commercial and enterprise brand covering more than 20 airports, more than 70 industrial parks and facility management in more than 18 cities. The launch moves a residential property operator into non-residential facility management, which widens demand for building operating systems, security and energy management across airports and industrial parks.
Frequently Asked Questions
Related Report
- Market Segmentation
- Research Scope
- Research Methodology
- Definitions and Assumptions
- Executive Summary
- China Proptech Market Policies, Regulations, and Standards
- China Proptech Market Dynamics
- Growth Factors
- Challenges
- Trends
- Opportunities
- China Proptech Market Statistics, 2023-2033F
- Market Size & Growth Outlook
- By Revenues in USD Million
- Market Segmentation & Growth Outlook
- By Property Type
- Residential- Market Insights and Forecast 2023-2033, USD Million
- Commercial- Market Insights and Forecast 2023-2033, USD Million
- Industrial & Logistics- Market Insights and Forecast 2023-2033, USD Million
- Hospitality- Market Insights and Forecast 2023-2033, USD Million
- By Solution
- Software- Market Insights and Forecast 2023-2033, USD Million
- Services- Market Insights and Forecast 2023-2033, USD Million
- By Deployment
- Cloud- Market Insights and Forecast 2023-2033, USD Million
- On-Premise- Market Insights and Forecast 2023-2033, USD Million
- By End User
- Property Owners & Developers- Market Insights and Forecast 2023-2033, USD Million
- Real Estate Agents & Brokerages- Market Insights and Forecast 2023-2033, USD Million
- Facility & Property Managers- Market Insights and Forecast 2023-2033, USD Million
- Property Investors & REITs- Market Insights and Forecast 2023-2033, USD Million
- By Technology
- IoT & Smart Sensor Networks- Market Insights and Forecast 2023-2033, USD Million
- AI & Big Data Analytics- Market Insights and Forecast 2023-2033, USD Million
- AR, VR & Digital Twins- Market Insights and Forecast 2023-2033, USD Million
- Blockchain & Distributed Ledger Technology- Market Insights and Forecast 2023-2033, USD Million
- By Competitors
- Competition Characteristics
- Market Share & Analysis
- By Property Type
- Market Size & Growth Outlook
- China Residential Proptech Market Statistics, 2023-2033
- Market Size & Growth Outlook
- By Revenues in USD Million
- Market Segmentation & Growth Outlook
- By Solution- Market Insights and Forecast 2023-2033, USD Million
- By Deployment- Market Insights and Forecast 2023-2033, USD Million
- By End User- Market Insights and Forecast 2023-2033, USD Million
- By Technology- Market Insights and Forecast 2023-2033, USD Million
- Market Size & Growth Outlook
- China Commercial Proptech Market Statistics, 2023-2033
- Market Size & Growth Outlook
- By Revenues in USD Million
- Market Segmentation & Growth Outlook
- By Solution- Market Insights and Forecast 2023-2033, USD Million
- By Deployment- Market Insights and Forecast 2023-2033, USD Million
- By End User- Market Insights and Forecast 2023-2033, USD Million
- By Technology- Market Insights and Forecast 2023-2033, USD Million
- Market Size & Growth Outlook
- China Industrial & Logistics Proptech Market Statistics, 2023-2033
- Market Size & Growth Outlook
- By Revenues in USD Million
- Market Segmentation & Growth Outlook
- By Solution- Market Insights and Forecast 2023-2033, USD Million
- By Deployment- Market Insights and Forecast 2023-2033, USD Million
- By End User- Market Insights and Forecast 2023-2033, USD Million
- By Technology- Market Insights and Forecast 2023-2033, USD Million
- Market Size & Growth Outlook
- China Hospitality Proptech Market Statistics, 2023-2033
- Market Size & Growth Outlook
- By Revenues in USD Million
- Market Segmentation & Growth Outlook
- By Solution- Market Insights and Forecast 2023-2033, USD Million
- By Deployment- Market Insights and Forecast 2023-2033, USD Million
- By End User- Market Insights and Forecast 2023-2033, USD Million
- By Technology- Market Insights and Forecast 2023-2033, USD Million
- Market Size & Growth Outlook
- Competitive Outlook
- Company Profiles
- Tianjin Xiaowu Information & Technology Co., Ltd. (Beike)
- Business Description
- Product Portfolio
- Collaborations & Alliances
- Recent Developments
- Financial Details
- Others
- Shanghai Ruijia Information Technology Co., Ltd. (Anjuke)
- Business Description
- Product Portfolio
- Collaborations & Alliances
- Recent Developments
- Financial Details
- Others
- Tianjin Chuangxiang Information Technology Co., Ltd. (Ziroom)
- Business Description
- Product Portfolio
- Collaborations & Alliances
- Recent Developments
- Financial Details
- Others
- Onewo Inc.
- Business Description
- Product Portfolio
- Collaborations & Alliances
- Recent Developments
- Financial Details
- Others
- E-House Enterprise Group
- Business Description
- Product Portfolio
- Collaborations & Alliances
- Recent Developments
- Financial Details
- Others
- Shenzhen Mingyuan Cloud Technology Co., Ltd.
- Business Description
- Product Portfolio
- Collaborations & Alliances
- Recent Developments
- Financial Details
- Others
- Country Garden Life Services Group Co., Ltd.
- Business Description
- Product Portfolio
- Collaborations & Alliances
- Recent Developments
- Financial Details
- Others
- Shanghai Moyu Investment Management Co., Ltd. (Mofang Apartment)
- Business Description
- Product Portfolio
- Collaborations & Alliances
- Recent Developments
- Financial Details
- Others
- Fangdd Network Group Ltd.
- Business Description
- Product Portfolio
- Collaborations & Alliances
- Recent Developments
- Financial Details
- Others
- Beijing SouFun Science and Technology Development Co., Ltd. (Fang.com)
- Business Description
- Product Portfolio
- Collaborations & Alliances
- Recent Developments
- Financial Details
- Others
- Tianjin Xiaowu Information & Technology Co., Ltd. (Beike)
- Company Profiles
- Disclaimer
| Segment | Sub-Segment |
|---|---|
| By Property Type |
|
| By Solution |
|
| By Deployment |
|
| By End User |
|
| By Technology |
|
Research Methodology
This study followed a structured approach comprising four key phases to assess the size and scope of the electro-oxidation market. The process began with thorough secondary research to collect data on the target market, related markets, and broader industry context. These findings, along with preliminary assumptions and estimates, were then validated through extensive primary research involving industry experts from across the value chain. To calculate the overall market size, both top-down and bottom-up methodologies were employed. Finally, market segmentation and data triangulation techniques were applied to refine and validate segment-level estimations.
Secondary Research
The secondary research phase involved gathering data from a wide range of credible and published sources. This step helped in identifying industry trends, defining market segmentation, and understanding the market landscape and value chain.
Sources consulted during this phase included:
- Company annual reports, investor presentations, and press releases
- Industry white papers and certified publications
- Trade directories and market-recognized databases
- Articles from authoritative authors and reputable journals
- Gold and silver standard websites
Secondary research was critical in mapping out the industry's value chain and monetary flow, identifying key market segments, understanding regional variations, and tracking significant industry developments.
Other key sources:
- Financial disclosures
- Industry associations and trade bodies
- News outlets and business magazines
- Academic journals and research studies
- Paid industry databases
Primary Research
To validate secondary data and gain deeper market insights, primary research was conducted with key stakeholders across both the supply and demand sides of the market.
On the demand side, participants included decision-makers and influencers from end-user industries—such as CIOs, CTOs, and CSOs—who provided first-hand perspectives on market needs, product usage, and future expectations.
On the supply side, interviews were conducted with manufacturers, industry associations, and institutional participants to gather insights into current offerings, product pipelines, and market challenges.
Primary interviews provided critical inputs such as:
- Market size and revenue data
- Product and service breakdowns
- Market forecasts
- Regional and application-specific trends
Stakeholders consulted included:
- Leading OEM and solution providers
- Channel and distribution partners
- End users across various applications
- Independent consultants and industry specialists
Market Size Estimation and Data Triangulation
- Identifying Key Market Participants (Secondary Research)
- Goal: To identify the major players or companies in the target market. This typically involves using publicly available data sources such as industry reports, market research publications, and financial statements of companies.
- Tools: Reports from firms like Gartner, Forrester, Euromonitor, Statista, IBISWorld, and others. Public financial statements, news articles, and press releases from top market players.
- Extracting Earnings of Key Market Participants
- Goal: To estimate the earnings generated from the product or service being analyzed. This step helps in understanding the revenue potential of each market player in a specific geography.
- Methods: Earnings data can be gathered from:
- Publicly available financial reports (for listed companies).
- Interviews and primary data sources from professionals, such as Directors, VPs, SVPs, etc. This is especially useful for understanding more nuanced, internal data that isn't publicly disclosed.
- Annual reports and investor presentations of key players.
- Data Collation and Development of a Relevant Data Model
- Goal: To collate inputs from both primary and secondary sources into a structured, data-driven model for market estimation. This model will incorporate key market KPIs and any independent variables relevant to the market.
- Key KPIs: These could include:
- Market size, growth rate, and demand drivers.
- Industry-specific metrics like market share, average revenue per customer (ARPC), or average deal size.
- External variables, such as economic growth rates, inflation rates, or commodity prices, that could affect the market.
- Data Modeling: Based on this data, the market forecasts are developed for the next 5 years. A combination of trend analysis, scenario modeling, and statistical regression might be used to generate projections.
- Scenario Analysis
- Goal: To test different assumptions and validate how sensitive the market is to changes in key variables (e.g., market demand, regulatory changes, technological disruptions).
- Types of Scenarios:
- Base Case: Based on current assumptions and historical data.
- Best-Case Scenario: Assuming favorable market conditions, regulatory environments, and technological advancements.
- Worst-Case Scenario: Accounting for adverse factors, such as economic downturns, stricter regulations, or unexpected disruptions.