US Proptech Market Report: Trends, Growth and Forecast (2027-2033)
By Property Type (Residential, Commercial, Industrial & Logistics, Hospitality), By Solution (Software, Services), By Deployment (Cloud, On-Premise), By End User (Property Owners & Developers, Real Estate Agents & Brokerages, Facility & Property Managers, Property Investors & REITs), By Technology (IoT & Smart Sensor Networks, AI & Big Data Analytics, AR, VR & Digital Twins, Blockchain & Distributed Ledger Technology) ... Read more
|
Major Players
|
US Proptech Market Overview
Proptech in the United States spans cloud-hosted software, marketplace platforms and connected building systems that support real estate transactions, leasing, property management and building operations. Property owners, developers, brokers, facility managers and residential end users rely on this software to search, transact, lease, monitor and maintain properties across residential, commercial and industrial portfolios. The US Proptech market is projected to grow at a CAGR of 10.07% between 2027 and 2033.
Key Highlights of the US Proptech Market
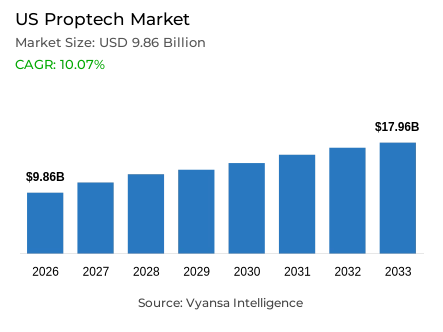
- The United States Proptech Market was valued at USD 9.86 billion in 2026 and is estimated at USD 10.10 billion in 2027.
- The market is forecasted to reach USD 17.96 billion by 2033.
- The market is forecast to expand at a compound annual growth rate of 10.07% between 2027 and 2033.
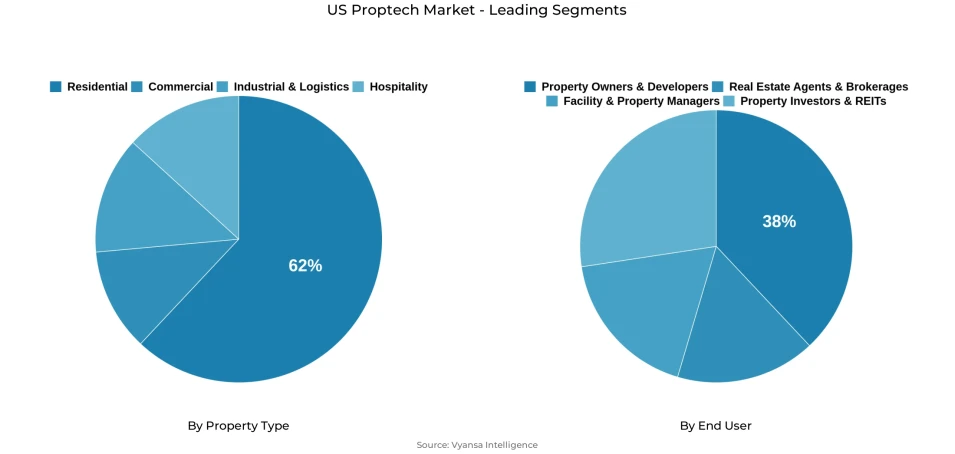
- By property type, residential led the market with a 62% share in 2026.
- Industrial & logistics is the fastest-growing property type, expanding at an 18.19% CAGR between 2027 and 2033.
- By end user, property owners & developers led the market with a 38% share in 2026.
- Facility & property managers is the fastest-growing end-user segment, expanding at a 16.45% CAGR between 2027 and 2033.
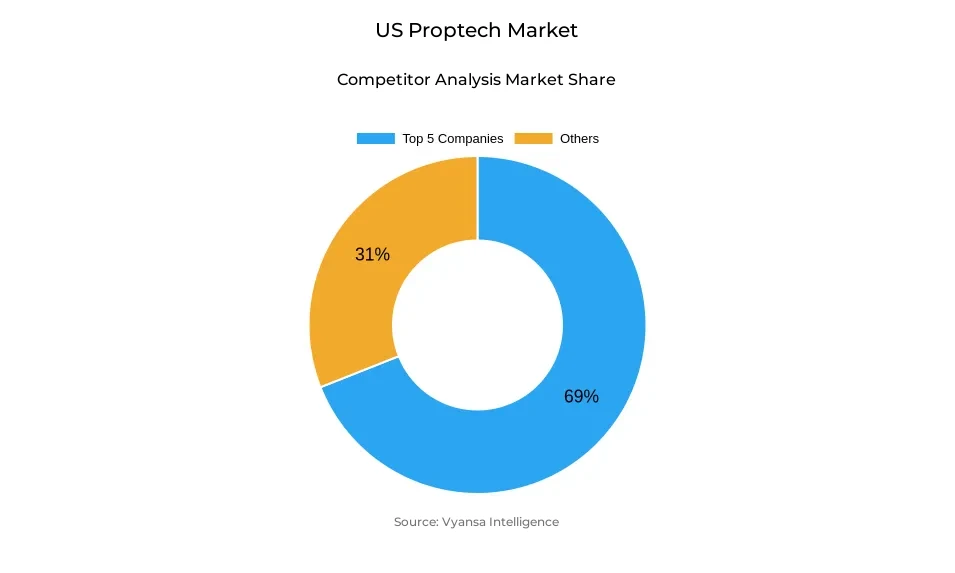
- The market is consolidated, with the top five companies holding a combined 69% share of total revenue in 2026.
The proptech market in the United States is supported by the need to market available properties efficiently and manage buildings throughout their use. Unsold housing inventory increased from 1.55 million units in May 2026 to 1.62 million in August, expanding the pool of properties competing for consumer attention. This strengthens the case for accurate digital listings, effective property search and timely enquiry handling. Even when sales take longer, brokers need tools that keep property information current and help convert interest into viewings.
Demand also extends beyond homes changing ownership. Census data recorded approximately 46.1 million renter-occupied homes in 2024, representing a substantial base of properties requiring rent collection, lease administration, maintenance and resident communication. These activities recur throughout a tenancy, creating continuing demand for software that reduces administrative work and keeps reliable records. For proptech suppliers, this operating base provides opportunities to build lasting customer relationships around everyday property requirements, making adoption less dependent on fluctuations in home sales.
Digital tools already have an established role in transactions. NAR’s 2025 technology survey found that 79% of responding real estate professionals used electronic signatures, demonstrating widespread acceptance of digital documentation. This provides a foundation for further adoption of tools that simplify approvals, organize transaction records and reduce repeated manual entry. Over the forecast period, the combination of a larger listing pool, continuing rental administration and established digital practices should support market expansion, particularly for providers that demonstrate clear time savings and dependable service.
US Proptech Market Driver
Easing Mortgage Lock-In Is Supporting Recovery in Digital Property Transactions
High mortgage rates have discouraged many existing homeowners from selling because moving would require replacing older low-rate loans with substantially more expensive financing. This has reduced housing inventory and transaction volumes across the marketplaces, brokerage platforms, mortgage technology and digital transaction services that depend on homes changing ownership. As the stock of ultra-low-rate mortgages gradually declines, this constraint is beginning to ease.
By the third quarter of 2025, 21.2% of mortgaged US homeowners carried rates of 6% or above, compared with 20% holding rates below 3%. This marked an important change from the post-pandemic period when ultra-low-rate mortgages represented a much larger obstacle to homeowner mobility. The lock-in effect has not disappeared, but the mortgage base is gradually resetting toward current financing conditions.
The effect is beginning to appear in housing activity. Existing-home sales increased to an annualized 4.17 million units in May 2026, up 3.2% year over year. Continued normalization creates additional listings, buyer enquiries, financing applications and closings that move through Proptech platforms, allowing transaction-linked software and marketplace revenue to expand without depending entirely on new user acquisition.
US Proptech Market Challenge
Restrictions on Algorithmic Rent Pricing Are Forcing Software Providers to Redesign Pricing Systems
Algorithmic rent-pricing platforms have faced growing scrutiny over the use of nonpublic competitor information to generate rental recommendations. This creates a direct challenge for revenue-management software providers because the value of some platforms historically came from combining property-level operating data across multiple landlords. Regulators increasingly require pricing decisions to remain independent rather than being influenced by competitively sensitive information supplied by other property owners.
In November 2025, the US Department of Justice reached a proposed settlement with RealPage requiring changes to its revenue-management practices, including restrictions on competitively sensitive information and features regulators argued could align pricing among competing landlords. New York also introduced restrictions during 2025 covering algorithmic tools that facilitate coordinated rental pricing.
The commercial impact extends beyond RealPage because property owners now have stronger incentives to examine how rent recommendations are generated before adopting or renewing software. Revenue-management providers must demonstrate compliant data architecture and greater transparency while preserving useful pricing intelligence, increasing product-development and customer-qualification requirements across this proptech category.
US Proptech Market Trends
Proptech Is Consolidating Around Integrated Portfolio-Wide Platforms
Property owners historically purchased separate systems for leasing, property management, accounting, resident communications and portfolio analysis. That fragmented model is increasingly being replaced by connected platforms that maintain a common property and customer data layer across several functions. This allows larger operators to reduce duplicate records, simplify integration and manage multiple properties through fewer technology relationships.
Vendor expansion is reinforcing this shift. In August 2026, CoStar Group completed its USD 800 million acquisition of Zonda, adding new-home construction data, homebuilder software and residential marketplaces to an existing ecosystem that already includes commercial information, rental marketplaces, residential search and digital property technology.
The trend increases the value of platforms capable of serving several stages of the property lifecycle rather than competing through a single point solution. As owners place more operational data inside one software environment, integration requirements and switching costs also increase, strengthening recurring relationships between large real estate operators and their principal technology providers.
Agentic AI Is Moving from Property Assistance to Autonomous Workflow Execution
AI in Proptech is progressing beyond chatbots that answer resident or prospect questions toward agents capable of completing operational tasks. Leasing follow-up, maintenance routing, accounting and resident-service workflows contain repetitive decisions that traditionally require property staff even when the initial enquiry is automated. Agentic AI allows software to act on the information rather than simply present it to an employee.
In June 2026, Yardi expanded Virtuoso Enterprise with AI agents spanning leasing, resident services, maintenance and accounting, describing the transition as moving from answering questions toward completing actions. In August, RealPage introduced its Lumina AI Suite, integrating AI agents, operational intelligence and portfolio analytics through one governed data environment.
This technology can reduce the amount of staff time required for repetitive property-management activity while shortening leasing and maintenance workflows. Adoption should initially be strongest among large multifamily and commercial portfolios where high transaction volumes justify deeper automation. Competitive differentiation should therefore move increasingly from whether a platform offers AI toward how much measurable operational work its AI can complete autonomously.
US Proptech Market Opportunity
Fragmented Small Rental Portfolios Create a Large SaaS Expansion Opportunity
The US single-family rental market remains highly fragmented despite substantial attention given to large institutional landlords. GAO research estimated that investors owning more than 1,000 properties collectively controlled only about 3% of US single-family rental homes, leaving most rental properties outside large institutional portfolios. This creates a substantial underserved customer base of smaller landlords and property managers that cannot justify enterprise-scale property-management systems.
The opportunity is becoming more relevant following the July 2026 federal housing legislation restricting most additional single-family-home purchases by covered institutional investors controlling at least 350 homes. The measure does not require existing portfolios to be sold, but it limits acquisition-led expansion by larger investors, reinforcing the importance of smaller property owners and managers within future rental-market activity.
Capturing this market requires lower-cost cloud software designed around small portfolios, including digital leasing, rent collection, maintenance coordination, accounting and optional AI support. Consolidation among third-party managers provides another commercialization route. PURE Property Management and HomeRiver Group combined in January 2026 to create a platform managing more than 40,000 properties across over 200 markets, demonstrating the potential to standardize fragmented rental portfolios through shared technology.
Unlock Market Intelligence
Explore the market potential with our data-driven report
US Proptech Market Segmentation Analysis
By Property Type:
- Residential
- Commercial
- Industrial & Logistics
- Hospitality
Residential Leads While Industrial & Logistics Records the Fastest Growth
Residential accounts for 62% of the US Proptech market in 2026 because property search, brokerage, home transactions, mortgage technology and residential property management represent some of the country's largest established Proptech revenue pools. Large platforms already connect millions of consumers and professionals across home discovery, rentals and transactions, giving Residential a deeper digital ecosystem than other property categories.
Industrial & Logistics is the fastest-growing Property Type at an 18.19% CAGR during 2027 to 2033. Growth is supported by increasing use of connected building management, energy optimization, predictive maintenance and portfolio software across warehouses and logistics properties. It expands faster from a smaller technology base than Residential, where digital search and transaction platforms are already comparatively mature.
By End User:
- Property Owners & Developers
- Real Estate Agents & Brokerages
- Facility & Property Managers
- Property Investors & REITs
Property Owners & Developers Lead While Facility & Property Managers Record the Fastest Growth
Property owners & developers account for the largest end user share at 38% in 2026 because they procure technology across leasing, property administration, development management, financial reporting and portfolio analysis. Large owners can deploy these systems across entire portfolios, making their software spending broader than that of end users requiring only individual transaction or property-search functionality.
Facility & property managers are the fastest-growing end user segment at a 16.45% CAGR during 2027 to 2033. Growth comes from software increasingly automating recurring leasing, maintenance, work-order and resident-service activity carried out by operators every day. Unlike periodic investment or development decisions, these workflows scale continuously with the number of properties and occupants being managed.
Unlock Market Intelligence
Explore the market potential with our data-driven report
US Proptech Market Competitive Landscape
The US Proptech market is consolidated. The top five companies account for a combined 69% share in 2026. Major companies include Opendoor Technologies Inc., CoStar Group Inc., Zillow Group Inc., Yardi Systems Inc., and RealPage Inc.
Key Companies in the US Proptech Market
- Opendoor Technologies Inc.
- CoStar Group Inc.
- Zillow Group Inc.
- Yardi Systems Inc.
- RealPage Inc.
- Procore Technologies Inc.
- AppFolio Inc.
- Entrata Inc.
- MRI Software LLC
- ARGUS Software Inc.
Company Profiling
The following profiles cover the five leading companies shaping product development, distribution and competitive positioning in the market.
Opendoor Technologies Inc.: Opendoor operates a technology-driven residential property transaction platform that provides homeowners with digital selling and purchasing options. The company generated approximately USD 883 million in second-quarter 2026 revenue and purchased 4,378 homes during the quarter as acquisition activity increased. In September 2026, Opendoor Home Loans exited beta and expanded financing to fixed and adjustable-rate mortgage products, extending the platform further into the home transaction journey.
CoStar Group Inc.: CoStar combines commercial and residential real estate data, analytics and marketplaces through brands including CoStar, Apartments.com, Homes.com, Ten-X and Matterport. Second-quarter 2026 revenue reached approximately USD 925 million, increasing 18% year over year. In August 2026, the company completed its USD 800 million acquisition of Zonda, extending its platform into homebuilder software, new-home construction intelligence and additional residential marketplaces.
Zillow Group Inc.: Zillow operates a large residential digital ecosystem spanning property search, rentals, agent services and mortgage-related activity. The platform recorded approximately 239 million average monthly users during the second quarter of 2026 and generated USD 772 million in revenue. In March 2026, Zillow launched AI mode, allowing users to conduct conversational home searches and move directly into actions such as scheduling tours and contacting agents.
Yardi Systems Inc.: Yardi supplies integrated property-management software across multifamily, commercial and other real estate portfolios. Its Virtuoso Enterprise environment connects leasing, resident services, maintenance and accounting through a common operating platform. In June 2026, Yardi expanded the system with specialized AI agents capable of performing tasks across these workflows, moving its automation strategy from conventional assistance toward more autonomous property operations.
RealPage Inc.: RealPage provides rental-property management, leasing, financial and operational software across more than 24 million housing units worldwide. In July 2026, it acquired Cherre to strengthen institutional data intelligence, followed in August by the launch of the Lumina AI Suite connecting agentic AI with operational and portfolio intelligence. The company is simultaneously redesigning parts of its revenue-management business following regulatory action over algorithmic rent-pricing practices.
Recent Developments in the US Proptech Market
- August 2026: CoStar Group completed its USD 800 million acquisition of Zonda, adding new-home construction data, builder software and residential marketplaces to its wider real estate technology ecosystem.
- August 2026: RealPage launched the Lumina AI Suite, integrating agentic workflow execution, operational intelligence and institutional analytics within one governed property-data environment.
Frequently Asked Questions
Related Report
- Market Segmentation
- Research Scope
- Research Methodology
- Definitions and Assumptions
- Executive Summary
- US Proptech Market Policies, Regulations, and Standards
- US Proptech Market Dynamics
- Growth Factors
- Challenges
- Trends
- Opportunities
- US Proptech Market Statistics, 2023-2033F
- Market Size & Growth Outlook
- By Revenues in USD Million
- Market Segmentation & Growth Outlook
- By Property Type
- Residential- Market Insights and Forecast 2023-2033, USD Million
- Commercial- Market Insights and Forecast 2023-2033, USD Million
- Industrial & Logistics- Market Insights and Forecast 2023-2033, USD Million
- Hospitality- Market Insights and Forecast 2023-2033, USD Million
- By Solution
- Software- Market Insights and Forecast 2023-2033, USD Million
- Services- Market Insights and Forecast 2023-2033, USD Million
- By Deployment
- Cloud- Market Insights and Forecast 2023-2033, USD Million
- On-Premise- Market Insights and Forecast 2023-2033, USD Million
- By End User
- Property Owners & Developers- Market Insights and Forecast 2023-2033, USD Million
- Real Estate Agents & Brokerages- Market Insights and Forecast 2023-2033, USD Million
- Facility & Property Managers- Market Insights and Forecast 2023-2033, USD Million
- Property Investors & REITs- Market Insights and Forecast 2023-2033, USD Million
- By Technology
- IoT & Smart Sensor Networks- Market Insights and Forecast 2023-2033, USD Million
- AI & Big Data Analytics- Market Insights and Forecast 2023-2033, USD Million
- AR, VR & Digital Twins- Market Insights and Forecast 2023-2033, USD Million
- Blockchain & Distributed Ledger Technology- Market Insights and Forecast 2023-2033, USD Million
- By Competitors
- Competition Characteristics
- Market Share & Analysis
- By Property Type
- Market Size & Growth Outlook
- US Residential Proptech Market Statistics, 2023-2033
- Market Size & Growth Outlook
- By Revenues in USD Million
- Market Segmentation & Growth Outlook
- By Solution- Market Insights and Forecast 2023-2033, USD Million
- By Deployment- Market Insights and Forecast 2023-2033, USD Million
- By End User- Market Insights and Forecast 2023-2033, USD Million
- By Technology- Market Insights and Forecast 2023-2033, USD Million
- Market Size & Growth Outlook
- US Commercial Proptech Market Statistics, 2023-2033
- Market Size & Growth Outlook
- By Revenues in USD Million
- Market Segmentation & Growth Outlook
- By Solution- Market Insights and Forecast 2023-2033, USD Million
- By Deployment- Market Insights and Forecast 2023-2033, USD Million
- By End User- Market Insights and Forecast 2023-2033, USD Million
- By Technology- Market Insights and Forecast 2023-2033, USD Million
- Market Size & Growth Outlook
- US Industrial & Logistics Proptech Market Statistics, 2023-2033
- Market Size & Growth Outlook
- By Revenues in USD Million
- Market Segmentation & Growth Outlook
- By Solution- Market Insights and Forecast 2023-2033, USD Million
- By Deployment- Market Insights and Forecast 2023-2033, USD Million
- By End User- Market Insights and Forecast 2023-2033, USD Million
- By Technology- Market Insights and Forecast 2023-2033, USD Million
- Market Size & Growth Outlook
- US Hospitality Proptech Market Statistics, 2023-2033
- Market Size & Growth Outlook
- By Revenues in USD Million
- Market Segmentation & Growth Outlook
- By Solution- Market Insights and Forecast 2023-2033, USD Million
- By Deployment- Market Insights and Forecast 2023-2033, USD Million
- By End User- Market Insights and Forecast 2023-2033, USD Million
- By Technology- Market Insights and Forecast 2023-2033, USD Million
- Market Size & Growth Outlook
- Competitive Outlook
- Company Profiles
- Opendoor Technologies Inc. (Opendoor)
- Business Description
- Product Portfolio
- Collaborations & Alliances
- Recent Developments
- Financial Details
- Others
- CoStar Group, Inc. (including brands)
- Business Description
- Product Portfolio
- Collaborations & Alliances
- Recent Developments
- Financial Details
- Others
- Zillow Group, Inc. (including brands)
- Business Description
- Product Portfolio
- Collaborations & Alliances
- Recent Developments
- Financial Details
- Others
- Yardi Systems, Inc. (including brands)
- Business Description
- Product Portfolio
- Collaborations & Alliances
- Recent Developments
- Financial Details
- Others
- Realpage, Inc.
- Business Description
- Product Portfolio
- Collaborations & Alliances
- Recent Developments
- Financial Details
- Others
- Procore Technologies, Inc.
- Business Description
- Product Portfolio
- Collaborations & Alliances
- Recent Developments
- Financial Details
- Others
- AppFolio, Inc.
- Business Description
- Product Portfolio
- Collaborations & Alliances
- Recent Developments
- Financial Details
- Others
- Entrata, Inc.
- Business Description
- Product Portfolio
- Collaborations & Alliances
- Recent Developments
- Financial Details
- Others
- MRI Software LLC
- Business Description
- Product Portfolio
- Collaborations & Alliances
- Recent Developments
- Financial Details
- Others
- ARGUS Software, Inc.
- Business Description
- Product Portfolio
- Collaborations & Alliances
- Recent Developments
- Financial Details
- Others
- Opendoor Technologies Inc. (Opendoor)
- Company Profiles
- Disclaimer
| Segment | Sub-Segment |
|---|---|
| By Property Type |
|
| By Solution |
|
| By Deployment |
|
| By End User |
|
| By Technology |
|
Research Methodology
This study followed a structured approach comprising four key phases to assess the size and scope of the electro-oxidation market. The process began with thorough secondary research to collect data on the target market, related markets, and broader industry context. These findings, along with preliminary assumptions and estimates, were then validated through extensive primary research involving industry experts from across the value chain. To calculate the overall market size, both top-down and bottom-up methodologies were employed. Finally, market segmentation and data triangulation techniques were applied to refine and validate segment-level estimations.
Secondary Research
The secondary research phase involved gathering data from a wide range of credible and published sources. This step helped in identifying industry trends, defining market segmentation, and understanding the market landscape and value chain.
Sources consulted during this phase included:
- Company annual reports, investor presentations, and press releases
- Industry white papers and certified publications
- Trade directories and market-recognized databases
- Articles from authoritative authors and reputable journals
- Gold and silver standard websites
Secondary research was critical in mapping out the industry's value chain and monetary flow, identifying key market segments, understanding regional variations, and tracking significant industry developments.
Other key sources:
- Financial disclosures
- Industry associations and trade bodies
- News outlets and business magazines
- Academic journals and research studies
- Paid industry databases
Primary Research
To validate secondary data and gain deeper market insights, primary research was conducted with key stakeholders across both the supply and demand sides of the market.
On the demand side, participants included decision-makers and influencers from end-user industries—such as CIOs, CTOs, and CSOs—who provided first-hand perspectives on market needs, product usage, and future expectations.
On the supply side, interviews were conducted with manufacturers, industry associations, and institutional participants to gather insights into current offerings, product pipelines, and market challenges.
Primary interviews provided critical inputs such as:
- Market size and revenue data
- Product and service breakdowns
- Market forecasts
- Regional and application-specific trends
Stakeholders consulted included:
- Leading OEM and solution providers
- Channel and distribution partners
- End users across various applications
- Independent consultants and industry specialists
Market Size Estimation and Data Triangulation
- Identifying Key Market Participants (Secondary Research)
- Goal: To identify the major players or companies in the target market. This typically involves using publicly available data sources such as industry reports, market research publications, and financial statements of companies.
- Tools: Reports from firms like Gartner, Forrester, Euromonitor, Statista, IBISWorld, and others. Public financial statements, news articles, and press releases from top market players.
- Extracting Earnings of Key Market Participants
- Goal: To estimate the earnings generated from the product or service being analyzed. This step helps in understanding the revenue potential of each market player in a specific geography.
- Methods: Earnings data can be gathered from:
- Publicly available financial reports (for listed companies).
- Interviews and primary data sources from professionals, such as Directors, VPs, SVPs, etc. This is especially useful for understanding more nuanced, internal data that isn't publicly disclosed.
- Annual reports and investor presentations of key players.
- Data Collation and Development of a Relevant Data Model
- Goal: To collate inputs from both primary and secondary sources into a structured, data-driven model for market estimation. This model will incorporate key market KPIs and any independent variables relevant to the market.
- Key KPIs: These could include:
- Market size, growth rate, and demand drivers.
- Industry-specific metrics like market share, average revenue per customer (ARPC), or average deal size.
- External variables, such as economic growth rates, inflation rates, or commodity prices, that could affect the market.
- Data Modeling: Based on this data, the market forecasts are developed for the next 5 years. A combination of trend analysis, scenario modeling, and statistical regression might be used to generate projections.
- Scenario Analysis
- Goal: To test different assumptions and validate how sensitive the market is to changes in key variables (e.g., market demand, regulatory changes, technological disruptions).
- Types of Scenarios:
- Base Case: Based on current assumptions and historical data.
- Best-Case Scenario: Assuming favorable market conditions, regulatory environments, and technological advancements.
- Worst-Case Scenario: Accounting for adverse factors, such as economic downturns, stricter regulations, or unexpected disruptions.