India Proptech Market Report: Trends, Growth and Forecast (2027-2033)
By Property Type (Residential, Commercial, Industrial & Logistics, Hospitality), By Solution (Software, Services), By Deployment (Cloud, On-Premise), By End User (Property Owners & Developers, Real Estate Agents & Brokerages, Facility & Property Managers, Property Investors & REITs), By Technology (IoT & Smart Sensor Networks, AI & Big Data Analytics, AR, VR & Digital Twins, Blockchain & Distributed Ledger Technology) ... Read more
|
Major Players
|
India Proptech Market Overview
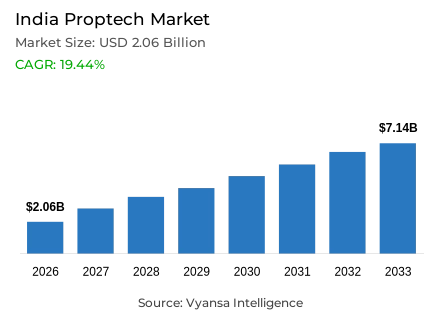
Proptech in India refers to digital platforms and software that support real estate discovery, brokerage, developer operations, property and facility management, and real estate investment, replacing paper-based listings, manual compliance filing and offline broker networks. Developers, brokers, facility managers and investors rely on these platforms across residential, commercial, industrial and hospitality real estate. The India Proptech market is projected to grow at a CAGR of 19.44% between 2027 and 2033.
Key Highlights of the India Proptech Market
- The India Proptech market was valued at USD 2.06 billion in 2026 and is estimated at USD 2.46 billion in 2027 and is projected to reach USD 7.14 billion by 2033.
- The market is forecast to expand at a compound annual growth rate of 19.44% between 2027 and 2033.
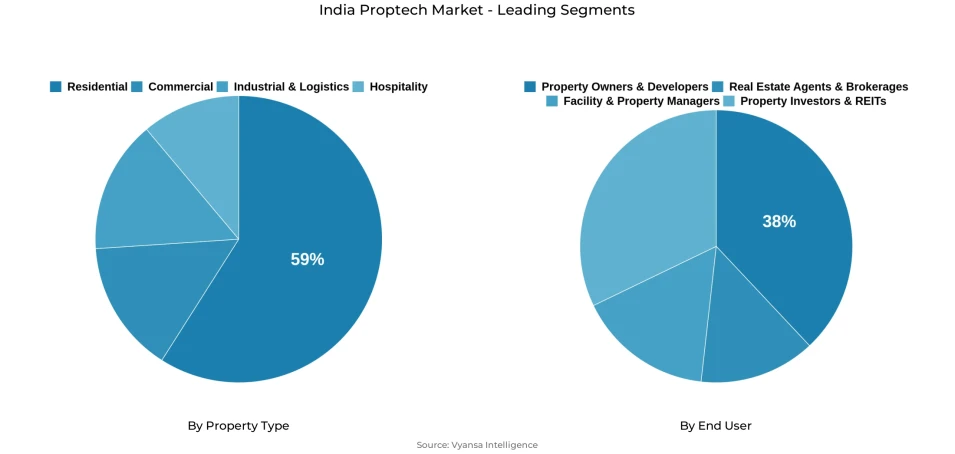
- By property type, residential led the market with a 59% share in 2026.
- Industrial & Logistics is the fastest-growing property type, expanding at a 26.33% CAGR between 2027 and 2033.
- By end user, property owners & developers led the market with a 38% share in 2026.
- Facility & property managers is the fastest-growing end-user group, expanding at a 25.03% CAGR between 2027 and 2033.
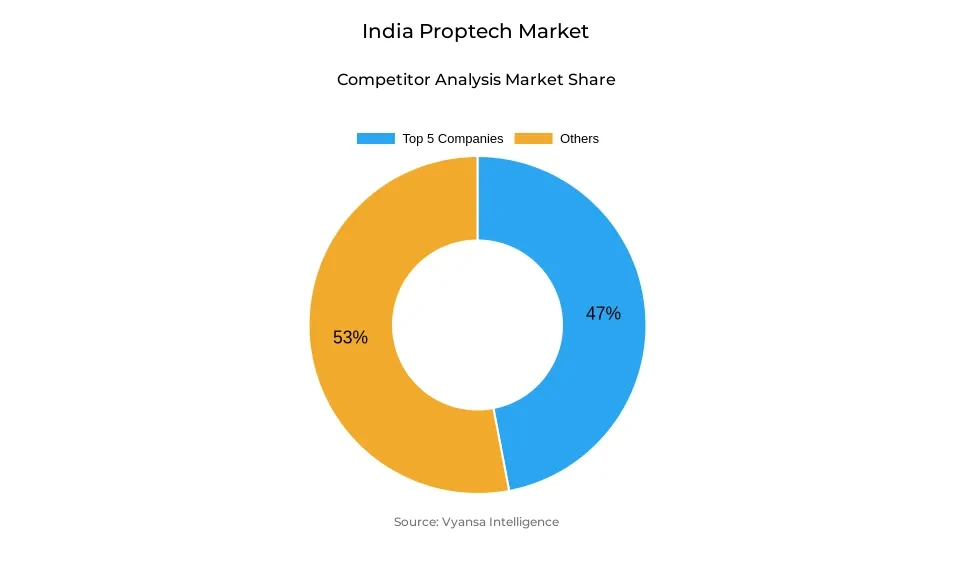
- The market structure is moderately fragmented, with the top five companies together holding a combined estimated 47% share in 2026.
The demand for proptech in India is gaining from property activity that creates work for developers, brokers and buyers beyond the initial search. Across seven major cities, 70,631 homes were sold in the first quarter of 2026, up 8% year on year, while new project launches rose 13%. Each launch brings inventory to present, enquiries to manage and buyers to guide through financing and documentation. Digital platforms become more valuable when they help complete these connected tasks, rather than only display listings.
Demand also extends beyond housing sales. India recorded 83.3 million square feet of office leasing in 2025, up 7.8% from 2024. In the first half of 2026, equity investment in real estate reached USD 8.5 billion, with development sites and completed office assets attracting much of the capital. As more space is leased, developed and held by investors, owners need dependable records for tenants, projects and operating performance. This widens the customer base for proptech software and continuing property services.
India Proptech Market Government Compliance
RERA directly increases software requirements for Indian property developers because registered projects require ongoing project, financial and construction disclosures rather than a single approval at launch. Developers must maintain a separate project account containing 70% of buyer collections and periodically update project information, making structured project and compliance data important throughout the development cycle.
India's regulated property-investment ecosystem is also expanding through the SM REIT framework. The structure allows smaller portfolios of completed, income-generating real estate to enter a regulated investment framework, with public issuance conducted through stock exchanges. This provides a formal route for fractional-property platforms to evolve toward regulated investment products rather than relying on private contractual structures.
The commercial effect is greater demand for platforms capable of handling compliant project reporting, investor onboarding, property data and recurring disclosures. Regulatory digitization therefore raises the operating threshold for informal providers while strengthening demand for specialized developer and investment technology.
India Proptech Market Driver
Rising Real Estate Transaction Value Is Expanding Proptech Usage
India's large property transaction base is increasing the number of customers and developers that interact with digital platforms across discovery, sales, financing and documentation. Proptech usage therefore grows not only because more consumers adopt apps, but because a larger amount of real estate value is passing through workflows that can be digitized and monetized.
India's primary residential market generated approximately USD 101 billion in sales value across 50 cities during 2025, increasing 16% from the previous year despite a more measured housing environment. More than 614,000 homes were sold during the year, giving property portals, CRM providers, mortgage platforms and transaction-service companies a substantial pool of transactions across which digital services can be attached.
The mechanism should remain active through the forecast period as developers increasingly combine digital marketing with lead management, financing and customer servicing. Each property transaction can support several Proptech revenue streams rather than a single listing fee, allowing technology spending to grow even when housing unit volumes fluctuate from year to year.
India Proptech Market Challenge
Uneven Land-Record Digitization Slows Fully Digital Property Transactions
India has digitized consumer-facing property discovery considerably faster than some of the land and cadastral records required to verify ownership. A buyer can discover a property, interact with a broker and begin financing digitally, but the transaction may still require additional verification when underlying parcel maps and ownership records are not fully integrated.
The Department of Land Resources reports computerization of Records of Rights at approximately 95%, while cadastral-map digitization remains only slightly above 68%. Registration computerization has progressed further, but integration between spatial maps, ownership records and registration databases remains uneven between states.
This gap limits how quickly Proptech companies can provide reliable end-to-end title verification nationally. India's new DILRMP 3.0 program for 2026 to 2031 continues the land-record modernization process, but implementation will remain state-dependent. Until integration becomes more uniform, platforms must combine digital workflows with additional legal and title-verification services rather than operating through fully automated transactions.
India Proptech Market Trends
Generative AI Is Automating Property Search, Sales and Customer Engagement
Artificial intelligence is moving from recommendation engines into core Proptech workflows such as lead prioritization, conversational customer service, valuation and property discovery. These applications reduce manual work for brokers and sales teams while allowing platforms to process much larger volumes of enquiries without increasing headcount proportionally.
NoBroker commercialized ConvoZen in 2025 after developing the conversational AI platform for its own customer operations. Microsoft reports that the system automated around 90% of quality audits and improved agent efficiency by approximately 30%. Square Yards has also expanded AI-driven valuation and property intelligence, while 99acres uses AI-powered recommendations as part of its property-search platform.
The technology is becoming commercially important rather than experimental. A June 2026 EY-Parthenon and CREDAI study estimated that generative AI could improve real estate sales velocity by 30% to 50% and reduce product-launch timelines by around 30%. Platforms able to convert these capabilities into measurable broker and developer productivity should gain an advantage over portals using AI only for basic recommendations.
Unlock Market Intelligence
Explore the market potential with our data-driven report
India Proptech Market Segmentation Analysis
By Property Type:
- Residential
- Commercial
- Industrial & Logistics
- Hospitality
Residential Leads Current Demand While Industrial & Logistics Records the Fastest Growth
Residential accounts for 59% of the India proptech market in 2026 because property search, rentals, home financing, brokerage, developer sales and residential-community management represent the country's most established Proptech use cases. Major platforms developed their largest user and broker networks around housing, giving Residential a much deeper digital ecosystem than other property categories.
Industrial & Logistics is the fastest-growing property type at a 26.33% CAGR during 2027 to 2033. Growth is supported by expanding warehousing, logistics and industrial property portfolios that require leasing software, facility management, automation and asset-monitoring technology. The segment expands faster from a smaller digital base, while Residential already operates across a comparatively mature property-search and transaction ecosystem.
By End User:
- Property Owners & Developers
- Real Estate Agents & Brokerages
- Facility & Property Managers
- Property Investors & REITs
Property Owners & Developers Lead While Facility & Property Managers Record the Fastest Growth
Property Owners & Developers account for 38% of India proptech market demand in 2026 because they purchase technology across several workflows, including project sales, CRM, regulatory reporting, customer management, and post-sale administration. Unlike individual brokers using mainly discovery and lead-generation tools, developers can deploy multiple systems across the lifecycle of each project.
Facility & Property Managers are the fastest-growing end user segment at a 25.03% CAGR during 2027 to 2033 as completed residential communities, offices and other managed properties expand the installed base requiring recurring digital operations. NoBrokerHood illustrates the scale already developing around security, billing, maintenance, and community-management software.
Unlock Market Intelligence
Explore the market potential with our data-driven report
India Proptech Market Competitive Landscape
The India proptech market is moderately fragmented. The top five companies account for a combined estimated 47% share in 2026. Major companies include NoBroker Technologies Solutions Pvt Ltd, Info Edge India Limited, Magicbricks Realty Services Limited, Locon Solutions Private Limited and Square Yards Technology Pvt. Ltd.
Key Companies in the India Proptech Market
- Square Yards Technology Pvt. Ltd.
- NoBroker Technologies Solutions Pvt Ltd
- Locon Solutions Private Limited (Housing.com)
- DTwelve Spaces Private Limited (Stanza Living)
- Info Edge (India) Limited (99acres.com)
- Magicbricks Realty Services Limited
- Zolostays Property Solutions Private Limited
- Aurum Proptech Limited
- Home Bazaar Services Pvt Ltd
- RBJ Technologies Pvt Ltd (Foyr)
Company Profiling
The following profiles cover the five leading companies shaping product development and distribution in this market.
NoBroker Technologies Solutions Pvt Ltd: NoBroker operates a brokerage-free property platform spanning rentals, purchases, home loans, legal assistance and home services, while NoBrokerHood extends the business into recurring society management. In 2025, the company commercialized ConvoZen, its conversational AI platform for voice and digital customer interactions. The technology originated within NoBroker's own operations before being expanded into enterprise SaaS use cases.
Info Edge India Limited: Info Edge participates through 99acres, one of India's largest digital property marketplaces for residential and commercial real estate. Its FY2025 disclosures reported more than 956,000 listings and over 181,000 projects, while the platform continues using AI-driven recommendations and pricing tools to improve property discovery. The current 99acres application offers more than four million searchable properties and AI-supported search functionality.
Magicbricks Realty Services Limited: Magicbricks combines consumer property discovery with broker and developer technology. Its READPRO CRM has expanded AI-based lead management, sales tracking and performance analytics across broker operations, complementing Magicbricks' established property-listing business. The company's broader technology strategy increasingly focuses on moving broker workflows from manual lead handling toward structured digital customer management.
Locon Solutions Private Limited: Housing.com provides property discovery, developer services, virtual viewing, home loans and post-transaction digital services across major Indian cities. By 2025, the platform had expanded to 20 Tier-2 cities and 28 cities overall. In July 2026, Aurum Proptech agreed to acquire Housing.com as part of a strategy to build a broader AI-native real estate technology ecosystem.
Square Yards Technology Pvt. Ltd.: Square Yards operates across property transactions, financing, data intelligence and property management. FY2026 revenue reached approximately USD 223 million, while its Data Intelligence platform covers millions of registered property transactions. In July 2026, Square Yards also launched conversational property search through ChatGPT and partnered with IIM Bangalore to develop a national property-price index using large-scale transaction data.
Recent Developments in the India Proptech Market
- September 2026: The Department of Land Resources moved into DILRMP 3.0 for 2026 to 2031, continuing national efforts to integrate land records, spatial maps and registration infrastructure. This should gradually improve the underlying data environment on which digital title verification and property intelligence depend.
- July 2026: Aurum Proptech agreed to acquire Housing.com, with the buyer positioning the transaction as part of a broader plan to create an AI-native real estate operating ecosystem.
- July 2026: Square Yards partnered with IIM Bangalore to develop a national residential Property Price Index using registration records, transaction data and RERA information, strengthening the industry's shift toward data-backed property intelligence.
Frequently Asked Questions
Related Report
- Market Segmentation
- Research Scope
- Research Methodology
- Definitions and Assumptions
- Executive Summary
- India Proptech Market Policies, Regulations, and Standards
- India Proptech Market Dynamics
- Growth Factors
- Challenges
- Trends
- Opportunities
- India Proptech Market Statistics, 2023-2033F
- Market Size & Growth Outlook
- By Revenues in USD Million
- Market Segmentation & Growth Outlook
- By Property Type
- Residential- Market Insights and Forecast 2023-2033, USD Million
- Commercial- Market Insights and Forecast 2023-2033, USD Million
- Industrial & Logistics- Market Insights and Forecast 2023-2033, USD Million
- Hospitality- Market Insights and Forecast 2023-2033, USD Million
- By Solution
- Software- Market Insights and Forecast 2023-2033, USD Million
- Services- Market Insights and Forecast 2023-2033, USD Million
- By Deployment
- Cloud- Market Insights and Forecast 2023-2033, USD Million
- On-Premise- Market Insights and Forecast 2023-2033, USD Million
- By End User
- Property Owners & Developers- Market Insights and Forecast 2023-2033, USD Million
- Real Estate Agents & Brokerages- Market Insights and Forecast 2023-2033, USD Million
- Facility & Property Managers- Market Insights and Forecast 2023-2033, USD Million
- Property Investors & REITs- Market Insights and Forecast 2023-2033, USD Million
- By Technology
- IoT & Smart Sensor Networks- Market Insights and Forecast 2023-2033, USD Million
- AI & Big Data Analytics- Market Insights and Forecast 2023-2033, USD Million
- AR, VR & Digital Twins- Market Insights and Forecast 2023-2033, USD Million
- Blockchain & Distributed Ledger Technology- Market Insights and Forecast 2023-2033, USD Million
- By Competitors
- Competition Characteristics
- Market Share & Analysis
- By Property Type
- Market Size & Growth Outlook
- India Residential Proptech Market Statistics, 2023-2033
- Market Size & Growth Outlook
- By Revenues in USD Million
- Market Segmentation & Growth Outlook
- By Solution- Market Insights and Forecast 2023-2033, USD Million
- By Deployment- Market Insights and Forecast 2023-2033, USD Million
- By End User- Market Insights and Forecast 2023-2033, USD Million
- By Technology- Market Insights and Forecast 2023-2033, USD Million
- Market Size & Growth Outlook
- India Commercial Proptech Market Statistics, 2023-2033
- Market Size & Growth Outlook
- By Revenues in USD Million
- Market Segmentation & Growth Outlook
- By Solution- Market Insights and Forecast 2023-2033, USD Million
- By Deployment- Market Insights and Forecast 2023-2033, USD Million
- By End User- Market Insights and Forecast 2023-2033, USD Million
- By Technology- Market Insights and Forecast 2023-2033, USD Million
- Market Size & Growth Outlook
- India Industrial & Logistics Proptech Market Statistics, 2023-2033
- Market Size & Growth Outlook
- By Revenues in USD Million
- Market Segmentation & Growth Outlook
- By Solution- Market Insights and Forecast 2023-2033, USD Million
- By Deployment- Market Insights and Forecast 2023-2033, USD Million
- By End User- Market Insights and Forecast 2023-2033, USD Million
- By Technology- Market Insights and Forecast 2023-2033, USD Million
- Market Size & Growth Outlook
- India Hospitality Proptech Market Statistics, 2023-2033
- Market Size & Growth Outlook
- By Revenues in USD Million
- Market Segmentation & Growth Outlook
- By Solution- Market Insights and Forecast 2023-2033, USD Million
- By Deployment- Market Insights and Forecast 2023-2033, USD Million
- By End User- Market Insights and Forecast 2023-2033, USD Million
- By Technology- Market Insights and Forecast 2023-2033, USD Million
- Market Size & Growth Outlook
- Competitive Outlook
- Company Profiles
- Square Yards Technology Pvt. Ltd.
- Business Description
- Product Portfolio
- Collaborations & Alliances
- Recent Developments
- Financial Details
- Others
- NoBroker Technologies Solutions Pvt Ltd
- Business Description
- Product Portfolio
- Collaborations & Alliances
- Recent Developments
- Financial Details
- Others
- Locon Solutions Private Limited (Housing.com)
- Business Description
- Product Portfolio
- Collaborations & Alliances
- Recent Developments
- Financial Details
- Others
- DTwelve Spaces Private Limited (Stanza Living)
- Business Description
- Product Portfolio
- Collaborations & Alliances
- Recent Developments
- Financial Details
- Others
- Info Edge (India) Limited (99acres.com)
- Business Description
- Product Portfolio
- Collaborations & Alliances
- Recent Developments
- Financial Details
- Others
- Magicbricks Realty Services Limited
- Business Description
- Product Portfolio
- Collaborations & Alliances
- Recent Developments
- Financial Details
- Others
- Zolostays Property Solutions Private Limited
- Business Description
- Product Portfolio
- Collaborations & Alliances
- Recent Developments
- Financial Details
- Others
- Aurum PropTech Limited
- Business Description
- Product Portfolio
- Collaborations & Alliances
- Recent Developments
- Financial Details
- Others
- Home Bazaar Services Pvt Ltd
- Business Description
- Product Portfolio
- Collaborations & Alliances
- Recent Developments
- Financial Details
- Others
- RBJ Technologies Pvt Ltd (Foyr)
- Business Description
- Product Portfolio
- Collaborations & Alliances
- Recent Developments
- Financial Details
- Others
- Square Yards Technology Pvt. Ltd.
- Company Profiles
- Disclaimer
| Segment | Sub-Segment |
|---|---|
| By Property Type |
|
| By Solution |
|
| By Deployment |
|
| By End User |
|
| By Technology |
|
Research Methodology
This study followed a structured approach comprising four key phases to assess the size and scope of the electro-oxidation market. The process began with thorough secondary research to collect data on the target market, related markets, and broader industry context. These findings, along with preliminary assumptions and estimates, were then validated through extensive primary research involving industry experts from across the value chain. To calculate the overall market size, both top-down and bottom-up methodologies were employed. Finally, market segmentation and data triangulation techniques were applied to refine and validate segment-level estimations.
Secondary Research
The secondary research phase involved gathering data from a wide range of credible and published sources. This step helped in identifying industry trends, defining market segmentation, and understanding the market landscape and value chain.
Sources consulted during this phase included:
- Company annual reports, investor presentations, and press releases
- Industry white papers and certified publications
- Trade directories and market-recognized databases
- Articles from authoritative authors and reputable journals
- Gold and silver standard websites
Secondary research was critical in mapping out the industry's value chain and monetary flow, identifying key market segments, understanding regional variations, and tracking significant industry developments.
Other key sources:
- Financial disclosures
- Industry associations and trade bodies
- News outlets and business magazines
- Academic journals and research studies
- Paid industry databases
Primary Research
To validate secondary data and gain deeper market insights, primary research was conducted with key stakeholders across both the supply and demand sides of the market.
On the demand side, participants included decision-makers and influencers from end-user industries—such as CIOs, CTOs, and CSOs—who provided first-hand perspectives on market needs, product usage, and future expectations.
On the supply side, interviews were conducted with manufacturers, industry associations, and institutional participants to gather insights into current offerings, product pipelines, and market challenges.
Primary interviews provided critical inputs such as:
- Market size and revenue data
- Product and service breakdowns
- Market forecasts
- Regional and application-specific trends
Stakeholders consulted included:
- Leading OEM and solution providers
- Channel and distribution partners
- End users across various applications
- Independent consultants and industry specialists
Market Size Estimation and Data Triangulation
- Identifying Key Market Participants (Secondary Research)
- Goal: To identify the major players or companies in the target market. This typically involves using publicly available data sources such as industry reports, market research publications, and financial statements of companies.
- Tools: Reports from firms like Gartner, Forrester, Euromonitor, Statista, IBISWorld, and others. Public financial statements, news articles, and press releases from top market players.
- Extracting Earnings of Key Market Participants
- Goal: To estimate the earnings generated from the product or service being analyzed. This step helps in understanding the revenue potential of each market player in a specific geography.
- Methods: Earnings data can be gathered from:
- Publicly available financial reports (for listed companies).
- Interviews and primary data sources from professionals, such as Directors, VPs, SVPs, etc. This is especially useful for understanding more nuanced, internal data that isn't publicly disclosed.
- Annual reports and investor presentations of key players.
- Data Collation and Development of a Relevant Data Model
- Goal: To collate inputs from both primary and secondary sources into a structured, data-driven model for market estimation. This model will incorporate key market KPIs and any independent variables relevant to the market.
- Key KPIs: These could include:
- Market size, growth rate, and demand drivers.
- Industry-specific metrics like market share, average revenue per customer (ARPC), or average deal size.
- External variables, such as economic growth rates, inflation rates, or commodity prices, that could affect the market.
- Data Modeling: Based on this data, the market forecasts are developed for the next 5 years. A combination of trend analysis, scenario modeling, and statistical regression might be used to generate projections.
- Scenario Analysis
- Goal: To test different assumptions and validate how sensitive the market is to changes in key variables (e.g., market demand, regulatory changes, technological disruptions).
- Types of Scenarios:
- Base Case: Based on current assumptions and historical data.
- Best-Case Scenario: Assuming favorable market conditions, regulatory environments, and technological advancements.
- Worst-Case Scenario: Accounting for adverse factors, such as economic downturns, stricter regulations, or unexpected disruptions.