Global Insurance Analytics Market Report: Trends, Growth and Forecast (2027-2033)
By Component (Tools, Services), By Business Application (Claims Management, Risk Management, Fraud Detection and Prevention, Process Optimization, Customer Management and Personalization), By Deployment Mode (On-Premise, Cloud), By End User (Insurance Companies, Government Agencies, Third-Party Administrators, Brokers and Consultancies), By Insurance Line (Life and Health, Property and Casualty, Auto, Specialty Lines), By Organization Size (Large Enterprises, Small and Medium Enterprises (SMEs)), By Analytics Technique (Descriptive Analytics, Diagnostic Analytics, Predictive Analytics, Prescriptive Analytics), By Delivery Model (Stand-Alone Analytics Platforms, Core-System Embedded Analytics, API / Embedded Analytics), By Data Source (Internal Enterprise Data, External Third-Party Data, IoT and Telematics Data, Open-Banking & Alternative Data), By Region (North America, South America, Europe, Middle East & Africa, Asia Pacific) ... Read more
|
Major Players
|
Insurance Analytics Market Overview
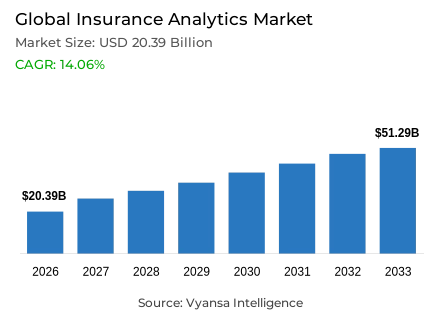
Insurance analytics is the software, models and services that insurers use to price risk, settle claims, detect fraud and manage policyholders. Insurance companies, third-party administrators, brokers, consultancies and government agencies consume it across claims, risk, fraud, process and customer functions. The Insurance Analytics Market is projected to grow at a compound annual growth rate (CAGR) of 14.06% between 2027 and 2033.
Key Highlights of the Insurance Analytics Market
- The Insurance Analytics Market was valued at USD 20.39 billion in 2026 and is estimated at USD 23.29 billion in 2027 and is projected to reach USD 51.29 billion by 2033.
- The market is forecast to expand at a CAGR of 14.06% across the 2027 to 2033 forecast period.
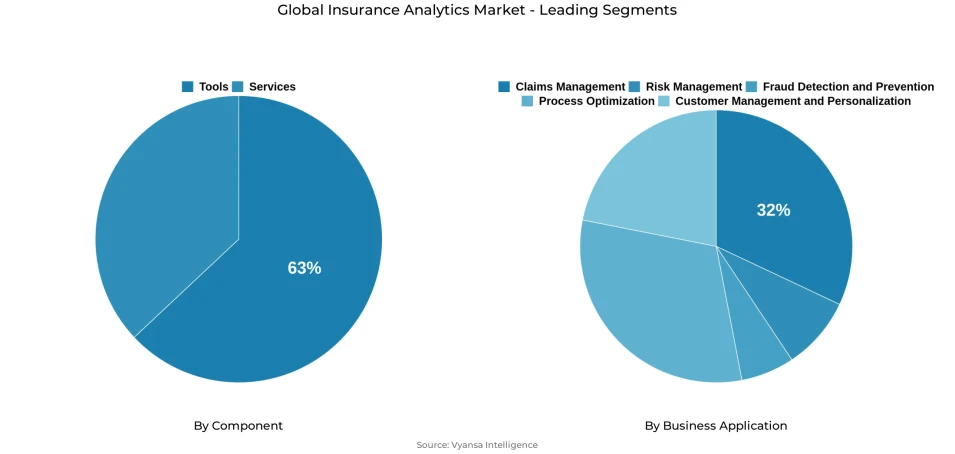
- Under Component, Tools is the leading segment, holding a 63% share of the 2026.
- Under Component, Services is the fastest-growing segment, expanding at a CAGR of 16.03% across the 2027 to 2033 forecast period.
- Under Business Application, Claims Management is the leading segment, holding a 32% share of the 2026.
- Under Business Application, Fraud Detection and Prevention is the fastest-growing segment, expanding at an 18.82% CAGR across the 2027 to 2033.
- North America led the Insurance Analytics Market with 40% market share in 2026.
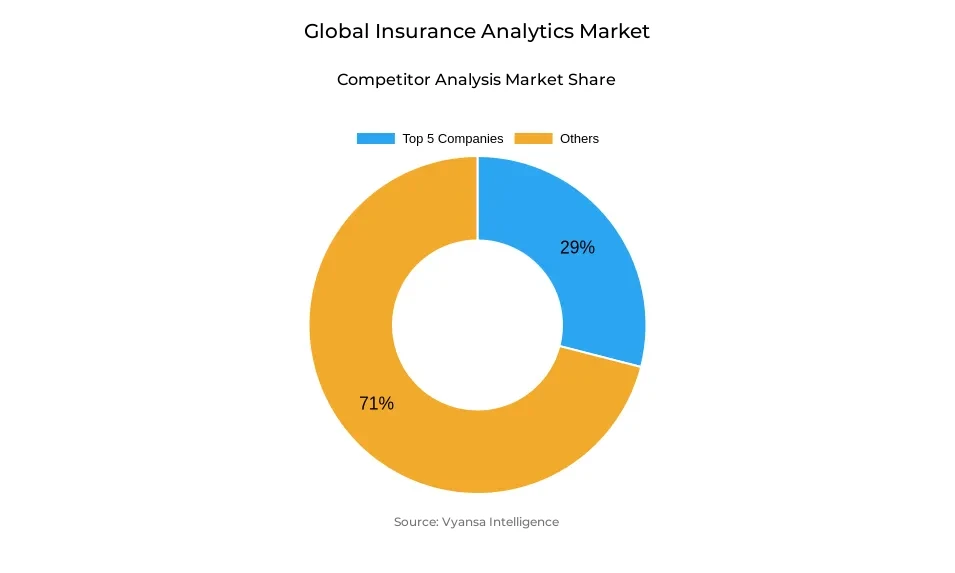
- The market structure is moderately fragmented, with the top five companies together holding a combined 29.00% share in 2026.
Insurance analytics is becoming an operational requirement across the insurance industry as insurers manage slower premium growth alongside increasingly complex risks. Swiss Re Institute forecasts total real insurance premium growth of 1.3% in 2026 and 1.6% in 2027, compared with 3.9% in 2025. With less growth available from premium expansion, insurers have stronger incentives to improve risk selection, pricing accuracy, claims productivity and customer retention through better use of existing data.
Adoption is already moving beyond isolated experiments. An AM Best survey of more than 150 insurers and managing general agents found that 41% were actively using artificial intelligence across core business areas, while nearly 20% considered their implementation advanced. Approximately two-thirds expected to increase artificial intelligence investment during the following 12 to 24 months, primarily to improve productivity, lower operating costs and support underwriting decisions. This creates demand for analytical tools that can operate within established insurance workflows rather than remain separate reporting systems.
Through the forecast period, spending should move toward platforms that combine insurer data, predictive models, workflow automation and model governance. Claims, underwriting, fraud and risk teams will remain the principal users, but purchasing decisions will increasingly involve technology, compliance and operations departments. Suppliers that connect analytics to measurable improvements in handling time, loss control and decision consistency should secure continuing adoption as insurers expand analytics across their operations.
Insurance Analytics Market Drivers
Rising Claims Severity Strengthens Demand for Loss Analytics
Insurers are processing claims affected by more expensive repairs, severe weather events, litigation and longer settlement cycles. These pressures make it more difficult to maintain underwriting margins through pricing alone. Analytics helps carriers identify severe claims earlier, improve reserve estimates, determine whether damaged assets should be repaired or replaced and direct adjusters toward cases requiring closer examination.
Global insured natural catastrophe losses reached USD 107 billion across 190 events in 2025. Secondary perils, including severe convective storms, floods and wildfires, represented 92% of those losses. Swiss Re Institute also estimates that insured catastrophe losses are increasing by 5% to 7% annually in real terms, indicating that claims pressure is becoming a continuing operational condition rather than an occasional disruption.
Pressure is also visible in motor insurance. CCC Intelligent Solutions reported that total-loss frequency reached 23.5% of US auto claims during the first half of 2026. Higher total-loss frequency requires carriers to identify vehicle outcomes earlier, calculate valuations consistently and coordinate salvage, settlement and replacement activities. These requirements directly support spending on claims triage, severity forecasting, catastrophe modelling and automated reserving tools.
Insurance Analytics Market Challenges
Legacy Systems and Fragmented Data Delay Analytics Deployment
Insurance companies frequently store policy, claims, billing and customer information in separate systems developed over several technology cycles. Differences in formats, definitions and data quality make it difficult to build analytical models that work consistently across the organization. Insurers must therefore clean, map and govern their data before moving new models from controlled trials into production workflows.
An industry survey found that the principal barriers to insurance AI adoption were data readiness, cited by 45% of respondents, security and privacy at 43%, and legacy-system integration at 41%. Only 13% were highly confident in their ability to measure returns from AI investment, making it harder for technology teams to justify broader deployment before operational benefits have been demonstrated.
A separate survey of 200 insurance executives found that 95% faced significant challenges with legacy core systems and 73% planned to upgrade their technology within three years. Among those planning changes, 60% preferred replacing individual modules rather than undertaking complete system replacement. This incremental approach supports integration and managed analytics services, but it also lengthens deployment schedules because new tools must continue working with older policy and claims platforms.
Insurance Analytics Market Recent Trends
Cloud Core Platforms Are Integrating Analytics into Daily Insurance Workflows
Insurers are increasingly moving policy and claims systems to cloud platforms where analytical models can operate directly within the workflow. This reduces the need to transfer information into separate analytical applications and allows risk scores, claim recommendations and customer insights to be presented when employees make decisions. Cloud delivery also enables providers to update models and analytical functions more regularly across their customer base.
In January 2026, Vaudoise became the first Swiss insurer to operate on Guidewire Cloud Platform after implementing ClaimCenter and beginning the integration of PolicyCenter. The deployment supports more automated motor-claims processing and demonstrates how analytics adoption can accompany the replacement of an established core insurance system.
In February 2026, Sompo Group entered a long-term agreement supporting the adoption of Guidewire Cloud Platform across its domestic and international operations. The programme includes moving existing applications from on-premises environments and implementing new cloud solutions to strengthen data analysis and decision-making. Such migrations make cloud platforms an important distribution route for insurance analytics, particularly when insurers prefer models that are already integrated with policy, billing and claims records.
Agentic AI is Automating Routine Claims Activities
Claims automation is progressing from individual prediction models toward coordinated artificial intelligence agents that perform several connected tasks. These systems can read claim documents, verify coverage, examine supporting information, calculate payments and refer unusual cases to adjusters. Their practical value is strongest in high-volume claims where the required information and settlement rules can be clearly defined.
Allianz introduced an AI-supported food-spoilage claims solution globally in July 2025 and subsequently piloted it in Australia. The system coordinates several claims activities and has the potential to reduce average processing and settlement times by approximately 80%, allowing qualifying claims to be completed within hours rather than days. Human oversight remains part of the process, particularly where information is incomplete or a claim requires further investigation.
Wider adoption will depend on insurers maintaining complete decision records, restricting agent access to sensitive information and defining when employees must intervene. These requirements favour providers that combine workflow automation with model monitoring, audit trails and human-review controls. Through the forecast period, agentic systems should gain use in claims intake, document classification, coverage checks, fraud screening and payment recommendations.
Insurance Analytics Market Future Opportunities
Embedded Analytics can Expand Insurance Access for Small Businesses
Small businesses represent an opportunity for analytics providers because many require insurance but cannot support lengthy applications and manual underwriting. Risk-scoring models that use business, location, transaction and industry information can help insurers evaluate smaller accounts more efficiently. When these models are delivered through application programming interfaces, insurers can offer cover through accounting, commerce, payroll and industry-specific software platforms.
Hiscox surveyed 6,250 small-business owners across six countries and found that 74% had some level of underinsurance. Around one-third had not reviewed their policies for more than three years, even as their operations and exposures changed. The research also found that 92% were concerned about potential threats to their businesses, including property damage, cyberattacks and workplace incidents.
Analytics providers can address this gap through automated business classification, property assessment, cyber-risk scoring and coverage recommendations. The opportunity is not limited to selling stand-alone software to insurers. Providers can also supply scoring through embedded distribution partners and managing general agents, generating recurring analytical volume each time a policy is quoted, renewed or adjusted. Successful suppliers will need broad data access, models suited to thin business records and integration capabilities that support near-real-time decisions.
Unlock Market Intelligence
Explore the market potential with our data-driven report
Insurance Analytics Market Segmentation Analysis
By Component:
- Tools
- Services
Tools Command 63% of Component Demand as Platforms Sit Under Every Use Case
Tools held an estimated 63% share of the insurance analytics market in 2026. These products include data platforms, predictive models, visualization systems, fraud-detection engines and analytical functions embedded within insurance software. Their leadership reflects the need for a common technology layer across underwriting, claims, risk and customer operations. In April 2026, Duck Creek launched an insurance-specific agentic AI platform supporting governed agents across underwriting and claims workflows, illustrating how analytics capabilities are being added directly to core insurance platforms.
Services are projected to be the fastest-growing component, with a CAGR of 16.03% during 2027–2033. Insurers require consulting, implementation, integration and managed analytics support to connect new models with existing systems and prepare fragmented data for production use. Demand also continues after deployment because models must be monitored, validated and adjusted as claim patterns, pricing conditions and regulatory expectations change. Services therefore gain from both initial modernization projects and the continuing work required to operate analytical systems reliably.
By Business Application:
- Claims Management
- Risk Management
- Fraud Detection and Prevention
- Process Optimization
- Customer Management and Personalization
Claims Management Holds 32% of Application Demand as Handling Cost Drives Analytics Specification
Claims Management held an estimated 32% share of the insurance analytics market in 2026. Claims generate large volumes of documents, images, estimates and payment records, giving insurers several points where analytics can reduce manual work or identify leakage. Applications include claim triage, severity forecasting, reserve estimation, damage assessment and subrogation identification. Verisk highlighted XactAI in its 2025 annual report as an application that embeds generative AI within property-estimating workflows to automate parts of claims processing.
Fraud Detection and Prevention is projected to be the fastest-growing business application, with a CAGR of 18.82% during 2027–2033. Insurers must examine structured claim histories alongside images, documents, identities, payment details and connections between involved parties. Generative AI also makes altered documents and synthetic media easier to produce, increasing the need for image forensics, network analysis and behavioral detection. Fraud analytics can consequently expand across claims, underwriting and payment workflows while supporting faster processing of legitimate cases
Unlock Market Intelligence
Explore the market potential with our data-driven report
Insurance Analytics Market Regional Analysis
North America held an estimated 40% share of the Insurance Analytics Market in 2026. The region combines large insurance operations, established claims-data networks and a broad base of cloud, analytics and core-system providers. Supervisory examination is also becoming more data-intensive. As of March 2026, the National Association of Insurance Commissioners was piloting its AI systems evaluation tool across 12 states to examine insurers’ AI use, governance, risk controls and model inputs. This strengthens demand for model documentation, monitoring and governance functions alongside operational analytics.
Asia Pacific is projected to be the fastest-growing region, with a CAGR of 17.86% during 2027–2033. Insurance expansion and technology modernization are occurring together across several regional markets. Swiss Re forecasts that India’s insurance premiums will grow by 6.9% annually in real terms during 2026–2030, ahead of other major insurance markets. Singapore also issued artificial intelligence risk management guidelines in October 2026, establishing supervisory expectations for financial institutions ahead of their October 2027 effective date. These developments support investment in pricing, distribution, risk and governed AI systems as regional insurance volumes increase.

Insurance Analytics Market Competitive Landscape
The insurance analytics industry is moderately fragmented, with the top five companies holding a combined 29 % share of total revenue in 2026. The five companies are Verisk Analytics Inc. (including brands), RELX PLC (LexisNexis Risk Solutions), Moody's Corporation (including brands), SAS Institute Inc. and International Business Machines Corporation.
Key Companies in the Insurance Analytics Market
- Verisk Analytics Inc.
- RELX PLC
- Moody's Corporation
- SAS Institute Inc.
- International Business Machines Corporation
- CCC Intelligent Solutions Inc.
- Guidewire Software, Inc.
- Accenture PLC
- Capgemini SE
- Cognizant Technology Solutions Corporation
- Microsoft Corporation
- Oracle Corporation
- Salesforce, Inc.
- SAP SE
- Earnix Ltd.
Company Profiling
The following profiles cover the five leading companies shaping product development, distribution and competitive positioning across the insurance analytics industry.
Verisk Analytics Inc.: Verisk Analytics Inc. is headquartered in Jersey City, New Jersey, and provides data, predictive analytics and software to insurers across underwriting, claims, fraud detection and catastrophe-risk management. Its insurance portfolio includes ClaimSearch, Xactware applications and catastrophe-modelling solutions. In September 2026, Verisk launched a new view of US data-centre exposure to help insurers evaluate concentrations of risk created by the expansion of artificial intelligence infrastructure.
RELX PLC: RELX PLC serves the insurance market through LexisNexis Risk Solutions, which combines public, proprietary and insurer-contributed information with analytical models. Its products support identity verification, commercial and personal underwriting, claims investigation and fraud detection. In June 2026, LexisNexis Risk Solutions launched Current Carrier Commercial, allowing participating insurers to access standardised commercial-auto policy, driver and vehicle information during underwriting and coverage verification.
Moody's Corporation: Moody’s Corporation serves insurers and reinsurers through Moody’s RMS, which provides catastrophe, climate and cyber-risk models for underwriting, portfolio management and risk transfer. Its analytics help insurers assess exposure accumulation and estimate losses from low-frequency, high-severity events. In May 2026, Moody’s introduced RMS Cyber Solutions Version 10.0, adding updated cloud-outage modelling and expanded analytical support for technology concentration risk.
SAS Institute Inc.: SAS Institute Inc. is headquartered in Cary, North Carolina, and provides analytical software covering risk, pricing, customer intelligence and fraud investigation. Its insurance portfolio includes SAS Viya and SAS Detection and Investigation for Insurance. In April 2026, SAS expanded Viya with governed AI assistants, agent infrastructure and tools for developing agentic applications, enabling insurers to introduce AI-supported decisions within a controlled analytical environment.
International Business Machines Corporation: International Business Machines Corporation (IBM) provides insurers with cloud, consulting, data-management and artificial intelligence capabilities through IBM Consulting and the watsonx platform. Its solutions support claims processing, underwriting, customer service and model governance. In May 2026, IBM introduced the next generation of watsonx Orchestrate, creating a central control plane through which organisations can deploy and govern AI agents from different sources using consistent policies and accountability controls.
Recent Developments in the Insurance Analytics Market
- September 2026: Cloverleaf Analytics, Inc. introduced Autonomous Analytics, an AI-native platform designed for property and casualty (P&C) insurers. The platform monitors operational performance, investigates performance changes, and generates traceable insights to support faster, data-driven decision-making. Its capabilities include governed metrics, conversational analytics, anomaly detection, evidence traceability, and insurance-specific performance analysis.
- September 2026: Qantev SAS announced a strategic partnership with Verisk to integrate its AI-powered claims platform with health-risk assessment capabilities for insurers across the Asia-Pacific (APAC) and Gulf Cooperation Council (GCC) markets. The collaboration aims to improve underwriting accuracy and claims processing efficiency through AI-driven claims intelligence, risk scoring, medical-condition assessment, fraud detection, and predictive analytics.
- July 2026: Aviva plc initiated a pilot partnership with ONYX Insight to apply AI-driven predictive analytics to wind turbine insurance risk management and asset performance monitoring. The initiative aims to identify potential equipment failures, reduce operational risks, and strengthen insurance risk assessment throughout the asset lifecycle. Key capabilities include predictive maintenance, failure detection, condition monitoring, and data-driven insurance risk analytics.
Frequently Asked Questions
Related Report
- Market Segmentation
- Research Scope
- Research Methodology
- Definitions and Assumptions
- Executive Summary
- Global Insurance Analytics Market Policies, Regulations, and Standards
- Global Insurance Analytics Market Dynamics
- Growth Factors
- Challenges
- Trends
- Opportunities
- Global Insurance Analytics Market Statistics, 2023-2033F
- Market Size & Growth Outlook
- By Revenues in USD Million
- Market Segmentation & Growth Outlook
- By Component
- Tools- Market Insights and Forecast 2023-2033, USD Million
- Services- Market Insights and Forecast 2023-2033, USD Million
- By Business Application
- Claims Management- Market Insights and Forecast 2023-2033, USD Million
- Risk Management- Market Insights and Forecast 2023-2033, USD Million
- Fraud Detection and Prevention- Market Insights and Forecast 2023-2033, USD Million
- Process Optimization- Market Insights and Forecast 2023-2033, USD Million
- Customer Management and Personalization- Market Insights and Forecast 2023-2033, USD Million
- By Deployment Mode
- On-Premise- Market Insights and Forecast 2023-2033, USD Million
- Cloud- Market Insights and Forecast 2023-2033, USD Million
- By End User
- Insurance Companies- Market Insights and Forecast 2023-2033, USD Million
- Government Agencies- Market Insights and Forecast 2023-2033, USD Million
- Third-Party Administrators, Brokers and Consultancies- Market Insights and Forecast 2023-2033, USD Million
- By Insurance Line
- Life and Health- Market Insights and Forecast 2023-2033, USD Million
- Property and Casualty- Market Insights and Forecast 2023-2033, USD Million
- Auto- Market Insights and Forecast 2023-2033, USD Million
- Specialty Lines- Market Insights and Forecast 2023-2033, USD Million
- By Organization Size
- Large Enterprises- Market Insights and Forecast 2023-2033, USD Million
- Small and Medium Enterprises (SMEs)- Market Insights and Forecast 2023-2033, USD Million
- By Analytics Technique
- Descriptive Analytics- Market Insights and Forecast 2023-2033, USD Million
- Diagnostic Analytics- Market Insights and Forecast 2023-2033, USD Million
- Predictive Analytics- Market Insights and Forecast 2023-2033, USD Million
- Prescriptive Analytics- Market Insights and Forecast 2023-2033, USD Million
- By Delivery Model
- Stand-Alone Analytics Platforms- Market Insights and Forecast 2023-2033, USD Million
- Core-System Embedded Analytics- Market Insights and Forecast 2023-2033, USD Million
- API / Embedded Analytics- Market Insights and Forecast 2023-2033, USD Million
- By Data Source
- Internal Enterprise Data- Market Insights and Forecast 2023-2033, USD Million
- External Third-Party Data- Market Insights and Forecast 2023-2033, USD Million
- IoT and Telematics Data- Market Insights and Forecast 2023-2033, USD Million
- Open-Banking & Alternative Data- Market Insights and Forecast 2023-2033, USD Million
- By Region
- North America
- South America
- Europe
- Middle East & Africa
- Asia Pacific
- By Competitors
- Competition Characteristics
- Market Share & Analysis
- By Component
- Market Size & Growth Outlook
- North America Insurance Analytics Market Statistics, 2023-2033F
- Market Size & Growth Outlook
- By Revenues in USD Million
- Market Segmentation & Growth Outlook
- By Component- Market Insights and Forecast 2023-2033, USD Million
- By Business Application- Market Insights and Forecast 2023-2033, USD Million
- By Deployment Mode- Market Insights and Forecast 2023-2033, USD Million
- By End User- Market Insights and Forecast 2023-2033, USD Million
- By Insurance Line- Market Insights and Forecast 2023-2033, USD Million
- By Organization Size- Market Insights and Forecast 2023-2033, USD Million
- By Analytics Technique- Market Insights and Forecast 2023-2033, USD Million
- By Delivery Model- Market Insights and Forecast 2023-2033, USD Million
- By Data Source- Market Insights and Forecast 2023-2033, USD Million
- By Country
- The US
- Canada
- Mexico
- The US Insurance Analytics Market Statistics, 2023-2033F
- Market Size & Growth Outlook
- By Revenues in USD Million
- Market Segmentation & Growth Outlook
- By Component- Market Insights and Forecast 2023-2033, USD Million
- By Business Application- Market Insights and Forecast 2023-2033, USD Million
- By Deployment Mode- Market Insights and Forecast 2023-2033, USD Million
- By End User- Market Insights and Forecast 2023-2033, USD Million
- By Insurance Line- Market Insights and Forecast 2023-2033, USD Million
- By Organization Size- Market Insights and Forecast 2023-2033, USD Million
- By Analytics Technique- Market Insights and Forecast 2023-2033, USD Million
- By Delivery Model- Market Insights and Forecast 2023-2033, USD Million
- By Data Source- Market Insights and Forecast 2023-2033, USD Million
- Market Size & Growth Outlook
- Canada Insurance Analytics Market Statistics, 2023-2033F
- Market Size & Growth Outlook
- By Revenues in USD Million
- Market Segmentation & Growth Outlook
- By Component- Market Insights and Forecast 2023-2033, USD Million
- By Business Application- Market Insights and Forecast 2023-2033, USD Million
- By Deployment Mode- Market Insights and Forecast 2023-2033, USD Million
- By End User- Market Insights and Forecast 2023-2033, USD Million
- By Insurance Line- Market Insights and Forecast 2023-2033, USD Million
- By Organization Size- Market Insights and Forecast 2023-2033, USD Million
- By Analytics Technique- Market Insights and Forecast 2023-2033, USD Million
- By Delivery Model- Market Insights and Forecast 2023-2033, USD Million
- By Data Source- Market Insights and Forecast 2023-2033, USD Million
- Market Size & Growth Outlook
- Mexico Insurance Analytics Market Statistics, 2023-2033F
- Market Size & Growth Outlook
- By Revenues in USD Million
- Market Segmentation & Growth Outlook
- By Component- Market Insights and Forecast 2023-2033, USD Million
- By Business Application- Market Insights and Forecast 2023-2033, USD Million
- By Deployment Mode- Market Insights and Forecast 2023-2033, USD Million
- By End User- Market Insights and Forecast 2023-2033, USD Million
- By Insurance Line- Market Insights and Forecast 2023-2033, USD Million
- By Organization Size- Market Insights and Forecast 2023-2033, USD Million
- By Analytics Technique- Market Insights and Forecast 2023-2033, USD Million
- By Delivery Model- Market Insights and Forecast 2023-2033, USD Million
- By Data Source- Market Insights and Forecast 2023-2033, USD Million
- Market Size & Growth Outlook
- Market Size & Growth Outlook
- South America Insurance Analytics Market Statistics, 2023-2033F
- Market Size & Growth Outlook
- By Revenues in USD Million
- Market Segmentation & Growth Outlook
- By Component- Market Insights and Forecast 2023-2033, USD Million
- By Business Application- Market Insights and Forecast 2023-2033, USD Million
- By Deployment Mode- Market Insights and Forecast 2023-2033, USD Million
- By End User- Market Insights and Forecast 2023-2033, USD Million
- By Insurance Line- Market Insights and Forecast 2023-2033, USD Million
- By Organization Size- Market Insights and Forecast 2023-2033, USD Million
- By Analytics Technique- Market Insights and Forecast 2023-2033, USD Million
- By Delivery Model- Market Insights and Forecast 2023-2033, USD Million
- By Data Source- Market Insights and Forecast 2023-2033, USD Million
- By Country
- Brazil
- Argentina
- Chile
- Rest of South America
- Brazil Insurance Analytics Market Statistics, 2023-2033F
- Market Size & Growth Outlook
- By Revenues in USD Million
- Market Segmentation & Growth Outlook
- By Component- Market Insights and Forecast 2023-2033, USD Million
- By Business Application- Market Insights and Forecast 2023-2033, USD Million
- By Deployment Mode- Market Insights and Forecast 2023-2033, USD Million
- By End User- Market Insights and Forecast 2023-2033, USD Million
- By Insurance Line- Market Insights and Forecast 2023-2033, USD Million
- By Organization Size- Market Insights and Forecast 2023-2033, USD Million
- By Analytics Technique- Market Insights and Forecast 2023-2033, USD Million
- By Delivery Model- Market Insights and Forecast 2023-2033, USD Million
- By Data Source- Market Insights and Forecast 2023-2033, USD Million
- Market Size & Growth Outlook
- Argentina Insurance Analytics Market Statistics, 2023-2033F
- Market Size & Growth Outlook
- By Revenues in USD Million
- Market Segmentation & Growth Outlook
- By Component- Market Insights and Forecast 2023-2033, USD Million
- By Business Application- Market Insights and Forecast 2023-2033, USD Million
- By Deployment Mode- Market Insights and Forecast 2023-2033, USD Million
- By End User- Market Insights and Forecast 2023-2033, USD Million
- By Insurance Line- Market Insights and Forecast 2023-2033, USD Million
- By Organization Size- Market Insights and Forecast 2023-2033, USD Million
- By Analytics Technique- Market Insights and Forecast 2023-2033, USD Million
- By Delivery Model- Market Insights and Forecast 2023-2033, USD Million
- By Data Source- Market Insights and Forecast 2023-2033, USD Million
- Market Size & Growth Outlook
- Chile Insurance Analytics Market Statistics, 2023-2033F
- Market Size & Growth Outlook
- By Revenues in USD Million
- Market Segmentation & Growth Outlook
- By Component- Market Insights and Forecast 2023-2033, USD Million
- By Business Application- Market Insights and Forecast 2023-2033, USD Million
- By Deployment Mode- Market Insights and Forecast 2023-2033, USD Million
- By End User- Market Insights and Forecast 2023-2033, USD Million
- By Insurance Line- Market Insights and Forecast 2023-2033, USD Million
- By Organization Size- Market Insights and Forecast 2023-2033, USD Million
- By Analytics Technique- Market Insights and Forecast 2023-2033, USD Million
- By Delivery Model- Market Insights and Forecast 2023-2033, USD Million
- By Data Source- Market Insights and Forecast 2023-2033, USD Million
- Market Size & Growth Outlook
- Market Size & Growth Outlook
- Europe Insurance Analytics Market Statistics, 2023-2033F
- Market Size & Growth Outlook
- By Revenues in USD Million
- Market Segmentation & Growth Outlook
- By Component- Market Insights and Forecast 2023-2033, USD Million
- By Business Application- Market Insights and Forecast 2023-2033, USD Million
- By Deployment Mode- Market Insights and Forecast 2023-2033, USD Million
- By End User- Market Insights and Forecast 2023-2033, USD Million
- By Insurance Line- Market Insights and Forecast 2023-2033, USD Million
- By Organization Size- Market Insights and Forecast 2023-2033, USD Million
- By Analytics Technique- Market Insights and Forecast 2023-2033, USD Million
- By Delivery Model- Market Insights and Forecast 2023-2033, USD Million
- By Data Source- Market Insights and Forecast 2023-2033, USD Million
- By Country
- Germany
- The UK
- France
- Italy
- Spain
- BENELUX
- Nordics
- Rest of Europe
- Germany Insurance Analytics Market Statistics, 2023-2033F
- Market Size & Growth Outlook
- By Revenues in USD Million
- Market Segmentation & Growth Outlook
- By Component- Market Insights and Forecast 2023-2033, USD Million
- By Business Application- Market Insights and Forecast 2023-2033, USD Million
- By Deployment Mode- Market Insights and Forecast 2023-2033, USD Million
- By End User- Market Insights and Forecast 2023-2033, USD Million
- By Insurance Line- Market Insights and Forecast 2023-2033, USD Million
- By Organization Size- Market Insights and Forecast 2023-2033, USD Million
- By Analytics Technique- Market Insights and Forecast 2023-2033, USD Million
- By Delivery Model- Market Insights and Forecast 2023-2033, USD Million
- By Data Source- Market Insights and Forecast 2023-2033, USD Million
- Market Size & Growth Outlook
- The UK Insurance Analytics Market Statistics, 2023-2033F
- Market Size & Growth Outlook
- By Revenues in USD Million
- Market Segmentation & Growth Outlook
- By Component- Market Insights and Forecast 2023-2033, USD Million
- By Business Application- Market Insights and Forecast 2023-2033, USD Million
- By Deployment Mode- Market Insights and Forecast 2023-2033, USD Million
- By End User- Market Insights and Forecast 2023-2033, USD Million
- By Insurance Line- Market Insights and Forecast 2023-2033, USD Million
- By Organization Size- Market Insights and Forecast 2023-2033, USD Million
- By Analytics Technique- Market Insights and Forecast 2023-2033, USD Million
- By Delivery Model- Market Insights and Forecast 2023-2033, USD Million
- By Data Source- Market Insights and Forecast 2023-2033, USD Million
- Market Size & Growth Outlook
- France Insurance Analytics Market Statistics, 2023-2033F
- Market Size & Growth Outlook
- By Revenues in USD Million
- Market Segmentation & Growth Outlook
- By Component- Market Insights and Forecast 2023-2033, USD Million
- By Business Application- Market Insights and Forecast 2023-2033, USD Million
- By Deployment Mode- Market Insights and Forecast 2023-2033, USD Million
- By End User- Market Insights and Forecast 2023-2033, USD Million
- By Insurance Line- Market Insights and Forecast 2023-2033, USD Million
- By Organization Size- Market Insights and Forecast 2023-2033, USD Million
- By Analytics Technique- Market Insights and Forecast 2023-2033, USD Million
- By Delivery Model- Market Insights and Forecast 2023-2033, USD Million
- By Data Source- Market Insights and Forecast 2023-2033, USD Million
- Market Size & Growth Outlook
- Italy Insurance Analytics Market Statistics, 2023-2033F
- Market Size & Growth Outlook
- By Revenues in USD Million
- Market Segmentation & Growth Outlook
- By Component- Market Insights and Forecast 2023-2033, USD Million
- By Business Application- Market Insights and Forecast 2023-2033, USD Million
- By Deployment Mode- Market Insights and Forecast 2023-2033, USD Million
- By End User- Market Insights and Forecast 2023-2033, USD Million
- By Insurance Line- Market Insights and Forecast 2023-2033, USD Million
- By Organization Size- Market Insights and Forecast 2023-2033, USD Million
- By Analytics Technique- Market Insights and Forecast 2023-2033, USD Million
- By Delivery Model- Market Insights and Forecast 2023-2033, USD Million
- By Data Source- Market Insights and Forecast 2023-2033, USD Million
- Market Size & Growth Outlook
- Spain Insurance Analytics Market Statistics, 2023-2033F
- Market Size & Growth Outlook
- By Revenues in USD Million
- Market Segmentation & Growth Outlook
- By Component- Market Insights and Forecast 2023-2033, USD Million
- By Business Application- Market Insights and Forecast 2023-2033, USD Million
- By Deployment Mode- Market Insights and Forecast 2023-2033, USD Million
- By End User- Market Insights and Forecast 2023-2033, USD Million
- By Insurance Line- Market Insights and Forecast 2023-2033, USD Million
- By Organization Size- Market Insights and Forecast 2023-2033, USD Million
- By Analytics Technique- Market Insights and Forecast 2023-2033, USD Million
- By Delivery Model- Market Insights and Forecast 2023-2033, USD Million
- By Data Source- Market Insights and Forecast 2023-2033, USD Million
- Market Size & Growth Outlook
- BENELUX Insurance Analytics Market Statistics, 2023-2033F
- Market Size & Growth Outlook
- By Revenues in USD Million
- Market Segmentation & Growth Outlook
- By Component- Market Insights and Forecast 2023-2033, USD Million
- By Business Application- Market Insights and Forecast 2023-2033, USD Million
- By Deployment Mode- Market Insights and Forecast 2023-2033, USD Million
- By End User- Market Insights and Forecast 2023-2033, USD Million
- By Insurance Line- Market Insights and Forecast 2023-2033, USD Million
- By Organization Size- Market Insights and Forecast 2023-2033, USD Million
- By Analytics Technique- Market Insights and Forecast 2023-2033, USD Million
- By Delivery Model- Market Insights and Forecast 2023-2033, USD Million
- By Data Source- Market Insights and Forecast 2023-2033, USD Million
- Market Size & Growth Outlook
- Nordics Insurance Analytics Market Statistics, 2023-2033F
- Market Size & Growth Outlook
- By Revenues in USD Million
- Market Segmentation & Growth Outlook
- By Component- Market Insights and Forecast 2023-2033, USD Million
- By Business Application- Market Insights and Forecast 2023-2033, USD Million
- By Deployment Mode- Market Insights and Forecast 2023-2033, USD Million
- By End User- Market Insights and Forecast 2023-2033, USD Million
- By Insurance Line- Market Insights and Forecast 2023-2033, USD Million
- By Organization Size- Market Insights and Forecast 2023-2033, USD Million
- By Analytics Technique- Market Insights and Forecast 2023-2033, USD Million
- By Delivery Model- Market Insights and Forecast 2023-2033, USD Million
- By Data Source- Market Insights and Forecast 2023-2033, USD Million
- Market Size & Growth Outlook
- Market Size & Growth Outlook
- Middle East & Africa Insurance Analytics Market Statistics, 2023-2033F
- Market Size & Growth Outlook
- By Revenues in USD Million
- Market Segmentation & Growth Outlook
- By Component- Market Insights and Forecast 2023-2033, USD Million
- By Business Application- Market Insights and Forecast 2023-2033, USD Million
- By Deployment Mode- Market Insights and Forecast 2023-2033, USD Million
- By End User- Market Insights and Forecast 2023-2033, USD Million
- By Insurance Line- Market Insights and Forecast 2023-2033, USD Million
- By Organization Size- Market Insights and Forecast 2023-2033, USD Million
- By Analytics Technique- Market Insights and Forecast 2023-2033, USD Million
- By Delivery Model- Market Insights and Forecast 2023-2033, USD Million
- By Data Source- Market Insights and Forecast 2023-2033, USD Million
- By Country
- UAE
- Saudi Arabia
- South Africa
- Turkey
- Rest of Middle East & Africa
- UAE Insurance Analytics Market Statistics, 2023-2033F
- Market Size & Growth Outlook
- By Revenues in USD Million
- Market Segmentation & Growth Outlook
- By Component- Market Insights and Forecast 2023-2033, USD Million
- By Business Application- Market Insights and Forecast 2023-2033, USD Million
- By Deployment Mode- Market Insights and Forecast 2023-2033, USD Million
- By End User- Market Insights and Forecast 2023-2033, USD Million
- By Insurance Line- Market Insights and Forecast 2023-2033, USD Million
- By Organization Size- Market Insights and Forecast 2023-2033, USD Million
- By Analytics Technique- Market Insights and Forecast 2023-2033, USD Million
- By Delivery Model- Market Insights and Forecast 2023-2033, USD Million
- By Data Source- Market Insights and Forecast 2023-2033, USD Million
- Market Size & Growth Outlook
- Saudi Arabia Insurance Analytics Market Statistics, 2023-2033F
- Market Size & Growth Outlook
- By Revenues in USD Million
- Market Segmentation & Growth Outlook
- By Component- Market Insights and Forecast 2023-2033, USD Million
- By Business Application- Market Insights and Forecast 2023-2033, USD Million
- By Deployment Mode- Market Insights and Forecast 2023-2033, USD Million
- By End User- Market Insights and Forecast 2023-2033, USD Million
- By Insurance Line- Market Insights and Forecast 2023-2033, USD Million
- By Organization Size- Market Insights and Forecast 2023-2033, USD Million
- By Analytics Technique- Market Insights and Forecast 2023-2033, USD Million
- By Delivery Model- Market Insights and Forecast 2023-2033, USD Million
- By Data Source- Market Insights and Forecast 2023-2033, USD Million
- Market Size & Growth Outlook
- South Africa Insurance Analytics Market Statistics, 2023-2033F
- Market Size & Growth Outlook
- By Revenues in USD Million
- Market Segmentation & Growth Outlook
- By Component- Market Insights and Forecast 2023-2033, USD Million
- By Business Application- Market Insights and Forecast 2023-2033, USD Million
- By Deployment Mode- Market Insights and Forecast 2023-2033, USD Million
- By End User- Market Insights and Forecast 2023-2033, USD Million
- By Insurance Line- Market Insights and Forecast 2023-2033, USD Million
- By Organization Size- Market Insights and Forecast 2023-2033, USD Million
- By Analytics Technique- Market Insights and Forecast 2023-2033, USD Million
- By Delivery Model- Market Insights and Forecast 2023-2033, USD Million
- By Data Source- Market Insights and Forecast 2023-2033, USD Million
- Market Size & Growth Outlook
- Turkey Insurance Analytics Market Statistics, 2023-2033F
- Market Size & Growth Outlook
- By Revenues in USD Million
- Market Segmentation & Growth Outlook
- By Component- Market Insights and Forecast 2023-2033, USD Million
- By Business Application- Market Insights and Forecast 2023-2033, USD Million
- By Deployment Mode- Market Insights and Forecast 2023-2033, USD Million
- By End User- Market Insights and Forecast 2023-2033, USD Million
- By Insurance Line- Market Insights and Forecast 2023-2033, USD Million
- By Organization Size- Market Insights and Forecast 2023-2033, USD Million
- By Analytics Technique- Market Insights and Forecast 2023-2033, USD Million
- By Delivery Model- Market Insights and Forecast 2023-2033, USD Million
- By Data Source- Market Insights and Forecast 2023-2033, USD Million
- Market Size & Growth Outlook
- Market Size & Growth Outlook
- Asia Pacific Insurance Analytics Market Statistics, 2023-2033F
- Market Size & Growth Outlook
- By Revenues in USD Million
- Market Segmentation & Growth Outlook
- By Component- Market Insights and Forecast 2023-2033, USD Million
- By Business Application- Market Insights and Forecast 2023-2033, USD Million
- By Deployment Mode- Market Insights and Forecast 2023-2033, USD Million
- By End User- Market Insights and Forecast 2023-2033, USD Million
- By Insurance Line- Market Insights and Forecast 2023-2033, USD Million
- By Organization Size- Market Insights and Forecast 2023-2033, USD Million
- By Analytics Technique- Market Insights and Forecast 2023-2033, USD Million
- By Delivery Model- Market Insights and Forecast 2023-2033, USD Million
- By Data Source- Market Insights and Forecast 2023-2033, USD Million
- By Country
- China
- India
- Japan
- South Korea
- Australia
- Southeast Asia
- Rest of Asia Pacific
- China Insurance Analytics Market Statistics, 2023-2033F
- Market Size & Growth Outlook
- By Revenues in USD Million
- Market Segmentation & Growth Outlook
- By Component- Market Insights and Forecast 2023-2033, USD Million
- By Business Application- Market Insights and Forecast 2023-2033, USD Million
- By Deployment Mode- Market Insights and Forecast 2023-2033, USD Million
- By End User- Market Insights and Forecast 2023-2033, USD Million
- By Insurance Line- Market Insights and Forecast 2023-2033, USD Million
- By Organization Size- Market Insights and Forecast 2023-2033, USD Million
- By Analytics Technique- Market Insights and Forecast 2023-2033, USD Million
- By Delivery Model- Market Insights and Forecast 2023-2033, USD Million
- By Data Source- Market Insights and Forecast 2023-2033, USD Million
- Market Size & Growth Outlook
- India Insurance Analytics Market Statistics, 2023-2033F
- Market Size & Growth Outlook
- By Revenues in USD Million
- Market Segmentation & Growth Outlook
- By Component- Market Insights and Forecast 2023-2033, USD Million
- By Business Application- Market Insights and Forecast 2023-2033, USD Million
- By Deployment Mode- Market Insights and Forecast 2023-2033, USD Million
- By End User- Market Insights and Forecast 2023-2033, USD Million
- By Insurance Line- Market Insights and Forecast 2023-2033, USD Million
- By Organization Size- Market Insights and Forecast 2023-2033, USD Million
- By Analytics Technique- Market Insights and Forecast 2023-2033, USD Million
- By Delivery Model- Market Insights and Forecast 2023-2033, USD Million
- By Data Source- Market Insights and Forecast 2023-2033, USD Million
- Market Size & Growth Outlook
- Japan Insurance Analytics Market Statistics, 2023-2033F
- Market Size & Growth Outlook
- By Revenues in USD Million
- Market Segmentation & Growth Outlook
- By Component- Market Insights and Forecast 2023-2033, USD Million
- By Business Application- Market Insights and Forecast 2023-2033, USD Million
- By Deployment Mode- Market Insights and Forecast 2023-2033, USD Million
- By End User- Market Insights and Forecast 2023-2033, USD Million
- By Insurance Line- Market Insights and Forecast 2023-2033, USD Million
- By Organization Size- Market Insights and Forecast 2023-2033, USD Million
- By Analytics Technique- Market Insights and Forecast 2023-2033, USD Million
- By Delivery Model- Market Insights and Forecast 2023-2033, USD Million
- By Data Source- Market Insights and Forecast 2023-2033, USD Million
- Market Size & Growth Outlook
- South Korea Insurance Analytics Market Statistics, 2023-2033F
- Market Size & Growth Outlook
- By Revenues in USD Million
- Market Segmentation & Growth Outlook
- By Component- Market Insights and Forecast 2023-2033, USD Million
- By Business Application- Market Insights and Forecast 2023-2033, USD Million
- By Deployment Mode- Market Insights and Forecast 2023-2033, USD Million
- By End User- Market Insights and Forecast 2023-2033, USD Million
- By Insurance Line- Market Insights and Forecast 2023-2033, USD Million
- By Organization Size- Market Insights and Forecast 2023-2033, USD Million
- By Analytics Technique- Market Insights and Forecast 2023-2033, USD Million
- By Delivery Model- Market Insights and Forecast 2023-2033, USD Million
- By Data Source- Market Insights and Forecast 2023-2033, USD Million
- Market Size & Growth Outlook
- Australia Insurance Analytics Market Statistics, 2023-2033F
- Market Size & Growth Outlook
- By Revenues in USD Million
- Market Segmentation & Growth Outlook
- By Component- Market Insights and Forecast 2023-2033, USD Million
- By Business Application- Market Insights and Forecast 2023-2033, USD Million
- By Deployment Mode- Market Insights and Forecast 2023-2033, USD Million
- By End User- Market Insights and Forecast 2023-2033, USD Million
- By Insurance Line- Market Insights and Forecast 2023-2033, USD Million
- By Organization Size- Market Insights and Forecast 2023-2033, USD Million
- By Analytics Technique- Market Insights and Forecast 2023-2033, USD Million
- By Delivery Model- Market Insights and Forecast 2023-2033, USD Million
- By Data Source- Market Insights and Forecast 2023-2033, USD Million
- Market Size & Growth Outlook
- Southeast Asia Insurance Analytics Market Statistics, 2023-2033F
- Market Size & Growth Outlook
- By Revenues in USD Million
- Market Segmentation & Growth Outlook
- By Component- Market Insights and Forecast 2023-2033, USD Million
- By Business Application- Market Insights and Forecast 2023-2033, USD Million
- By Deployment Mode- Market Insights and Forecast 2023-2033, USD Million
- By End User- Market Insights and Forecast 2023-2033, USD Million
- By Insurance Line- Market Insights and Forecast 2023-2033, USD Million
- By Organization Size- Market Insights and Forecast 2023-2033, USD Million
- By Analytics Technique- Market Insights and Forecast 2023-2033, USD Million
- By Delivery Model- Market Insights and Forecast 2023-2033, USD Million
- By Data Source- Market Insights and Forecast 2023-2033, USD Million
- Market Size & Growth Outlook
- Market Size & Growth Outlook
- Competitive Outlook
- Company Profiles
- Verisk Analytics Inc.
- Business Description
- Product Portfolio
- Collaborations & Alliances
- Recent Developments
- Financial Details
- Others
- RELX PLC (LexisNexis Risk Solutions)
- Business Description
- Product Portfolio
- Collaborations & Alliances
- Recent Developments
- Financial Details
- Others
- Moody’s Corporation
- Business Description
- Product Portfolio
- Collaborations & Alliances
- Recent Developments
- Financial Details
- Others
- SAS Institute Inc.
- Business Description
- Product Portfolio
- Collaborations & Alliances
- Recent Developments
- Financial Details
- Others
- International Business Machines Corporation
- Business Description
- Product Portfolio
- Collaborations & Alliances
- Recent Developments
- Financial Details
- Others
- CCC Intelligent Solutions Inc.
- Business Description
- Product Portfolio
- Collaborations & Alliances
- Recent Developments
- Financial Details
- Others
- Guidewire Software, Inc.
- Business Description
- Product Portfolio
- Collaborations & Alliances
- Recent Developments
- Financial Details
- Others
- Accenture PLC
- Business Description
- Product Portfolio
- Collaborations & Alliances
- Recent Developments
- Financial Details
- Others
- Capgemini SE
- Business Description
- Product Portfolio
- Collaborations & Alliances
- Recent Developments
- Financial Details
- Others
- Cognizant Technology Solutions Corporation
- Business Description
- Product Portfolio
- Collaborations & Alliances
- Recent Developments
- Financial Details
- Others
- Microsoft Corporation
- Business Description
- Product Portfolio
- Collaborations & Alliances
- Recent Developments
- Financial Details
- Others
- Oracle Corporation
- Business Description
- Product Portfolio
- Collaborations & Alliances
- Recent Developments
- Financial Details
- Others
- Salesforce, Inc.
- Business Description
- Product Portfolio
- Collaborations & Alliances
- Recent Developments
- Financial Details
- Others
- SAP SE
- Business Description
- Product Portfolio
- Collaborations & Alliances
- Recent Developments
- Financial Details
- Others
- Earnix Ltd.
- Business Description
- Product Portfolio
- Collaborations & Alliances
- Recent Developments
- Financial Details
- Others
- Verisk Analytics Inc.
- Company Profiles
- Disclaimer
| Segment | Sub-Segment |
|---|---|
| By Component |
|
| By Business Application |
|
| By Deployment Mode |
|
| By End User |
|
| By Insurance Line |
|
| By Organization Size |
|
| By Analytics Technique |
|
| By Delivery Model |
|
| By Data Source |
|
| By Region |
|
Research Methodology
This study followed a structured approach comprising four key phases to assess the size and scope of the electro-oxidation market. The process began with thorough secondary research to collect data on the target market, related markets, and broader industry context. These findings, along with preliminary assumptions and estimates, were then validated through extensive primary research involving industry experts from across the value chain. To calculate the overall market size, both top-down and bottom-up methodologies were employed. Finally, market segmentation and data triangulation techniques were applied to refine and validate segment-level estimations.
Secondary Research
The secondary research phase involved gathering data from a wide range of credible and published sources. This step helped in identifying industry trends, defining market segmentation, and understanding the market landscape and value chain.
Sources consulted during this phase included:
- Company annual reports, investor presentations, and press releases
- Industry white papers and certified publications
- Trade directories and market-recognized databases
- Articles from authoritative authors and reputable journals
- Gold and silver standard websites
Secondary research was critical in mapping out the industry's value chain and monetary flow, identifying key market segments, understanding regional variations, and tracking significant industry developments.
Other key sources:
- Financial disclosures
- Industry associations and trade bodies
- News outlets and business magazines
- Academic journals and research studies
- Paid industry databases
Primary Research
To validate secondary data and gain deeper market insights, primary research was conducted with key stakeholders across both the supply and demand sides of the market.
On the demand side, participants included decision-makers and influencers from end-user industries—such as CIOs, CTOs, and CSOs—who provided first-hand perspectives on market needs, product usage, and future expectations.
On the supply side, interviews were conducted with manufacturers, industry associations, and institutional participants to gather insights into current offerings, product pipelines, and market challenges.
Primary interviews provided critical inputs such as:
- Market size and revenue data
- Product and service breakdowns
- Market forecasts
- Regional and application-specific trends
Stakeholders consulted included:
- Leading OEM and solution providers
- Channel and distribution partners
- End users across various applications
- Independent consultants and industry specialists
Market Size Estimation and Data Triangulation
- Identifying Key Market Participants (Secondary Research)
- Goal: To identify the major players or companies in the target market. This typically involves using publicly available data sources such as industry reports, market research publications, and financial statements of companies.
- Tools: Reports from firms like Gartner, Forrester, Euromonitor, Statista, IBISWorld, and others. Public financial statements, news articles, and press releases from top market players.
- Extracting Earnings of Key Market Participants
- Goal: To estimate the earnings generated from the product or service being analyzed. This step helps in understanding the revenue potential of each market player in a specific geography.
- Methods: Earnings data can be gathered from:
- Publicly available financial reports (for listed companies).
- Interviews and primary data sources from professionals, such as Directors, VPs, SVPs, etc. This is especially useful for understanding more nuanced, internal data that isn't publicly disclosed.
- Annual reports and investor presentations of key players.
- Data Collation and Development of a Relevant Data Model
- Goal: To collate inputs from both primary and secondary sources into a structured, data-driven model for market estimation. This model will incorporate key market KPIs and any independent variables relevant to the market.
- Key KPIs: These could include:
- Market size, growth rate, and demand drivers.
- Industry-specific metrics like market share, average revenue per customer (ARPC), or average deal size.
- External variables, such as economic growth rates, inflation rates, or commodity prices, that could affect the market.
- Data Modeling: Based on this data, the market forecasts are developed for the next 5 years. A combination of trend analysis, scenario modeling, and statistical regression might be used to generate projections.
- Scenario Analysis
- Goal: To test different assumptions and validate how sensitive the market is to changes in key variables (e.g., market demand, regulatory changes, technological disruptions).
- Types of Scenarios:
- Base Case: Based on current assumptions and historical data.
- Best-Case Scenario: Assuming favorable market conditions, regulatory environments, and technological advancements.
- Worst-Case Scenario: Accounting for adverse factors, such as economic downturns, stricter regulations, or unexpected disruptions.