Brazil Food Tech Market Report: Trends, Growth and Forecast (2027-2033)
By Component (Hardware, Software, Services), By Application (Food Science & Product Innovation, Kitchen & Restaurant Technology, Food Delivery & Ordering, Supply Chain & Traceability, Others), By Industry (Fish, Meat & Seafood, Fruits & Vegetables, Grains & Oils, Dairy Products, Beverages, Bakery & Confectionery, Other Food Industries), By Region (North, Center-West, Northeast, Southeast, South) ... Read more
|
Major Players
|
Brazil Food Tech Market Overview
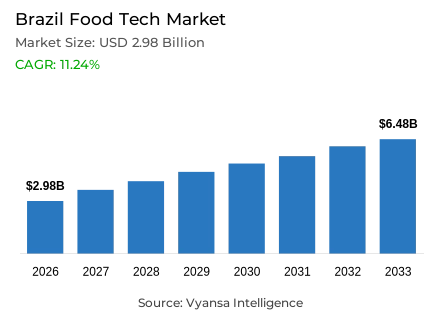
Food tech in Brazil is the technology layer connecting restaurant ordering, grocery replenishment, delivery logistics and merchant payments through a single digital platform. Households, independent restaurants, dairy and beverage producers and quick-commerce operators use it to order, fulfil, pay for and finance everyday food consumption. The Brazil food tech market is projected to grow at a CAGR of 11.24% between 2027 and 2033.
Key Highlights of the Brazil Food Tech Market
- The food tech market in Brazil was valued at USD 2.98 billion in 2026, and is estimated at USD 3.42 billion in 2027 and is forecast to reach USD 6.48 billion by 2033.
- The market is forecast to expand at a compound annual growth rate of 11.24% between 2027 and 2033.
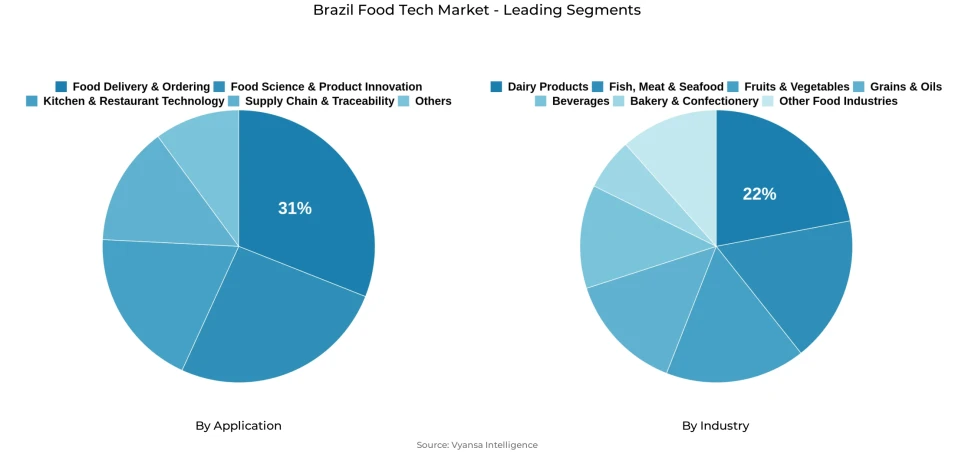
- By application, food delivery and ordering led the market with a 31% share in 2026.
- Supply chain and traceability is the fastest-growing application segment, expanding at a 14.59% CAGR between 2027 and 2033.
- By industry, dairy products led the market with a 22% share in 2026.
- Beverages is the fastest-growing industry vertical, expanding at a 13.65% CAGR between 2027 and 2033.
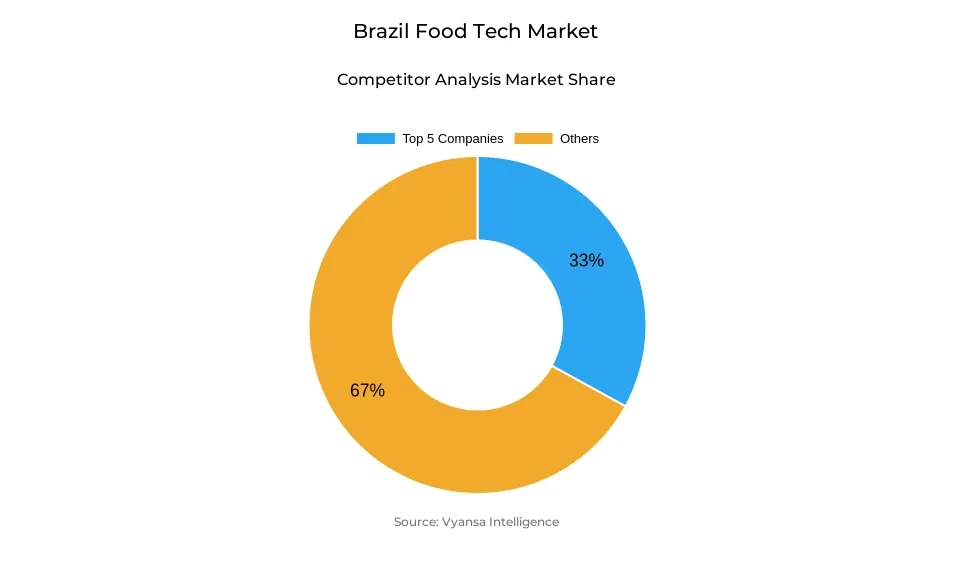
- The market is fragmented, with the top five companies holding a combined 33% share in 2026.
The Brazil's food tech market is evolving from a delivery-focused category into a broader digital operating layer connecting consumers, restaurants, retailers and food businesses. Ordering, payments, merchant software, procurement and fulfilment are increasingly being handled through connected digital systems rather than separate offline processes. This transition is supported by a highly connected consumer base, with internet access reaching 95% of Brazilian households in 2025 and 52.7% of internet users purchasing goods or services online.
The market is also becoming increasingly software-led. Software represented 43.9% of technology inputs across the market in 2026, indicating that restaurant management, ordering, procurement and financial applications already account for a substantial share of industry technology spending. Brazil's established instant-payment infrastructure further supports this digital operating model, with Pix accounting for approximately 42% of national e-commerce transaction value in 2025 and allowing merchants to settle digital transactions rapidly.
Through 2033, food tech should become increasingly embedded in day-to-day merchant operations rather than remaining concentrated around consumer-facing delivery applications. Restaurants, distributors and retailers should use digital platforms across more frequent activities such as inventory planning, payments, procurement and customer management, creating recurring software and transaction revenue.
Brazil Food Tech Market Driver
Embedded Platform Credit Is Expanding Restaurant Operating Capacity
Small and mid-sized restaurants frequently have limited access to conventional working-capital financing because they lack extensive credit histories, collateral or formal financial records. Food-tech platforms can assess restaurant sales, order frequency, platform tenure and transaction behaviour directly, allowing financing decisions to be based on operating activity already visible within the platform. This allows previously underserved restaurants to finance inventory, equipment and expansion while remaining active within the food-tech ecosystem.
By May 2026, iFood Pago had disbursed more than USD 577 million in restaurant credit, and approximately 63% of restaurants receiving financing reported that they had not previously secured credit from another financial institution. Around USD 250 million was disbursed between April and December 2025 alone, demonstrating that embedded financing has already moved beyond small pilot programs into a meaningful merchant-funding channel.
Through 2033, embedded finance can increase food-tech transaction activity by allowing restaurants constrained by working capital to purchase more inventory, maintain longer operating hours and invest in additional capacity. Platforms offering credit alongside payments, ordering and merchant software can also deepen their relationship with restaurants, creating a stronger recurring revenue base than businesses depending exclusively on delivery commissions.
Brazil Food Tech Market Challenge
High Marketplace Costs Are Encouraging Restaurants to Diversify Digital Ordering Channels
Independent restaurants face a high cost when relying heavily on third-party delivery marketplaces because commissions can range from approximately 12% to 27% of order value before additional payment-processing and service fees. These costs are difficult for smaller operators to absorb because foodservice margins are already narrow, making restaurants increasingly selective about how much order volume they route through large marketplace platforms.
Restaurants are therefore adding direct digital channels rather than abandoning online ordering. A 2025 Abrasel survey of 2,176 foodservice establishments found that 63% used WhatsApp for delivery orders and that the channel already represented approximately 26% of delivery revenue. Marketplace applications were still used by 78% of surveyed restaurants, showing that operators are increasingly adopting a multi-channel approach instead of relying exclusively on one intermediary.
Food-tech platforms consequently need to demonstrate value beyond basic customer acquisition. Financing, logistics, payments, loyalty tools and restaurant-management software can make the platform relationship harder to replace with direct ordering alone. This raises the competitive threshold for marketplace providers and increases pressure to generate measurable merchant value rather than depending primarily on commission-based intermediation.
Brazil Food Tech Market Trends
Food Delivery Platforms Are Expanding into Multi-Category Commerce Ecosystems
Brazilian delivery platforms are increasingly broadening their role beyond restaurant meals into groceries, pharmacies, convenience products, pet supplies and other everyday retail categories. This changes the platform model from an application opened primarily around meal occasions into a higher-frequency commerce channel serving multiple household needs. Shared logistics, payments and customer-acquisition infrastructure allow additional categories to be added without recreating the operating network from the beginning.
Rappi illustrates this transition. By September 2026, restaurants represented only around 10% of the company's Brazilian business, while supermarkets, pharmacies, pet supplies, electronics and other retail categories generated most activity. The company was operating 40 dark stores in Brazil to support rapid fulfilment, demonstrating how food-delivery infrastructure is being repurposed for a much wider quick-commerce model.
This broader category mix can increase customer frequency because users no longer need to wait for a restaurant-ordering occasion before interacting with the platform. Through 2033, food-tech providers should increasingly compete on the breadth of products, fulfilment speed and merchant services they can combine within one ecosystem rather than only on restaurant coverage.
Commerce-Specific AI Is Improving Food Discovery and Conversion
Artificial intelligence is becoming more specialized around commerce behaviour rather than functioning only as a generic chatbot or analytical tool. Food-tech platforms can use order history, searches, clicks and transaction patterns to predict what individual customers are likely to purchase, helping platforms improve restaurant ranking, product discovery and personalised recommendations during the ordering process.
Prosus developed its Large Commerce Model initially with iFood using billions of shopping and transaction interactions. The system serves approximately 20 million users and processes more than 200 billion data tokens daily. Prosus reported that personalised "you may also like" recommendations increased conversion by 66%, demonstrating that AI is beginning to influence measurable transaction outcomes rather than operating only as a back-office efficiency tool.
Through 2033, proprietary behavioural data should become increasingly important to food-tech competition because larger platforms can continuously improve recommendation accuracy using their existing transaction volumes. This can widen the performance gap between data-rich platforms and newer entrants, particularly where better product discovery directly translates into higher conversion, repeat ordering and customer retention.
Brazil Food Tech Market Opportunity
Interior and Mid-Sized Cities Offer Significant Geographic Expansion Potential
Brazil's food-tech activity remains more concentrated in large metropolitan areas, while smaller interior cities often have lower platform penetration and less developed delivery infrastructure. The Southeast accounted for approximately 44.7% of industry revenue in the supplied market model, indicating that a significant portion of current activity remains concentrated around major urban markets rather than being evenly distributed across Brazil's wider city network.
Aiqfome demonstrates that digital food platforms can operate at scale outside the largest metropolitan areas. The company serves more than 6 million consumers and over 30,000 merchant partners across more than 700 cities, using a locally adapted model rather than replicating the dense owned-logistics structure associated with the largest national delivery platforms.
The opportunity lies in adapting merchant acquisition, logistics and service economics to lower-density cities. Platforms able to use local partnerships, lighter delivery networks and regional operating structures can digitize restaurants that remain dependent on telephone or offline ordering while reaching consumers outside the major Southeast metropolitan markets. This creates incremental demand without requiring platforms to compete solely for already highly contested customers in São Paulo and Rio de Janeiro.
Unlock Market Intelligence
Explore the market potential with our data-driven report
Brazil Food Tech Market Segmentation Analysis
By Application:
- Food Delivery & Ordering
- Supply Chain & Traceability
Food Delivery and Ordering Commands 31% of Application Demand
Food Delivery & Ordering accounts for 31% of Brazil food tech market application demand in 2026 because the country already has a large digitally connected restaurant and consumer base. iFood alone processed more than 180 million monthly orders in 2026 through over 500,000 establishments and approximately 600,000 delivery workers, demonstrating the scale of transaction and fulfilment infrastructure supporting this application category.Supply Chain & Traceability accounts for approximately 22% of application demand in 2027 and is the fastest-growing application, expanding at a CAGR of 14.59% during 2027–2033. Its share is expected to reach around 27% by 2033 as food producers, distributors and restaurant suppliers increase the use of digital procurement, origin verification and integrated supply-chain data systems.
The technology base supporting this growth is already developing. Brazil introduced its National Voluntary Traceability Program in November 2025, while restaurant procurement platform Cayena had built approximately 30,000 active restaurant customers by 2026. These developments show traceability and procurement technology scaling independently of consumer delivery platforms and creating a separate growth engine within the food-tech market.
By Industry:
- Dairy Products
- Beverages
Dairy Products Hold 22% of Industry-Vertical Demand
Dairy Products account for 22% of Brazil food tech market industry demand in 2026. Dairy processors use technology across production monitoring, inventory, cold-chain management and quality control, creating a broader technology requirement than food categories where digital adoption is concentrated mainly at the sales or distribution stage. These recurring operational requirements support Dairy Products' leading position through the forecast period.
Beverages account for approximately 17% of industry demand in 2027 and are the fastest-growing vertical, expanding at a CAGR of 13.65% during 2027–2033. Their share is expected to reach around 19.5% by 2033 as beverage producers increasingly digitise retailer and restaurant replenishment rather than relying primarily on periodic field-sales activity.
Ambev's digital distribution ecosystem illustrates the shift. In 2025, BEES interacted with more than 1.3 million purchasers in Brazil, with more than 90% of customers and volumes transacting through the platform and marketplace GMV more than doubling. Zé Delivery also completed more than 66 million orders and reached over 27 million annual active users, demonstrating digital adoption on both the merchant and consumer sides of beverage distribution.
Unlock Market Intelligence
Explore the market potential with our data-driven report
Brazil Food Tech Market Competitive Landscape
The Brazil Food Tech Market is fragmented. The top five companies account for a combined 33% share in 2026. Major companies include iFood.com Agência de Restaurantes Online S.A., FF Tech e Participações LTDA. (Daki), Ambev S.A., Rappi Brasil Intermediação de Negócios LTDA. and Ebazar.com.br LTDA. (Mercado Livre).
Key Companies in the Brazil Food Tech Market
- iFood.com Online Restaurant Agency S.A.
- FF Tech and Holdings Ltd. (Daki)
- Liv Up Food Commerce Ltd.
- Cayena Technology Ltd.
- Aiqfome Ltd.
- Ambev S.A.
- Rappi Brazil Business Intermediation Ltd.
- Ebazar.com.br Ltd. (Mercado Livre)
- Future Farm
- Saipos Software Services Ltd.
Recent Developments in the Brazil Food Tech Market
- August 2026: Shopee entered Brazil's fresh-food segment with a rapid-delivery service targeting fulfilment within four hours, extending competition in time-sensitive online grocery beyond specialist food-delivery platforms.
- March 2026: 99Food had expanded to more than 70 Brazilian cities after returning to the food-delivery market in June 2025, demonstrating the entry of another large mobility platform into restaurant ordering and intensifying competition for merchants and delivery workers.
- January 2026: Keeta continued its Brazilian expansion backed by a planned USD 1 billion investment and set a target of building a network of 100,000 delivery workers by the end of 2026, introducing additional technology-led competition into the national delivery market.
Frequently Asked Questions
Related Report
- Market Segmentation
- Research Scope
- Research Methodology
- Definitions and Assumptions
- Executive Summary
- Brazil Food Tech Market Policies, Regulations, and Standards
- Brazil Food Tech Market Dynamics
- Growth Factors
- Challenges
- Trends
- Opportunities
- Brazil Food Tech Market Statistics, 2023-2033F
- Market Size & Growth Outlook
- By Revenues in USD Million
- Market Segmentation & Growth Outlook
- By Component
- Hardware- Market Insights and Forecast 2023-2033, USD Million
- Software- Market Insights and Forecast 2023-2033, USD Million
- Services- Market Insights and Forecast 2023-2033, USD Million
- By Application
- Food Science & Product Innovation- Market Insights and Forecast 2023-2033, USD Million
- Kitchen & Restaurant Technology- Market Insights and Forecast 2023-2033, USD Million
- Food Delivery & Ordering- Market Insights and Forecast 2023-2033, USD Million
- Supply Chain & Traceability- Market Insights and Forecast 2023-2033, USD Million
- Others- Market Insights and Forecast 2023-2033, USD Million
- By Industry
- Fish, Meat & Seafood- Market Insights and Forecast 2023-2033, USD Million
- Fruits & Vegetables- Market Insights and Forecast 2023-2033, USD Million
- Grains & Oils- Market Insights and Forecast 2023-2033, USD Million
- Dairy Products- Market Insights and Forecast 2023-2033, USD Million
- Beverages- Market Insights and Forecast 2023-2033, USD Million
- Bakery & Confectionery- Market Insights and Forecast 2023-2033, USD Million
- Other Food Industries- Market Insights and Forecast 2023-2033, USD Million
- By Region
- North- Market Insights and Forecast 2023-2033, USD Million
- Center-West- Market Insights and Forecast 2023-2033, USD Million
- Northeast- Market Insights and Forecast 2023-2033, USD Million
- Southeast- Market Insights and Forecast 2023-2033, USD Million
- South- Market Insights and Forecast 2023-2033, USD Million
- By Competitors
- Competition Characteristics
- Market Share & Analysis
- By Component
- Market Size & Growth Outlook
- Brazil Hardware Food Tech Market Statistics, 2023-2033
- Market Size & Growth Outlook
- By Revenues in USD Million
- Market Segmentation & Growth Outlook
- By Application- Market Insights and Forecast 2023-2033, USD Million
- By Industry- Market Insights and Forecast 2023-2033, USD Million
- By Region- Market Insights and Forecast 2023-2033, USD Million
- Market Size & Growth Outlook
- Brazil Software Food Tech Market Statistics, 2023-2033
- Market Size & Growth Outlook
- By Revenues in USD Million
- Market Segmentation & Growth Outlook
- By Application- Market Insights and Forecast 2023-2033, USD Million
- By Industry- Market Insights and Forecast 2023-2033, USD Million
- By Region- Market Insights and Forecast 2023-2033, USD Million
- Market Size & Growth Outlook
- Brazil Services Food Tech Market Statistics, 2023-2033
- Market Size & Growth Outlook
- By Revenues in USD Million
- Market Segmentation & Growth Outlook
- By Application- Market Insights and Forecast 2023-2033, USD Million
- By Industry- Market Insights and Forecast 2023-2033, USD Million
- By Region- Market Insights and Forecast 2023-2033, USD Million
- Market Size & Growth Outlook
- Competitive Outlook
- Company Profiles
- iFood.com Online Restaurant Agency S.A.
- Business Description
- Product Portfolio
- Collaborations & Alliances
- Recent Developments
- Financial Details
- Others
- FF Tech and Holdings Ltd. (Daki)
- Business Description
- Product Portfolio
- Collaborations & Alliances
- Recent Developments
- Financial Details
- Others
- Ambev S.A.
- Business Description
- Product Portfolio
- Collaborations & Alliances
- Recent Developments
- Financial Details
- Others
- Rappi Brazil Business Intermediation Ltd.
- Business Description
- Product Portfolio
- Collaborations & Alliances
- Recent Developments
- Financial Details
- Others
- Ebazar.com.br Ltd. (Mercado Livre)
- Business Description
- Product Portfolio
- Collaborations & Alliances
- Recent Developments
- Financial Details
- Others
- Liv Up Food Commerce Ltd.
- Business Description
- Product Portfolio
- Collaborations & Alliances
- Recent Developments
- Financial Details
- Others
- Cayena Technology Ltd
- Business Description
- Product Portfolio
- Collaborations & Alliances
- Recent Developments
- Financial Details
- Others
- Aiqfome Ltd.
- Business Description
- Product Portfolio
- Collaborations & Alliances
- Recent Developments
- Financial Details
- Others
- Future Farm
- Business Description
- Product Portfolio
- Collaborations & Alliances
- Recent Developments
- Financial Details
- Others
- Saipos Software Services Ltd.
- Business Description
- Product Portfolio
- Collaborations & Alliances
- Recent Developments
- Financial Details
- Others
- iFood.com Online Restaurant Agency S.A.
- Company Profiles
- Disclaimer
| Segment | Sub-Segment |
|---|---|
| By Component |
|
| By Application |
|
| By Industry |
|
| By Region |
|
Research Methodology
This study followed a structured approach comprising four key phases to assess the size and scope of the electro-oxidation market. The process began with thorough secondary research to collect data on the target market, related markets, and broader industry context. These findings, along with preliminary assumptions and estimates, were then validated through extensive primary research involving industry experts from across the value chain. To calculate the overall market size, both top-down and bottom-up methodologies were employed. Finally, market segmentation and data triangulation techniques were applied to refine and validate segment-level estimations.
Secondary Research
The secondary research phase involved gathering data from a wide range of credible and published sources. This step helped in identifying industry trends, defining market segmentation, and understanding the market landscape and value chain.
Sources consulted during this phase included:
- Company annual reports, investor presentations, and press releases
- Industry white papers and certified publications
- Trade directories and market-recognized databases
- Articles from authoritative authors and reputable journals
- Gold and silver standard websites
Secondary research was critical in mapping out the industry's value chain and monetary flow, identifying key market segments, understanding regional variations, and tracking significant industry developments.
Other key sources:
- Financial disclosures
- Industry associations and trade bodies
- News outlets and business magazines
- Academic journals and research studies
- Paid industry databases
Primary Research
To validate secondary data and gain deeper market insights, primary research was conducted with key stakeholders across both the supply and demand sides of the market.
On the demand side, participants included decision-makers and influencers from end-user industries—such as CIOs, CTOs, and CSOs—who provided first-hand perspectives on market needs, product usage, and future expectations.
On the supply side, interviews were conducted with manufacturers, industry associations, and institutional participants to gather insights into current offerings, product pipelines, and market challenges.
Primary interviews provided critical inputs such as:
- Market size and revenue data
- Product and service breakdowns
- Market forecasts
- Regional and application-specific trends
Stakeholders consulted included:
- Leading OEM and solution providers
- Channel and distribution partners
- End users across various applications
- Independent consultants and industry specialists
Market Size Estimation and Data Triangulation
- Identifying Key Market Participants (Secondary Research)
- Goal: To identify the major players or companies in the target market. This typically involves using publicly available data sources such as industry reports, market research publications, and financial statements of companies.
- Tools: Reports from firms like Gartner, Forrester, Euromonitor, Statista, IBISWorld, and others. Public financial statements, news articles, and press releases from top market players.
- Extracting Earnings of Key Market Participants
- Goal: To estimate the earnings generated from the product or service being analyzed. This step helps in understanding the revenue potential of each market player in a specific geography.
- Methods: Earnings data can be gathered from:
- Publicly available financial reports (for listed companies).
- Interviews and primary data sources from professionals, such as Directors, VPs, SVPs, etc. This is especially useful for understanding more nuanced, internal data that isn't publicly disclosed.
- Annual reports and investor presentations of key players.
- Data Collation and Development of a Relevant Data Model
- Goal: To collate inputs from both primary and secondary sources into a structured, data-driven model for market estimation. This model will incorporate key market KPIs and any independent variables relevant to the market.
- Key KPIs: These could include:
- Market size, growth rate, and demand drivers.
- Industry-specific metrics like market share, average revenue per customer (ARPC), or average deal size.
- External variables, such as economic growth rates, inflation rates, or commodity prices, that could affect the market.
- Data Modeling: Based on this data, the market forecasts are developed for the next 5 years. A combination of trend analysis, scenario modeling, and statistical regression might be used to generate projections.
- Scenario Analysis
- Goal: To test different assumptions and validate how sensitive the market is to changes in key variables (e.g., market demand, regulatory changes, technological disruptions).
- Types of Scenarios:
- Base Case: Based on current assumptions and historical data.
- Best-Case Scenario: Assuming favorable market conditions, regulatory environments, and technological advancements.
- Worst-Case Scenario: Accounting for adverse factors, such as economic downturns, stricter regulations, or unexpected disruptions.