Global Methanol Market Report: Trends, Growth and Forecast (2026-2032)
By Feedstock (Natural Gas, Coal, Renewable Feedstocks, Others), By Derivative (Formaldehyde, Acetic Acid, Methanol-to-Olefins (MTO), Methyl Tert-Butyl Ether (MTBE), Dimethyl Ether (DME), Other Derivatives), By Derived Products (Resins, Olefins, Fuel Additives, Solvents, Other Derived Products), By End-Use Industry (Chemicals, Automotive & Transportation, Construction, Marine, Paints & Coatings, Others), By Region (North America, South America, Europe, The Middle East and Africa, Asia Pacific) ... Read more
|
Major Players
|
Methanol Market Overview
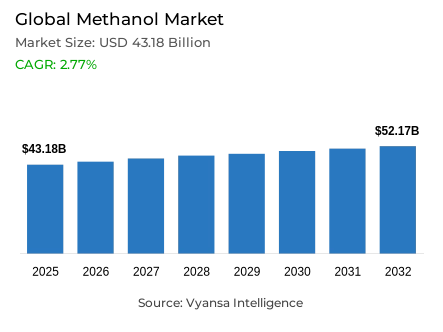
The methanol market covers the production and commercial supply of methanol used as a key feedstock in formaldehyde, acetic acid, olefins, DME, fuel blending, biodiesel, and emerging marine-fuel applications. Market expansion is supported by broad downstream chemical consumption, growing methanol-based shipping adoption, and investment in renewable and lower-carbon production routes. The market is projected to expand steadily during 2026–2032 at a CAGR of 2.77%.
Key Highlights in the Methanol Market
- The methanol market was valued at USD 43.18 billion in 2025 and reached USD 44.29 billion in 2026.
- Revenue is projected to reach USD 52.17 Billion by 2032, showcasing a CAGR of 2.77% during 2026–2032.
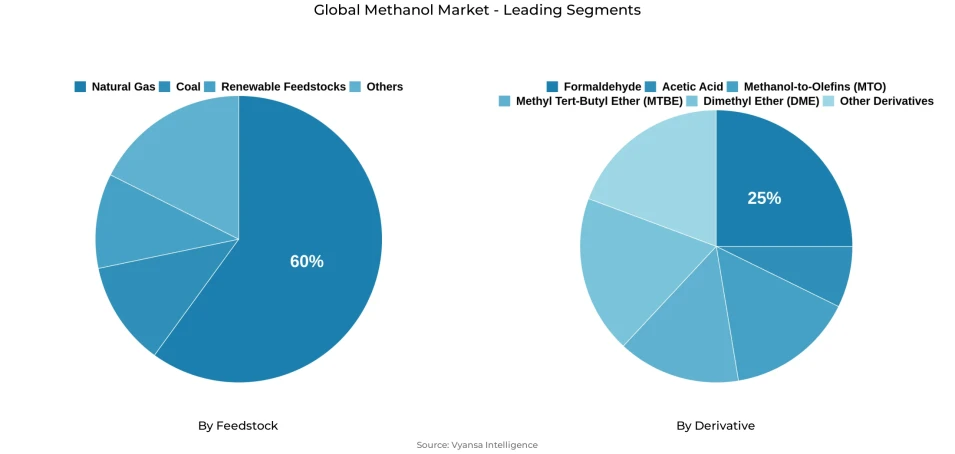
- Natural Gas is the leading feedstock, accounting for 60% of the market in 2026.
- Additionally, renewable feedstocks are the fastest-growing feedstock segment, projected to expand at a CAGR of 23.42% during 2026–2032.
- Formaldehyde is the leading derivative, holding a 25% market share in 2026.
- Furthermore, dimethyl ether (DME) is the fastest-growing derivative, forecast to expand at a CAGR of 6.66% during 2026–2032.
- Asia pacific lead the market with 44% market share in 2026, with Middle East & Africa being the fastest growing region.
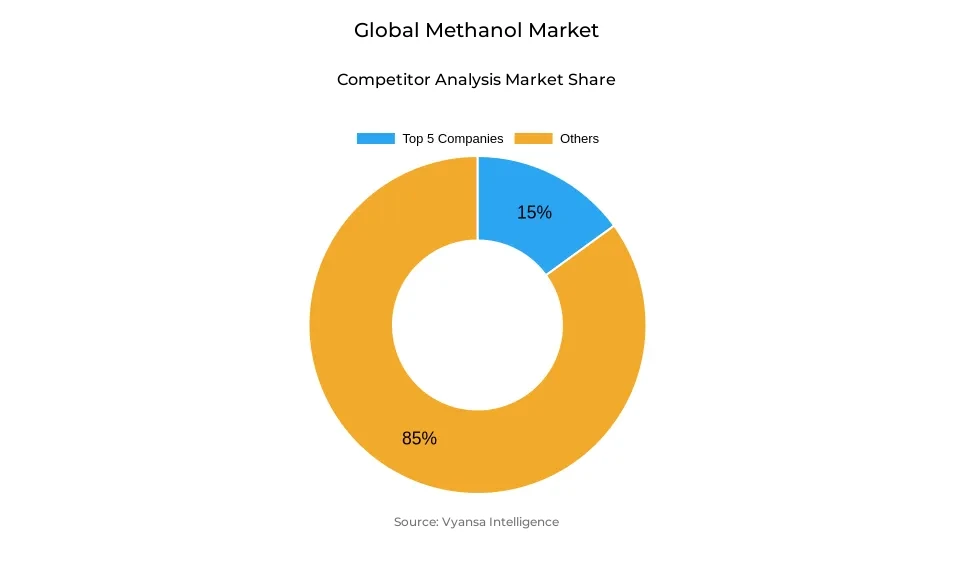
- Competition remains fragmented, with the top five participants accounting for approximately 15% of the methanol market.
Methanol’s broad industrial utility remains a key demand driver because it serves as a feedstock for several high-volume chemical products. Formaldehyde production alone consumed approximately 25% of global methanol demand in 2025, supporting applications in engineered wood, resins, adhesives, coatings, and construction materials. Acetic acid production represented a further 10%, linking methanol demand to plastics, paints, textiles, solvents, and pharmaceuticals.
The expansion of methanol-to-olefins (MTO) technology is another important demand factor, particularly because methanol can be converted into ethylene and propylene used to manufacture polyethylene and polypropylene. Between 2020 and 2024, MTO applications contributed approximately 2.5 million tonnes per year of incremental methanol demand, demonstrating the importance of downstream petrochemical conversion.
Methanol’s use as a transportation and marine fuel is also increasing. In China, vehicular applications already consume more than 1.3 million tonnes of methanol annually, while global demand for methanol used in DME and biodiesel exceeded 7 million tonnes in 2025.
Finally, methanol is gaining attention in low-carbon energy applications, including marine fuels and direct-methanol fuel cells, because renewable methanol can substantially reduce lifecycle greenhouse-gas emissions compared with fossil-based alternatives.
Government Regulations and Trade Policies Shaping the Methanol Market
Government regulations are increasingly influencing the carbon credentials, fuel eligibility, and international tradeability of methanol. In India, the Ministry of New and Renewable Energy notified the Green Methanol Standard on February 27, 2026, establishing a maximum non-biogenic greenhouse-gas emission threshold of 0.44 kg CO₂e per kg of methanol. The standard also establishes eligibility requirements for green methanol and provides for carbon dioxide from biogenic sources, direct air capture, or existing industrial sources.
Singapore is simultaneously establishing a regulated framework for methanol marine-fuel supply. From January 1, 2026, three companies received methanol bunkering licences valid through December 2030, with requirements covering supply reliability, safety, operational readiness, sustainability certification, and emissions tracking. Singapore also specifies a 95 gCO₂e/MJ well-to-wake carbon-intensity limit, with a 5 gCO₂e/MJ transport variance.
In Europe, FuelEU Maritime, fully applicable from January 2025, requires ships above 5,000 gross tonnage calling at EU ports to reduce energy GHG intensity by 2% in 2025, increasing progressively to 80% by 2050. This strengthens the case for compliant low-carbon methanol in marine applications.
Meanwhile, expanded U.S. sanctions on Iranian petroleum and petrochemical networks during 2025 increased counterparty, payment, and market-access risks for suppliers connected to Iran.
Overall, these measures increasingly favor methanol producers with verifiable carbon performance, certified supply chains, compliant bunkering infrastructure, and diversified export channels.
Methanol Market Drivers
Expansion of Methanol-Capable Shipping Is Creating Recurring Marine-Fuel Demand
Marine decarbonisation is converting methanol from a mainly chemical feedstock into a recurring bunker-fuel requirement. Ship owners can use methanol in dual-fuel engines while retaining conventional fuel flexibility, reducing technology-transition risk and supporting staged fleet adoption. This creates demand not only for fuel molecules but also for storage, handling, certification, and port supply. For the methanol market, each additional methanol-capable vessel expands a durable operational consumption base tied to vessel operations rather than one-off project installation or commissioning and replacement cycles.
DNV reported in 2025 that methanol dual-fuel vessels operating or on order exceeded 450 globally and that these engines had accumulated more than 600,000 operating hours. That operating history lowers perceived reliability risk for fleet owners and supports larger procurement commitments from bunker suppliers. As vessel deliveries move from order books into service, the Methanol Industry gains repeat fuel demand across trading routes, giving producers stronger incentives to secure marine-grade supply, terminal access, and long-term customer offtake agreements across ports.
Methanol Market Restraints
Natural-Gas Availability and Infrastructure Disruptions Expose Producers to Supply Volatility
Feedstock exposure remains a structural restraint because conventional methanol economics depend heavily on reliable natural-gas access and plant utilization. Producers facing constrained gas allocation can lose operating leverage quickly, while unplanned pipeline or upstream disruptions can remove saleable tonnes from merchant markets. The problem is most acute at large integrated sites where fixed costs continue even when gas availability falls. In the methanol industry, this makes feedstock contracting, geographic diversification, and maintenance reliability central to sustained commercial margin protection.
Methanex reported that a third-party pipeline failure in Chile reduced fourth-quarter 2025 production by about 75,000 tonnes, while Trinidad gas-supply contracts were being renegotiated through 2025–2026. These events show how physical infrastructure and upstream allocation can tighten supply independently of end-market demand. For the Methanol Market, interruptions can raise replacement-cargo costs, weaken contractual reliability, and intensify regional price volatility, especially where buyers depend on a limited number of export-oriented production hubs for prompt merchant replacement volumes across international markets.
Methanol Market Recent Trends
Long-Term Green-Methanol Offtake Is Replacing Pilot-Scale Procurement
Large shipping customers are moving from trial purchases toward multi-year green-methanol offtake, changing how new capacity is financed and marketed. Unlike spot chemical demand, contracted marine demand gives project developers clearer visibility on volumes, sustainability specifications, and delivery locations before plants reach full production. This buyer-led shift supports dedicated renewable supply chains and encourages producers to align capacity with vessel deployment schedules. The methanol market is therefore seeing procurement commitments become an investment signal for low-carbon production projects worldwide.
At Hong Kong Maritime Week in November 2025, Maersk said deliveries under its long-term agreement with Goldwind were expected to begin in 2026, covering 500,000 tonnes per year of bio-methanol and synthetic methanol from northeast China. The commitment demonstrates how a major carrier can anchor renewable output before broad fuel-market maturity. For the Methanol Industry, similar contracts can improve project bankability, accelerate route-to-market planning, and intensify competition for certified molecules with dependable maritime logistics and verifiable emissions traceability systems.
Captured Industrial CO2 Is Emerging as a Methanol Feedstock
Carbon capture and utilization is moving methanol production beyond conventional fossil syngas by converting industrial CO2 streams with green hydrogen into finished product. This approach can turn emissions at existing power or industrial sites into a chemical feedstock while creating a pathway to lower-carbon methanol without relying exclusively on biogenic carbon. For the methanol industry, the commercial value lies in integrating capture, hydrogen, and synthesis at one site, potentially reducing transport needs and broadening commercially eligible carbon feedstock sources globally.
NTPC’s Vindhyachal project was completed by 2025 as a 10-tonne-per-day flue-gas CO2-to-methanol plant with a 20-tonne-per-day capture block and 2-tonne-per-day green-hydrogen unit. NTPC states that the system produces ASTM Grade-A green methanol at 99.85% purity. This industrial demonstration gives the Methanol Market a concrete reference for utility-linked production using captured emissions. If replicated at larger scale, such systems could create new producer categories and strengthen differentiation through verified process integration, product purity, operating reliability, and carbon utilization performance advantages.
Methanol Market Future Opportunities
Methanol-to-Jet Opens a New Feedstock Route into Sustainable Aviation Fuel
Methanol-to-jet creates a new addressable outlet beyond methanol’s established chemical, blending, and marine uses by converting methanol into sustainable aviation fuel. The pathway is commercially important because airlines need scalable low-carbon fuel options while many existing SAF routes depend on constrained lipid feedstock. For the methanol market, aviation introduces a buyer base with long procurement horizons, strong decarbonisation pressure, and potential willingness to pay for certified molecules that can meet fuel-quality and lifecycle-emissions requirements across international commercial aviation markets.
In June 2026, Honeywell reported ASTM approval for its methanol-to-jet pathway, while its supporting market reference indicated global SAF production near 40,000 barrels per day in 2025 and a requirement around 400,000 barrels per day by 2035. That tenfold scale gap creates room for new conversion capacity and methanol supply agreements. The Methanol Industry can capture this opportunity through certified low-carbon feedstock, refinery partnerships, technology licensing, and long-term airline or fuel-producer offtake structures that reduce project demand uncertainty risk.
Unlock Market Intelligence
Explore the market potential with our data-driven report
Methanol Market Segmentation Analysis
By Feedstock
- Natural Gas
- Coal
- Renewable feedstock
- Others
Natural Gas Leads While Renewable Feedstock Accelerates
Natural Gas led the feedstock category with a 60% share in 2026, reflecting established reforming infrastructure, large-scale gas availability in export-oriented producing countries, and mature plant economics. Gas-based methanol offers producers proven process reliability, standardized product quality, and broad merchant-market acceptance, supporting high utilization where feedstock contracts remain secure. Within the methanol industry, these advantages keep natural gas ahead of coal and renewable routes, particularly for producers serving international chemical customers that require predictable bulk supply across global regions.
Renewable feedstock is projected to expand fastest at a 23.42% CAGR during 2026–2032 as shipping, aviation, and industrial buyers seek lower-carbon methanol with verifiable lifecycle attributes. Biomass, renewable natural gas, captured carbon, and green hydrogen widen the available production base and support differentiated contracting. Although renewable routes start from a smaller commercial base than natural gas, the methanol industry increasingly values certification, emissions traceability, and long-term offtake, enabling these projects to scale faster than more established conventional feedstock categories globally.
By Derivative
- Formaldehyde
- Acetic Acid
- Methanol-to-Olefins (MTO)
- Methyl Tert-Butyl Ether (MTBE)
- Dimethyl Ether (DME)
- Other Derivatives
Formaldehyde Maintains Scale While DME Gains Incremental Applications
Formaldehyde led the derivative category with a 25% share in 2026 because it remains a core methanol outlet for resins, engineered wood, coatings, construction materials, and industrial intermediates. Producers benefit from established conversion technology, broad downstream manufacturing demand, and regular procurement by formaldehyde plants positioned near chemical and construction clusters. In the Methanol Market, this diversified application base provides more stable consumption than narrower derivative uses and supports formaldehyde’s continued leadership across mature and developing industrial economies across markets.
Dimethyl Ether is forecast to grow fastest at a 6.66% CAGR from 2026–2032 as interest expands in cleaner-burning fuel applications, LPG blending, aerosol propellants, and alternative energy uses. DME can be produced from methanol through established dehydration routes, allowing methanol suppliers to access additional fuel and industrial customers without changing the upstream molecule. Compared with formaldehyde’s larger mature base, DME has greater headroom for incremental adoption, enabling the methanol industry to capture faster derivative volume and revenue growth opportunities.
Unlock Market Intelligence
Explore the market potential with our data-driven report
Methanol Market Geographical Analysis
Asia Pacific accounted for 44% of the global methanol market in 2026, supported by China’s large coal-to-methanol industry, extensive downstream chemical manufacturing, and established methanol-to-olefins capacity. China remains central to regional consumption and production, with Yankuang Energy reporting methanol sales of 4.33 million tonnes and operating integrated chemical bases across Shandong, Shaanxi, Inner Mongolia, and Xinjiang. Large domestic feedstock availability and expanding chemical conversion capacity continue to reinforce Asia Pacific’s position as the largest regional market.
Capacity additions are further strengthening the region’s supply base. In 2025, Yankuang Energy reported the start of its Lunan Chemicals low-carbon energy-conversion project, which includes a 1 million-tonne-per-year methanol unit. The company also recorded 4.12 million tonnes of methanol production from key chemical operations during 2025. These investments support regional availability for formaldehyde, acetic acid, olefins, fuels, and other downstream applications while reinforcing Asia Pacific’s role in global methanol production and consumption.
Middle East and Africa is projected to be the fastest-growing region, expanding at a CAGR of 3.53% during 2026–2032 as gas monetization, petrochemical investment, and new downstream projects broaden the regional methanol value chain. In March 2025, Nigeria’s supertech chemical industries completed mechanical construction of a 100,000-tonne-per-year methanol plant, with planned expansion to 500,000 tonnes per year by 2026. Meanwhile, Egypt’s USD 120 million Suez methanol derivative company project entered EPC in March 2026, targeting 140,000 tonnes per year of methanol derivatives.

Methanol Market Competitive Landscape
Competition remains fragmented, with multinational merchant suppliers operating alongside large integrated regional producers. The top players including Methanex Corporation, PROMAN AG, Yankuang Energy Group Company Limited, SaudiMethanol Company (AR RAZI) and Zagros Petrochemical Company represent a 15% market share in 2026.
Key Companies in the Methanol Market
- Methanex Corporation
- PROMAN AG
- Yankuang Energy Group Company Limited
- SaudiMethanol Company (AR RAZI)
- Zagros Petrochemical Company
- PETRONAS Chemicals Group Berhad
- KavehMethanol Company
- Sarawak Petchem Sdn Bhd
- Mitsubishi Gas Chemical Company, Inc.
- Marjan Petrochemical Company
- Bushehr Petrochemical Company
- Middle East Kimiaye Pars Petrochemical Company
- Sabalan Petrochemical Industries
- OQ Base Industries (SFZ) SAOG
- Qatar Fuel Additives Company Limited
Company Profiling
The profiles assess market-relevant production scale, geographic reach, Methanol portfolio strength, and operating positioning across the five companies selected for detailed coverage.
Methanex Corporation: Methanex Corporation is headquartered in Canada and describes itself as the world’s largest producer and supplier of methanol. Its production network spans Canada, the United States, Chile, Trinidad and Tobago, New Zealand, and Egypt, supporting diversified access to merchant customers. The company supplies methanol into chemical and energy applications through an integrated production, marketing, and logistics model. Its geographic spread reduces reliance on any single producing basin and positions Methanex as a volume-focused supplier with strong distribution flexibility.
PROMAN AG: PROMAN AG participates through methanol Holdings (Trinidad) Limited, part of the Proman family of companies at Point Lisas, Trinidad and Tobago. MHTL operates five methanol plants with total rated annual capacity above 4 million tonnes, including the 1.89-million-tonne M5000 unit. This scale supports export supply into major Atlantic Basin markets and gives Proman a substantial integrated production base. Its competitive role is built around large-volume manufacturing, established plant infrastructure, and access to Trinidad’s long-standing gas-based petrochemical cluster.
Yankuang Energy Group Company Limited: Yankuang Energy Group Company Limited is a Chinese listed energy and chemicals producer with major operating bases across Shandong, Shaanxi, Inner Mongolia, and Xinjiang. Its high-end chemicals portfolio includes methanol, acetic acid, ethylene glycol, and other coal-derived products. The company states that methanol sales reached 4.33 million tonnes, ranking first in China. Integrated coal resources, multiple chemical parks, and downstream product breadth make Yankuang a large domestic producer with cost and feedstock integration advantages in China’s methanol value chain.
SaudiMethanol Company (AR RAZI): Saudi Methanol Company (AR RAZI) operates in Al-Jubail, Saudi Arabia, within SABIC’s petrochemical network as a dedicated methanol affiliate. SABIC identifies AR RAZI as a producer of chemical-grade methanol, serving industrial conversion uses that require consistent bulk specifications. Its location within the Jubail industrial complex provides access to established feedstock, utilities, export infrastructure, and downstream chemical customers. AR RAZI therefore remains a strategically positioned Middle Eastern producer focused on large-scale conventional methanol supply and dependable regional supply relationships.
Zagros Petrochemical Company: Zagros Petrochemical Company is an Iranian methanol producer based at Assaluyeh near the South Pars gas fields. Iran’s Ministry of Petroleum news agency has described the company among the world’s five largest methanol producers, with annual capacity around 3.3 million tonnes. Its location provides direct access to a major gas-resource base and export-oriented petrochemical infrastructure. Zagros competes primarily as a high-volume regional producer, with its market position shaped by feedstock availability, plant operating rates, and access to Asian export destinations.
Recent Developments in the Methanol Market
- June 2025: Methanex Corporation completed its acquisition of OCI ’s international methanol business for approximately USD 1.2 billion in cash, 9.9 million Methanex shares, and assumption of about USD 450 million in debt and leases. The transaction added Beaumont production interests, low-carbon marketing operations, and an idled Netherlands facility to its portfolio.
- 2025: Yankuang Energy Group Company Limited reported that its Lunan Chemicals low-carbon energy-conversion project formally started, including construction of a 1 million-tonne-per-year methanol unit. Its 2025 annual report also recorded 4.12 million tonnes of methanol production from key chemical operations, reinforcing the company’s expanding coal-chemicals scale in China.
- March 2026: Egypt’s ECHEM confirmed that the Suez methanol Derivative Company project at Damietta had entered the engineering, procurement, and construction phase. The USD 120 million project is designed for 140,000 tonnes per year of methanol derivatives, strengthening downstream conversion capacity rather than adding another standalone commodity-methanol outlet.
- March 2025: Nigeria’s Supertech Chemical Industries methanol and ammonium-bicarbonate project in Ondo State reached 100% mechanical completion. The plant was designed initially for 100,000 tonnes per year of methanol with a targeted scale-up to 500,000 tonnes per year by 2026, supporting domestic gas monetization and a new West African production base.
Frequently Asked Questions
Related Report
- Market Segmentation
- Research Scope
- Research Methodology
- Definitions and Assumptions
- Executive Summary
- Global Methanol Market Policies, Regulations, and Standards
- Global Methanol Market Dynamics
- Growth Factors
- Challenges
- Trends
- Opportunities
- Global Methanol Market Statistics, 2022-2032F
- Market Size & Growth Outlook
- By Revenues in USD Million
- Market Segmentation & Growth Outlook
- By Feedstock
- Natural Gas- Market Insights and Forecast 2022-2032, USD Million
- Coal- Market Insights and Forecast 2022-2032, USD Million
- Renewable Feedstocks- Market Insights and Forecast 2022-2032, USD Million
- Others- Market Insights and Forecast 2022-2032, USD Million
- By Derivative
- Formaldehyde- Market Insights and Forecast 2022-2032, USD Million
- Acetic Acid- Market Insights and Forecast 2022-2032, USD Million
- Methanol-to-Olefins (MTO)- Market Insights and Forecast 2022-2032, USD Million
- Methyl Tert-Butyl Ether (MTBE)- Market Insights and Forecast 2022-2032, USD Million
- Dimethyl Ether (DME)- Market Insights and Forecast 2022-2032, USD Million
- Other Derivatives- Market Insights and Forecast 2022-2032, USD Million
- By Derived Products
- Resins- Market Insights and Forecast 2022-2032, USD Million
- Olefins- Market Insights and Forecast 2022-2032, USD Million
- Fuel Additives- Market Insights and Forecast 2022-2032, USD Million
- Solvents- Market Insights and Forecast 2022-2032, USD Million
- Other Derived Products- Market Insights and Forecast 2022-2032, USD Million
- By End-Use Industry
- Chemicals- Market Insights and Forecast 2022-2032, USD Million
- Automotive & Transportation- Market Insights and Forecast 2022-2032, USD Million
- Construction- Market Insights and Forecast 2022-2032, USD Million
- Marine- Market Insights and Forecast 2022-2032, USD Million
- Paints & Coatings- Market Insights and Forecast 2022-2032, USD Million
- Others- Market Insights and Forecast 2022-2032, USD Million
- By Region
- North America
- South America
- Europe
- The Middle East and Africa
- Asia Pacific
- By Competitors
- Competition Characteristics
- Market Share & Analysis
- By Feedstock
- Market Size & Growth Outlook
- North America Methanol Market Statistics, 2022-2032F
- Market Size & Growth Outlook
- By Revenues in USD Million
- Market Segmentation & Growth Outlook
- By Feedstock- Market Insights and Forecast 2022-2032, USD Million
- By Derivative- Market Insights and Forecast 2022-2032, USD Million By Derived Products- Market Insights and Forecast 2022-2032, USD Million By End-Use Industry- Market Insights and Forecast 2022-2032, USD Million
- By Country
- The US
- Canada
- Mexico
- The US Methanol Market Statistics, 2022-2032F
- Market Size & Growth Outlook
- By Revenues in USD Million
- Market Segmentation & Growth Outlook
- By Feedstock- Market Insights and Forecast 2022-2032, USD Million
- By Derivative- Market Insights and Forecast 2022-2032, USD Million
- By Derived Products- Market Insights and Forecast 2022-2032, USD Million
- By End-Use Industry- Market Insights and Forecast 2022-2032, USD Million
- Market Size & Growth Outlook
- Canada Methanol Market Statistics, 2022-2032F
- Market Size & Growth Outlook
- By Revenues in USD Million
- Market Segmentation & Growth Outlook
- By Feedstock- Market Insights and Forecast 2022-2032, USD Million
- By Derivative- Market Insights and Forecast 2022-2032, USD Million
- By Derived Products- Market Insights and Forecast 2022-2032, USD Million
- By End-Use Industry- Market Insights and Forecast 2022-2032, USD Million
- Market Size & Growth Outlook
- Mexico Methanol Market Statistics, 2022-2032F
- Market Size & Growth Outlook
- By Revenues in USD Million
- Market Segmentation & Growth Outlook
- By Feedstock- Market Insights and Forecast 2022-2032, USD Million
- By Derivative- Market Insights and Forecast 2022-2032, USD Million
- By Derived Products- Market Insights and Forecast 2022-2032, USD Million
- By End-Use Industry- Market Insights and Forecast 2022-2032, USD Million
- Market Size & Growth Outlook
- Market Size & Growth Outlook
- South America Methanol Market Statistics, 2022-2032F
- Market Size & Growth Outlook
- By Revenues in USD Million
- Market Segmentation & Growth Outlook
- By Feedstock- Market Insights and Forecast 2022-2032, USD Million
- By Derivative- Market Insights and Forecast 2022-2032, USD Million
- By Derived Products- Market Insights and Forecast 2022-2032, USD Million
- By End-Use Industry- Market Insights and Forecast 2022-2032, USD Million
- By Country
- Brazil
- Argentina
- Chile
- Rest of South America
- Brazil Methanol Market Statistics, 2022-2032F
- Market Size & Growth Outlook
- By Revenues in USD Million
- Market Segmentation & Growth Outlook
- By Feedstock- Market Insights and Forecast 2022-2032, USD Million
- By Derivative- Market Insights and Forecast 2022-2032, USD Million
- By Derived Products- Market Insights and Forecast 2022-2032, USD Million
- By End-Use Industry- Market Insights and Forecast 2022-2032, USD Million
- Market Size & Growth Outlook
- Argentina Methanol Market Statistics, 2022-2032F
- Market Size & Growth Outlook
- By Revenues in USD Million
- Market Segmentation & Growth Outlook
- By Feedstock- Market Insights and Forecast 2022-2032, USD Million
- By Derivative- Market Insights and Forecast 2022-2032, USD Million
- By Derived Products- Market Insights and Forecast 2022-2032, USD Million
- By End-Use Industry- Market Insights and Forecast 2022-2032, USD Million
- Market Size & Growth Outlook
- Chile Methanol Market Statistics, 2022-2032F
- Market Size & Growth Outlook
- By Revenues in USD Million
- Market Segmentation & Growth Outlook
- By Feedstock- Market Insights and Forecast 2022-2032, USD Million
- By Derivative- Market Insights and Forecast 2022-2032, USD Million
- By Derived Products- Market Insights and Forecast 2022-2032, USD Million
- By End-Use Industry- Market Insights and Forecast 2022-2032, USD Million
- Market Size & Growth Outlook
- Market Size & Growth Outlook
- Europe Methanol Market Statistics, 2022-2032F
- Market Size & Growth Outlook
- By Revenues in USD Million
- Market Segmentation & Growth Outlook
- By Feedstock- Market Insights and Forecast 2022-2032, USD Million
- By Derivative- Market Insights and Forecast 2022-2032, USD Million
- By Derived Products- Market Insights and Forecast 2022-2032, USD Million
- By End-Use Industry- Market Insights and Forecast 2022-2032, USD Million
- By Country
- Germany
- The UK
- France
- Italy
- Spain
- BENELUX
- Nordics
- Rest of Europe
- Germany Methanol Market Statistics, 2022-2032F
- Market Size & Growth Outlook
- By Revenues in USD Million
- Market Segmentation & Growth Outlook
- By Feedstock- Market Insights and Forecast 2022-2032, USD Million
- By Derivative- Market Insights and Forecast 2022-2032, USD Million
- By Derived Products- Market Insights and Forecast 2022-2032, USD Million
- By End-Use Industry- Market Insights and Forecast 2022-2032, USD Million
- Market Size & Growth Outlook
- The UK Methanol Market Statistics, 2022-2032F
- Market Size & Growth Outlook
- By Revenues in USD Million
- Market Segmentation & Growth Outlook
- By Feedstock- Market Insights and Forecast 2022-2032, USD Million
- By Derivative- Market Insights and Forecast 2022-2032, USD Million
- By Derived Products- Market Insights and Forecast 2022-2032, USD Million
- By End-Use Industry- Market Insights and Forecast 2022-2032, USD Million
- Market Size & Growth Outlook
- France Methanol Market Statistics, 2022-2032F
- Market Size & Growth Outlook
- By Revenues in USD Million
- Market Segmentation & Growth Outlook
- By Feedstock- Market Insights and Forecast 2022-2032, USD Million
- By Derivative- Market Insights and Forecast 2022-2032, USD Million
- By Derived Products- Market Insights and Forecast 2022-2032, USD Million
- By End-Use Industry- Market Insights and Forecast 2022-2032, USD Million
- Market Size & Growth Outlook
- Italy Methanol Market Statistics, 2022-2032F
- Market Size & Growth Outlook
- By Revenues in USD Million
- Market Segmentation & Growth Outlook
- By Feedstock- Market Insights and Forecast 2022-2032, USD Million
- By Derivative- Market Insights and Forecast 2022-2032, USD Million
- By Derived Products- Market Insights and Forecast 2022-2032, USD Million
- By End-Use Industry- Market Insights and Forecast 2022-2032, USD Million
- Market Size & Growth Outlook
- Spain Methanol Market Statistics, 2022-2032F
- Market Size & Growth Outlook
- By Revenues in USD Million
- Market Segmentation & Growth Outlook
- By Feedstock- Market Insights and Forecast 2022-2032, USD Million
- By Derivative- Market Insights and Forecast 2022-2032, USD Million
- By Derived Products- Market Insights and Forecast 2022-2032, USD Million
- By End-Use Industry- Market Insights and Forecast 2022-2032, USD Million
- Market Size & Growth Outlook
- BENELUX Methanol Market Statistics, 2022-2032F
- Market Size & Growth Outlook
- By Revenues in USD Million
- Market Segmentation & Growth Outlook
- By Feedstock- Market Insights and Forecast 2022-2032, USD Million
- By Derivative- Market Insights and Forecast 2022-2032, USD Million
- By Derived Products- Market Insights and Forecast 2022-2032, USD Million
- By End-Use Industry- Market Insights and Forecast 2022-2032, USD Million
- Market Size & Growth Outlook
- Nordics Methanol Market Statistics, 2022-2032F
- Market Size & Growth Outlook
- By Revenues in USD Million
- Market Segmentation & Growth Outlook
- By Feedstock- Market Insights and Forecast 2022-2032, USD Million
- By Derivative- Market Insights and Forecast 2022-2032, USD Million
- By Derived Products- Market Insights and Forecast 2022-2032, USD Million
- By End-Use Industry- Market Insights and Forecast 2022-2032, USD Million
- Market Size & Growth Outlook
- Market Size & Growth Outlook
- The Middle East and Africa Methanol Market Statistics, 2022-2032F
- Market Size & Growth Outlook
- By Revenues in USD Million
- Market Segmentation & Growth Outlook
- By Feedstock- Market Insights and Forecast 2022-2032, USD Million
- By Derivative- Market Insights and Forecast 2022-2032, USD Million
- By Derived Products- Market Insights and Forecast 2022-2032, USD Million
- By End-Use Industry- Market Insights and Forecast 2022-2032, USD Million
- By Country
- UAE
- Saudi Arabia
- South Africa
- Turkey
- Rest of Middle East & Africa
- UAE Methanol Market Statistics, 2022-2032F
- Market Size & Growth Outlook
- By Revenues in USD Million
- Market Segmentation & Growth Outlook
- By Feedstock- Market Insights and Forecast 2022-2032, USD Million
- By Derivative- Market Insights and Forecast 2022-2032, USD Million
- By Derived Products- Market Insights and Forecast 2022-2032, USD Million
- By End-Use Industry- Market Insights and Forecast 2022-2032, USD Million
- Market Size & Growth Outlook
- Saudi Arabia Methanol Market Statistics, 2022-2032F
- Market Size & Growth Outlook
- By Revenues in USD Million
- Market Segmentation & Growth Outlook
- By Feedstock- Market Insights and Forecast 2022-2032, USD Million
- By Derivative- Market Insights and Forecast 2022-2032, USD Million
- By Derived Products- Market Insights and Forecast 2022-2032, USD Million
- By End-Use Industry- Market Insights and Forecast 2022-2032, USD Million
- Market Size & Growth Outlook
- South Africa Methanol Market Statistics, 2022-2032F
- Market Size & Growth Outlook
- By Revenues in USD Million
- Market Segmentation & Growth Outlook
- By Feedstock- Market Insights and Forecast 2022-2032, USD Million
- By Derivative- Market Insights and Forecast 2022-2032, USD Million
- By Derived Products- Market Insights and Forecast 2022-2032, USD Million
- By End-Use Industry- Market Insights and Forecast 2022-2032, USD Million
- Market Size & Growth Outlook
- Turkey Methanol Market Statistics, 2022-2032F
- Market Size & Growth Outlook
- By Revenues in USD Million
- Market Segmentation & Growth Outlook
- By Feedstock- Market Insights and Forecast 2022-2032, USD Million
- By Derivative- Market Insights and Forecast 2022-2032, USD Million
- By Derived Products- Market Insights and Forecast 2022-2032, USD Million
- By End-Use Industry- Market Insights and Forecast 2022-2032, USD Million
- Market Size & Growth Outlook
- Market Size & Growth Outlook
- Asia Pacific Methanol Market Statistics, 2022-2032F
- Market Size & Growth Outlook
- By Revenues in USD Million
- Market Segmentation & Growth Outlook
- By Feedstock- Market Insights and Forecast 2022-2032, USD Million
- By Derivative- Market Insights and Forecast 2022-2032, USD Million
- By Derived Products- Market Insights and Forecast 2022-2032, USD Million
- By End-Use Industry- Market Insights and Forecast 2022-2032, USD Million
- By Country
- China
- India
- Japan
- South Korea
- Australia
- Southeast Asia
- Rest of Asia Pacific
- China Methanol Market Statistics, 2022-2032F
- Market Size & Growth Outlook
- By Revenues in USD Million
- Market Segmentation & Growth Outlook
- By Feedstock- Market Insights and Forecast 2022-2032, USD Million
- By Derivative- Market Insights and Forecast 2022-2032, USD Million
- By Derived Products- Market Insights and Forecast 2022-2032, USD Million
- By End-Use Industry- Market Insights and Forecast 2022-2032, USD Million
- Market Size & Growth Outlook
- India Methanol Market Statistics, 2022-2032F
- Market Size & Growth Outlook
- By Revenues in USD Million
- Market Segmentation & Growth Outlook
- By Feedstock- Market Insights and Forecast 2022-2032, USD Million
- By Derivative- Market Insights and Forecast 2022-2032, USD Million
- By Derived Products- Market Insights and Forecast 2022-2032, USD Million
- By End-Use Industry- Market Insights and Forecast 2022-2032, USD Million
- Market Size & Growth Outlook
- Japan Methanol Market Statistics, 2022-2032F
- Market Size & Growth Outlook
- By Revenues in USD Million
- Market Segmentation & Growth Outlook
- By Feedstock- Market Insights and Forecast 2022-2032, USD Million
- By Derivative- Market Insights and Forecast 2022-2032, USD Million
- By Derived Products- Market Insights and Forecast 2022-2032, USD Million
- By End-Use Industry- Market Insights and Forecast 2022-2032, USD Million
- Market Size & Growth Outlook
- South Korea Methanol Market Statistics, 2022-2032F
- Market Size & Growth Outlook
- By Revenues in USD Million
- Market Segmentation & Growth Outlook
- By Feedstock- Market Insights and Forecast 2022-2032, USD Million
- By Derivative- Market Insights and Forecast 2022-2032, USD Million
- By Derived Products- Market Insights and Forecast 2022-2032, USD Million
- By End-Use Industry- Market Insights and Forecast 2022-2032, USD Million
- Market Size & Growth Outlook
- Australia Methanol Market Statistics, 2022-2032F
- Market Size & Growth Outlook
- By Revenues in USD Million
- Market Segmentation & Growth Outlook
- By Feedstock- Market Insights and Forecast 2022-2032, USD Million
- By Derivative- Market Insights and Forecast 2022-2032, USD Million
- By Derived Products- Market Insights and Forecast 2022-2032, USD Million
- By End-Use Industry- Market Insights and Forecast 2022-2032, USD Million
- Market Size & Growth Outlook
- Southeast Asia Methanol Market Statistics, 2022-2032F
- Market Size & Growth Outlook
- By Revenues in USD Million
- Market Segmentation & Growth Outlook
- By Feedstock- Market Insights and Forecast 2022-2032, USD Million
- By Derivative- Market Insights and Forecast 2022-2032, USD Million
- By Derived Products- Market Insights and Forecast 2022-2032, USD Million
- By End-Use Industry- Market Insights and Forecast 2022-2032, USD Million
- Market Size & Growth Outlook
- Market Size & Growth Outlook
- Competitive Outlook
- Company Profiles
- Methanex Corporation
- Business Description
- Product Portfolio
- Collaborations & Alliances
- Recent Developments
- Financial Details
- Others
- PROMAN AG
- Business Description
- Product Portfolio
- Collaborations & Alliances
- Recent Developments
- Financial Details
- Others
- Yankuang Energy Group Company Limited
- Business Description
- Product Portfolio
- Collaborations & Alliances
- Recent Developments
- Financial Details
- Others
- Saudi Methanol Company (AR RAZI)
- Business Description
- Product Portfolio
- Collaborations & Alliances
- Recent Developments
- Financial Details
- Others
- Zagros Petrochemical Company
- Business Description
- Product Portfolio
- Collaborations & Alliances
- Recent Developments
- Financial Details
- Others
- PETRONAS Chemicals Group Berhad
- Business Description
- Product Portfolio
- Collaborations & Alliances
- Recent Developments
- Financial Details
- Others
- Kaveh Methanol Company
- Business Description
- Product Portfolio
- Collaborations & Alliances
- Recent Developments
- Financial Details
- Others
- Sarawak Petchem Sdn Bhd
- Business Description
- Product Portfolio
- Collaborations & Alliances
- Recent Developments
- Financial Details
- Others
- Mitsubishi Gas Chemical Company, Inc.
- Business Description
- Product Portfolio
- Collaborations & Alliances
- Recent Developments
- Financial Details
- Others
- Marjan Petrochemical Company
- Business Description
- Product Portfolio
- Collaborations & Alliances
- Recent Developments
- Financial Details
- Others
- Bushehr Petrochemical Company
- Business Description
- Product Portfolio
- Collaborations & Alliances
- Recent Developments
- Financial Details
- Others
- Middle East Kimiaye Pars Petrochemical Company
- Business Description
- Product Portfolio
- Collaborations & Alliances
- Recent Developments
- Financial Details
- Others
- Sabalan Petrochemical Industries
- Business Description
- Product Portfolio
- Collaborations & Alliances
- Recent Developments
- Financial Details
- Others
- OQ Base Industries (SFZ) SAOG
- Business Description
- Product Portfolio
- Collaborations & Alliances
- Recent Developments
- Financial Details
- Others
- Qatar Fuel Additives Company Limited
- Business Description
- Product Portfolio
- Collaborations & Alliances
- Recent Developments
- Financial Details
- Others
- Methanex Corporation
- Company Profiles
- Disclaimer
| Segment | Sub-Segment |
|---|---|
| By Feedstock |
|
| By Derivative |
|
| By Derived Products |
|
| By End-Use Industry |
|
| By Region |
|
Research Methodology
This study followed a structured approach comprising four key phases to assess the size and scope of the electro-oxidation market. The process began with thorough secondary research to collect data on the target market, related markets, and broader industry context. These findings, along with preliminary assumptions and estimates, were then validated through extensive primary research involving industry experts from across the value chain. To calculate the overall market size, both top-down and bottom-up methodologies were employed. Finally, market segmentation and data triangulation techniques were applied to refine and validate segment-level estimations.
Secondary Research
The secondary research phase involved gathering data from a wide range of credible and published sources. This step helped in identifying industry trends, defining market segmentation, and understanding the market landscape and value chain.
Sources consulted during this phase included:
- Company annual reports, investor presentations, and press releases
- Industry white papers and certified publications
- Trade directories and market-recognized databases
- Articles from authoritative authors and reputable journals
- Gold and silver standard websites
Secondary research was critical in mapping out the industry's value chain and monetary flow, identifying key market segments, understanding regional variations, and tracking significant industry developments.
Other key sources:
- Financial disclosures
- Industry associations and trade bodies
- News outlets and business magazines
- Academic journals and research studies
- Paid industry databases
Primary Research
To validate secondary data and gain deeper market insights, primary research was conducted with key stakeholders across both the supply and demand sides of the market.
On the demand side, participants included decision-makers and influencers from end-user industries—such as CIOs, CTOs, and CSOs—who provided first-hand perspectives on market needs, product usage, and future expectations.
On the supply side, interviews were conducted with manufacturers, industry associations, and institutional participants to gather insights into current offerings, product pipelines, and market challenges.
Primary interviews provided critical inputs such as:
- Market size and revenue data
- Product and service breakdowns
- Market forecasts
- Regional and application-specific trends
Stakeholders consulted included:
- Leading OEM and solution providers
- Channel and distribution partners
- End users across various applications
- Independent consultants and industry specialists
Market Size Estimation and Data Triangulation
- Identifying Key Market Participants (Secondary Research)
- Goal: To identify the major players or companies in the target market. This typically involves using publicly available data sources such as industry reports, market research publications, and financial statements of companies.
- Tools: Reports from firms like Gartner, Forrester, Euromonitor, Statista, IBISWorld, and others. Public financial statements, news articles, and press releases from top market players.
- Extracting Earnings of Key Market Participants
- Goal: To estimate the earnings generated from the product or service being analyzed. This step helps in understanding the revenue potential of each market player in a specific geography.
- Methods: Earnings data can be gathered from:
- Publicly available financial reports (for listed companies).
- Interviews and primary data sources from professionals, such as Directors, VPs, SVPs, etc. This is especially useful for understanding more nuanced, internal data that isn't publicly disclosed.
- Annual reports and investor presentations of key players.
- Data Collation and Development of a Relevant Data Model
- Goal: To collate inputs from both primary and secondary sources into a structured, data-driven model for market estimation. This model will incorporate key market KPIs and any independent variables relevant to the market.
- Key KPIs: These could include:
- Market size, growth rate, and demand drivers.
- Industry-specific metrics like market share, average revenue per customer (ARPC), or average deal size.
- External variables, such as economic growth rates, inflation rates, or commodity prices, that could affect the market.
- Data Modeling: Based on this data, the market forecasts are developed for the next 5 years. A combination of trend analysis, scenario modeling, and statistical regression might be used to generate projections.
- Scenario Analysis
- Goal: To test different assumptions and validate how sensitive the market is to changes in key variables (e.g., market demand, regulatory changes, technological disruptions).
- Types of Scenarios:
- Base Case: Based on current assumptions and historical data.
- Best-Case Scenario: Assuming favorable market conditions, regulatory environments, and technological advancements.
- Worst-Case Scenario: Accounting for adverse factors, such as economic downturns, stricter regulations, or unexpected disruptions.