Global Sustainable Aviation Fuel Market Report: Trends, Growth and Forecast (2026-2032)
By Fuel Type (Biofuel, Synthetic Fuel, Power to Liquid Fuel, Gas to Liquid Fuel), By Production Technology (Hydroprocessed Esters and Fatty Acids Synthetic Paraffinic Kerosene, Fischer Tropsch Synthetic Paraffinic Kerosene, Alcohol to Jet Synthetic Paraffinic Kerosene, Hydroprocessed Fermented Sugars to Synthetic Iso Paraffins, Catalytic Hydrothermolysis Jet, Co Processing Technology, Power to Liquid Technology), By Feedstock (Used Cooking Oil, Animal Fats and Tallow, Agricultural Residues, Forestry Residues, Municipal Solid Waste, Alcohols, Captured Carbon Dioxide and Green Hydrogen, Others), By Blending Capacity (Below 30%, 30% to 50%, Above 50%), By Application (Commercial Aviation, Military Aviation, Business and General Aviation, Air Cargo), By Region (North America, South America, Europe, Middle East and Africa, Asia Pacific) ... Read more
|
Major Players
|
Global Sustainable Aviation Fuel Market Statistics and Insights, 2026
- Market Size Statistics
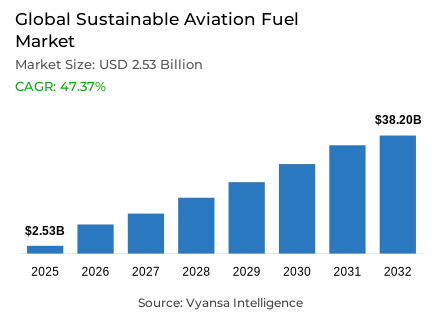
- Sustainable aviation fuel market size in Global was valued at USD 2.53 billion in 2025 and is estimated at USD 3.57 billion in 2026.
- The market size is expected to grow to USD 38.2 billion by 2032.
- Market to register a CAGR of around 47.37% during 2026-32.
- Fuel Type Shares
- Biofuel grabbed market share of 85%.
- Competition
- More than 30 companies are actively engaged in producing sustainable aviation fuel.
- Top 5 companies acquired around 50% of the market share.
- World Energy LLC, Repsol S.A., China Petroleum & Chemical Corporation, Neste Corporation, Diamond Green Diesel LLC etc., are few of the top companies.
- Production Technology
- Hydroprocessed esters and fatty acids synthetic paraffinic kerosene grabbed 85% of the market.
- Region
- North America leads with a 40% share of the global market.
Global Sustainable Aviation Fuel Market Outlook
The Global Sustainable Aviation Fuel Market covers certified renewable aviation fuels produced from bio-based, waste-derived, and synthetic feedstocks for blending into commercial, cargo, military, and business aviation fuel systems. The market is valued at USD 2.53 Billion in 2025 and USD 3.57 Billion in 2026, and is projected to reach USD 38.20 Billion by 2032, growing at a CAGR of 47.37% from 2026 to 2032. The Global Sustainable Aviation Fuel Industry is positioned as a core aviation decarbonization lever for airlines seeking measurable fuel transition pathways.
North America leads early capacity formation, Europe is shaped by binding blending mandates, MEA is moving through refinery and logistics partnerships, Asia-Pacific is building feedstock-linked supply chains, and South America is evaluating bio-based export pathways. The Global Sustainable Aviation Fuel Market benefits from this multi-region policy alignment, while the industry remains constrained by certification timelines, feedstock aggregation, and refinery conversion economics across emerging production corridors.
Industrial impact is concentrated around airline procurement, airport fuel infrastructure, refinery retrofits, and offtake-backed project finance. The Global Sustainable Aviation Fuel Market improves compliance readiness for operators exposed to carbon regulation, while the Global Sustainable Aviation Fuel Industry strengthens demand for certified feedstock traceability, ASTM-compliant fuel pathways, and low carbon jet fuel logistics. This creates wider participation for producers, blenders, airports, technology licensors, and verification providers across the SAF supply chain.
The 2026 trajectory reflects stronger demand visibility rather than broad fuel substitution. The market is scaling through mandates, long-term offtake contracts, SAF procurement, and production technology upgrades, while the industry is shifting from pilot availability toward contracted volumes. Supplier positioning will increasingly depend on feedstock security, refinery integration, certification, airport distribution access, and the ability to deliver reliable volumes under airline procurement schedules across scheduled, charter, and logistics aviation operations.

Global Sustainable Aviation Fuel Market Growth Driver
Policy-Led Decarbonization Is Accelerating Fuel Substitution
Aviation climate compliance is increasing demand for low carbon jet fuel as airlines, airports, and fuel suppliers align procurement plans with emissions-reduction commitments. The Global Sustainable Aviation Fuel Market benefits from drop-in compatibility, allowing SAF adoption without immediate aircraft redesign, while the Global Sustainable Aviation Fuel Industry gains demand visibility from mandates and airline net zero targets. This supports SAF market growth across commercial aviation, air cargo, and business aviation, especially where aviation climate compliance is becoming a formal fuel-sourcing requirement.
The European Commission reported that ReFuelEU Aviation targets a 2% SAF share at EU airports in 2025 and progression toward a 6% target by 2030. This policy-backed blending mandate converts decarbonization ambition into procurement obligation, strengthening Sustainable Aviation Fuel market forecast visibility and encouraging fuel suppliers to secure certified volumes, airport logistics, and feedstock-linked production capacity across regulated aviation fuel pools under increasingly auditable procurement, reporting, and compliance frameworks.
Global Sustainable Aviation Fuel Market Challenge
Feedstock, Cost, and Scale Gaps Are Constraining Commercial Uptake
Limited supply, cost premiums, and uneven feedstock aggregation continue to restrict near-term deployment across airline networks. The Global Sustainable Aviation Fuel Market faces pressure because SAF availability remains far below conventional jet fuel demand, while the Global Sustainable Aviation Fuel Industry must balance refinery economics, feedstock competition, and certification costs before producers can offer larger, more predictable volumes at commercially manageable prices for airlines already facing volatile fuel and route economics.
IATA reported that SAF output is expected to reach 1.9 million tonnes in 2025 and 2.4 million tonnes in 2026, representing only 0.6% and 0.8% of total jet fuel consumption, respectively. The same update noted an additional USD 3.6 billion fuel-cost premium in 2025, intensifying pricing pressure and slowing adoption where airline procurement budgets lack mandate-driven recovery mechanisms or long-term price-sharing structures. This keeps SAF price premiums central to airline adoption planning and supplier negotiations during 2026 procurement cycles.
Unlock Market Intelligence
Explore the market potential with our data-driven report
Global Sustainable Aviation Fuel Market Trend
Book-and-Claim Platforms and Long-Term Offtake Are Reshaping Procurement
Digital chain-of-custody systems and multi-year offtake agreements are reshaping Sustainable Aviation Fuel market trends by improving traceability, demand pooling, and contract bankability. The Global Sustainable Aviation Fuel Market is moving toward structured SAF purchase agreements, where airlines, logistics providers, and corporate travel buyers can support emission-reduction claims while producers gain bankable demand signals for refinery conversion and synthetic aviation fuel market expansion across routes with measurable emissions-accounting demand.
DHL Group announced in May 2026 that DHL Express signed a Bahrain SAF offtake agreement with SAF One for 25,000 tons of unblended SAF annually, totaling 250,000 tons over ten years. This development expands airport-linked supply planning in the Middle East and shows how long-term contracts can improve project certainty, geographic diversification, and commercial aviation SAF demand as logistics operators formalize multi-year fuel transition planning. The result is stronger visibility for sustainable jet fuel companies and project financiers across routes.
Global Sustainable Aviation Fuel Market Opportunity
Infrastructure Localization Is Opening New Supply Pathways
Regional production hubs, airport fuel systems, and clean fuel incentives are creating opportunities for suppliers that can localize certified SAF supply close to aviation demand centers. The Global Sustainable Aviation Fuel Market can capture higher operational uptake when producers align feedstock sourcing, refining capacity, and distribution infrastructure, while the Global Sustainable Aviation Fuel Industry gains resilience from diversified production locations beyond early U.S. and European corridors, including emerging airport clusters.
The U.S. Department of Energy states that the SAF Grand Challenge targets 3 billion gallons per year of domestic SAF by 2030 and 35 billion gallons by 2050. This policy direction supports investment in renewable aviation fuel market infrastructure, improves market access for technology providers, and encourages producers to scale certified pathways that can serve airline offtake agreements and airport distribution networks with stronger supply-chain localization. This widens demand capture for technology licensors and regional fuel developers across aviation corridors.
Global Sustainable Aviation Fuel Market Regional Analysis

By Region
- North America
- South America
- Europe
- Middle East and Africa
- Asia Pacific
North America holds 40% share, supported by policy incentives, airline offtake activity, airport infrastructure, and refinery conversion momentum. The Global Sustainable Aviation Fuel Market benefits from U.S. clean fuel policy and established aviation fuel distribution systems, while the Global Sustainable Aviation Fuel Industry gains stronger investment direction from federal targets, state-level clean fuel programs, and demand from major commercial aviation and air cargo networks seeking predictable SAF supply access.
The IRS states that the Clean Fuel Production Credit is available for clean transportation fuel produced domestically and sold from January 1, 2025, through December 31, 2029, with SAF treated as a distinct fuel category. This improves compliance-linked economics, strengthens domestic supply participation, and supports North American SAF market outlook through predictable policy treatment for qualified producers, refinery developers, and aviation fuel distributors. This strengthens long-term offtake confidence across airlines, airports, and fuel blenders within the regional supply base through 2026.
Unlock Market Intelligence
Explore the market potential with our data-driven report
Global Sustainable Aviation Fuel Market Segmentation Analysis
By Fuel Type
- Biofuel
- Synthetic Fuel
- Power to Liquid Fuel
- Gas to Liquid Fuel
Biofuel holds 85% share by fuel type, supported by established renewable feedstock streams, refinery know-how, and near-term certification readiness. The Global Sustainable Aviation Fuel Market favors biofuel-based SAF because waste oils, fats, agricultural residues, and non-food biomass can integrate with existing renewable fuel supply chains, while the Global Sustainable Aviation Fuel Industry uses biojet fuel production to bridge near-term demand before eSAF and Power to Liquid aviation fuel scale across higher-cost production pathways.
IATA states that SAF can be produced from waste oil and fats, municipal waste, and non-food crops, and can reduce lifecycle CO2 emissions by up to 80%. This feedstock flexibility supports aviation biofuel market adoption, helps suppliers diversify inputs, and strengthens airline confidence in certified sustainable aviation fuel where feedstock traceability and lifecycle performance meet procurement requirements for aviation decarbonization fuel market buyers. This keeps renewable jet fuel trends closely tied to waste-feedstock logistics and certification systems.

By Production Technology
- Hydroprocessed Esters and Fatty Acids Synthetic Paraffinic Kerosene
- Fischer Tropsch Synthetic Paraffinic Kerosene
- Alcohol to Jet Synthetic Paraffinic Kerosene
- Hydroprocessed Fermented Sugars to Synthetic Iso Paraffins
- Catalytic Hydrothermolysis Jet
- Co Processing Technology
- Power to Liquid Technology
Hydroprocessed Esters and Fatty Acids Synthetic Paraffinic Kerosene holds 85% share by production technology due to its commercial maturity, compatibility with fats and oils, and refinery integration advantages. The Global Sustainable Aviation Fuel Market relies on HEFA Sustainable Aviation Fuel for near-term supply because the pathway fits existing renewable diesel assets, while the industry benefits from faster project execution than less mature Fischer Tropsch SAF or Alcohol to Jet SAF routes in early commercial deployment windows.
The U.S. Department of Energy stated that HEFA-based SAF uses fats, oils, and greases and remains the only technology proven at commercial scale today. This strengthens SAF production technology adoption, supports refinery retrofit strategies, and positions HEFA-SPK as the most bankable route for producers seeking near-term volume delivery, lower execution risk, and faster certification-aligned commercialization. This supports SAF adoption where producers need bankable output, predictable specifications, and integration with existing hydrotreating assets during scale-up.
Market Players in Global Sustainable Aviation Fuel Market
These market players maintain a significant presence in the Global sustainable aviation fuel market sector and contribute to its ongoing evolution.
- World Energy LLC
- Repsol S.A.
- China Petroleum & Chemical Corporation
- Neste Corporation
- Diamond Green Diesel LLC
- Eni S.p.A.
- Phillips 66 Company
- TotalEnergies SE
- Shell plc
- Calumet Inc.
- Moeve S.A.
- OMV Aktiengesellschaft
- bp p.l.c.
- LanzaJet Inc.
- Cosmo Energy Holdings Co. Ltd.
Market News & Updates
- Neste Corporation, 2025:
Neste started producing sustainable aviation fuel at its Rotterdam renewables refinery in April 2025. The modified refinery can produce up to 500,000 tons of SAF per year, increasing Neste’s total global SAF production capability to 1.5 million tons annually. The update expands certified renewable aviation fuel capacity for airline and airport fuel supply chains.
- Eni S.p.A., 2025:
Enilive began sustainable aviation fuel production at its Gela biorefinery in Sicily in January 2025. The plant adds SAF production within Eni’s biorefining network and supports supply for aviation decarbonisation requirements in Europe. The update strengthens HEFA-based SAF availability through an operational refinery asset linked to renewable aviation fuel production.
Frequently Asked Questions
Related Report
- Market Segmentation
- Research Scope
- Research Methodology
- Definitions and Assumptions
- Executive Summary
- Global Sustainable Aviation Fuel Market Policies, Regulations, and Standards
- Global Sustainable Aviation Fuel Market Dynamics
- Growth Factors
- Challenges
- Trends
- Opportunities
- Global Sustainable Aviation Fuel Market Statistics, 2022-2032F
- Market Size & Growth Outlook
- By Revenues in USD Million
- By Volume in Billion Gallons
- Market Segmentation & Growth Outlook
- By Fuel Type
- Biofuel- Market Insights and Forecast 2022-2032, USD Million
- Synthetic Fuel- Market Insights and Forecast 2022-2032, USD Million
- Power to Liquid Fuel- Market Insights and Forecast 2022-2032, USD Million
- Gas to Liquid Fuel- Market Insights and Forecast 2022-2032, USD Million
- By Production Technology
- Hydroprocessed Esters and Fatty Acids Synthetic Paraffinic Kerosene- Market Insights and Forecast 2022-2032, USD Million
- Fischer Tropsch Synthetic Paraffinic Kerosene- Market Insights and Forecast 2022-2032, USD Million
- Alcohol to Jet Synthetic Paraffinic Kerosene- Market Insights and Forecast 2022-2032, USD Million
- Hydroprocessed Fermented Sugars to Synthetic Iso Paraffins- Market Insights and Forecast 2022-2032, USD Million
- Catalytic Hydrothermolysis Jet- Market Insights and Forecast 2022-2032, USD Million
- Co Processing Technology- Market Insights and Forecast 2022-2032, USD Million
- Power to Liquid Technology- Market Insights and Forecast 2022-2032, USD Million
- By Feedstock
- Used Cooking Oil- Market Insights and Forecast 2022-2032, USD Million
- Animal Fats and Tallow- Market Insights and Forecast 2022-2032, USD Million
- Agricultural Residues- Market Insights and Forecast 2022-2032, USD Million
- Forestry Residues- Market Insights and Forecast 2022-2032, USD Million
- Municipal Solid Waste- Market Insights and Forecast 2022-2032, USD Million
- Alcohols- Market Insights and Forecast 2022-2032, USD Million
- Captured Carbon Dioxide and Green Hydrogen- Market Insights and Forecast 2022-2032, USD Million
- Others- Market Insights and Forecast 2022-2032, USD Million
- By Blending Capacity
- Below 30%- Market Insights and Forecast 2022-2032, USD Million
- 30% to 50%- Market Insights and Forecast 2022-2032, USD Million
- Above 50%- Market Insights and Forecast 2022-2032, USD Million
- By Application
- Commercial Aviation- Market Insights and Forecast 2022-2032, USD Million
- Military Aviation- Market Insights and Forecast 2022-2032, USD Million
- Business and General Aviation- Market Insights and Forecast 2022-2032, USD Million
- Air Cargo- Market Insights and Forecast 2022-2032, USD Million
- By Region
- North America
- South America
- Europe
- Middle East and Africa
- Asia Pacific
- By Competitors
- Competition Characteristics
- Market Share & Analysis
- By Fuel Type
- Market Size & Growth Outlook
- North America Sustainable Aviation Fuel Market Statistics, 2022-2032F
- Market Size & Growth Outlook
- By Revenues in USD Million
- By Volume in Billion Gallons
- Market Segmentation & Growth Outlook
- By Fuel Type- Market Insights and Forecast 2022-2032, USD Million
- By Production Technology- Market Insights and Forecast 2022-2032, USD Million
- By Feedstock- Market Insights and Forecast 2022-2032, USD Million
- By Blending Capacity- Market Insights and Forecast 2022-2032, USD Million
- By Application- Market Insights and Forecast 2022-2032, USD Million
- By Country
- The US
- Canada
- Mexico
- Rest of North America
- The US Sustainable Aviation Fuel Market Statistics, 2022-2032F
- Market Size & Growth Outlook
- By Revenues in USD Million
- By Volume in Billion Gallons
- Market Segmentation & Growth Outlook
- By Fuel Type- Market Insights and Forecast 2022-2032, USD Million
- By Production Technology- Market Insights and Forecast 2022-2032, USD Million
- By Feedstock- Market Insights and Forecast 2022-2032, USD Million
- By Blending Capacity- Market Insights and Forecast 2022-2032, USD Million
- By Application- Market Insights and Forecast 2022-2032, USD Million
- Market Size & Growth Outlook
- Canada Sustainable Aviation Fuel Market Statistics, 2022-2032F
- Market Size & Growth Outlook
- By Revenues in USD Million
- By Volume in Billion Gallons
- Market Segmentation & Growth Outlook
- By Fuel Type- Market Insights and Forecast 2022-2032, USD Million
- By Production Technology- Market Insights and Forecast 2022-2032, USD Million
- By Feedstock- Market Insights and Forecast 2022-2032, USD Million
- By Blending Capacity- Market Insights and Forecast 2022-2032, USD Million
- By Application- Market Insights and Forecast 2022-2032, USD Million
- Market Size & Growth Outlook
- Mexico Sustainable Aviation Fuel Market Statistics, 2022-2032F
- Market Size & Growth Outlook
- By Revenues in USD Million
- By Volume in Billion Gallons
- Market Segmentation & Growth Outlook
- By Fuel Type- Market Insights and Forecast 2022-2032, USD Million
- By Production Technology- Market Insights and Forecast 2022-2032, USD Million
- By Feedstock- Market Insights and Forecast 2022-2032, USD Million
- By Blending Capacity- Market Insights and Forecast 2022-2032, USD Million
- By Application- Market Insights and Forecast 2022-2032, USD Million
- Market Size & Growth Outlook
- Market Size & Growth Outlook
- South America Sustainable Aviation Fuel Market Statistics, 2022-2032F
- Market Size & Growth Outlook
- By Revenues in USD Million
- By Volume in Billion Gallons
- Market Segmentation & Growth Outlook
- By Fuel Type- Market Insights and Forecast 2022-2032, USD Million
- By Production Technology- Market Insights and Forecast 2022-2032, USD Million
- By Feedstock- Market Insights and Forecast 2022-2032, USD Million
- By Blending Capacity- Market Insights and Forecast 2022-2032, USD Million
- By Application- Market Insights and Forecast 2022-2032, USD Million
- By Country
- Brazil
- Argentina
- Rest of South America
- Brazil Sustainable Aviation Fuel Market Statistics, 2022-2032F
- Market Size & Growth Outlook
- By Revenues in USD Million
- By Volume in Billion Gallons
- Market Segmentation & Growth Outlook
- By Fuel Type- Market Insights and Forecast 2022-2032, USD Million
- By Production Technology- Market Insights and Forecast 2022-2032, USD Million
- By Feedstock- Market Insights and Forecast 2022-2032, USD Million
- By Blending Capacity- Market Insights and Forecast 2022-2032, USD Million
- By Application- Market Insights and Forecast 2022-2032, USD Million
- Market Size & Growth Outlook
- Argentina Sustainable Aviation Fuel Market Statistics, 2022-2032F
- Market Size & Growth Outlook
- By Revenues in USD Million
- By Volume in Billion Gallons
- Market Segmentation & Growth Outlook
- By Fuel Type- Market Insights and Forecast 2022-2032, USD Million
- By Production Technology- Market Insights and Forecast 2022-2032, USD Million
- By Feedstock- Market Insights and Forecast 2022-2032, USD Million
- By Blending Capacity- Market Insights and Forecast 2022-2032, USD Million
- By Application- Market Insights and Forecast 2022-2032, USD Million
- Market Size & Growth Outlook
- Market Size & Growth Outlook
- Europe Sustainable Aviation Fuel Market Statistics, 2022-2032F
- Market Size & Growth Outlook
- By Revenues in USD Million
- By Volume in Billion Gallons
- Market Segmentation & Growth Outlook
- By Fuel Type- Market Insights and Forecast 2022-2032, USD Million
- By Production Technology- Market Insights and Forecast 2022-2032, USD Million
- By Feedstock- Market Insights and Forecast 2022-2032, USD Million
- By Blending Capacity- Market Insights and Forecast 2022-2032, USD Million
- By Application- Market Insights and Forecast 2022-2032, USD Million
- By Country
- Germany
- The UK
- France
- Spain
- Italy
- Netherlands
- Rest of Europe
- Germany Sustainable Aviation Fuel Market Statistics, 2022-2032F
- Market Size & Growth Outlook
- By Revenues in USD Million
- By Volume in Billion Gallons
- Market Segmentation & Growth Outlook
- By Fuel Type- Market Insights and Forecast 2022-2032, USD Million
- By Production Technology- Market Insights and Forecast 2022-2032, USD Million
- By Feedstock- Market Insights and Forecast 2022-2032, USD Million
- By Blending Capacity- Market Insights and Forecast 2022-2032, USD Million
- By Application- Market Insights and Forecast 2022-2032, USD Million
- Market Size & Growth Outlook
- The UK Sustainable Aviation Fuel Market Statistics, 2022-2032F
- Market Size & Growth Outlook
- By Revenues in USD Million
- By Volume in Billion Gallons
- Market Segmentation & Growth Outlook
- By Fuel Type- Market Insights and Forecast 2022-2032, USD Million
- By Production Technology- Market Insights and Forecast 2022-2032, USD Million
- By Feedstock- Market Insights and Forecast 2022-2032, USD Million
- By Blending Capacity- Market Insights and Forecast 2022-2032, USD Million
- By Application- Market Insights and Forecast 2022-2032, USD Million
- Market Size & Growth Outlook
- France Sustainable Aviation Fuel Market Statistics, 2022-2032F
- Market Size & Growth Outlook
- By Revenues in USD Million
- By Volume in Billion Gallons
- Market Segmentation & Growth Outlook
- By Fuel Type- Market Insights and Forecast 2022-2032, USD Million
- By Production Technology- Market Insights and Forecast 2022-2032, USD Million
- By Feedstock- Market Insights and Forecast 2022-2032, USD Million
- By Blending Capacity- Market Insights and Forecast 2022-2032, USD Million
- By Application- Market Insights and Forecast 2022-2032, USD Million
- Market Size & Growth Outlook
- Spain Sustainable Aviation Fuel Market Statistics, 2022-2032F
- Market Size & Growth Outlook
- By Revenues in USD Million
- By Volume in Billion Gallons
- Market Segmentation & Growth Outlook
- By Fuel Type- Market Insights and Forecast 2022-2032, USD Million
- By Production Technology- Market Insights and Forecast 2022-2032, USD Million
- By Feedstock- Market Insights and Forecast 2022-2032, USD Million
- By Blending Capacity- Market Insights and Forecast 2022-2032, USD Million
- By Application- Market Insights and Forecast 2022-2032, USD Million
- Market Size & Growth Outlook
- Italy Sustainable Aviation Fuel Market Statistics, 2022-2032F
- Market Size & Growth Outlook
- By Revenues in USD Million
- By Volume in Billion Gallons
- Market Segmentation & Growth Outlook
- By Fuel Type- Market Insights and Forecast 2022-2032, USD Million
- By Production Technology- Market Insights and Forecast 2022-2032, USD Million
- By Feedstock- Market Insights and Forecast 2022-2032, USD Million
- By Blending Capacity- Market Insights and Forecast 2022-2032, USD Million
- By Application- Market Insights and Forecast 2022-2032, USD Million
- Market Size & Growth Outlook
- Netherlands Sustainable Aviation Fuel Market Statistics, 2022-2032F
- Market Size & Growth Outlook
- By Revenues in USD Million
- By Volume in Billion Gallons
- Market Segmentation & Growth Outlook
- By Fuel Type- Market Insights and Forecast 2022-2032, USD Million
- By Production Technology- Market Insights and Forecast 2022-2032, USD Million
- By Feedstock- Market Insights and Forecast 2022-2032, USD Million
- By Blending Capacity- Market Insights and Forecast 2022-2032, USD Million
- By Application- Market Insights and Forecast 2022-2032, USD Million
- Market Size & Growth Outlook
- Market Size & Growth Outlook
- Middle East and Africa Sustainable Aviation Fuel Market Statistics, 2022-2032F
- Market Size & Growth Outlook
- By Revenues in USD Million
- By Volume in Billion Gallons
- Market Segmentation & Growth Outlook
- By Fuel Type- Market Insights and Forecast 2022-2032, USD Million
- By Production Technology- Market Insights and Forecast 2022-2032, USD Million
- By Feedstock- Market Insights and Forecast 2022-2032, USD Million
- By Blending Capacity- Market Insights and Forecast 2022-2032, USD Million
- By Application- Market Insights and Forecast 2022-2032, USD Million
- By Country
- Saudi Arabia
- The UAE
- South Africa
- Egypt
- Rest of Middle East & Africa
- Saudi Arabia Sustainable Aviation Fuel Market Statistics, 2022-2032F
- Market Size & Growth Outlook
- By Revenues in USD Million
- By Volume in Billion Gallons
- Market Segmentation & Growth Outlook
- By Fuel Type- Market Insights and Forecast 2022-2032, USD Million
- By Production Technology- Market Insights and Forecast 2022-2032, USD Million
- By Feedstock- Market Insights and Forecast 2022-2032, USD Million
- By Blending Capacity- Market Insights and Forecast 2022-2032, USD Million
- By Application- Market Insights and Forecast 2022-2032, USD Million
- Market Size & Growth Outlook
- The UAE Sustainable Aviation Fuel Market Statistics, 2022-2032F
- Market Size & Growth Outlook
- By Revenues in USD Million
- By Volume in Billion Gallons
- Market Segmentation & Growth Outlook
- By Fuel Type- Market Insights and Forecast 2022-2032, USD Million
- By Production Technology- Market Insights and Forecast 2022-2032, USD Million
- By Feedstock- Market Insights and Forecast 2022-2032, USD Million
- By Blending Capacity- Market Insights and Forecast 2022-2032, USD Million
- By Application- Market Insights and Forecast 2022-2032, USD Million
- Market Size & Growth Outlook
- South Africa Sustainable Aviation Fuel Market Statistics, 2022-2032F
- Market Size & Growth Outlook
- By Revenues in USD Million
- By Volume in Billion Gallons
- Market Segmentation & Growth Outlook
- By Fuel Type- Market Insights and Forecast 2022-2032, USD Million
- By Production Technology- Market Insights and Forecast 2022-2032, USD Million
- By Feedstock- Market Insights and Forecast 2022-2032, USD Million
- By Blending Capacity- Market Insights and Forecast 2022-2032, USD Million
- By Application- Market Insights and Forecast 2022-2032, USD Million
- Market Size & Growth Outlook
- Egypt Sustainable Aviation Fuel Market Statistics, 2022-2032F
- Market Size & Growth Outlook
- By Revenues in USD Million
- By Volume in Billion Gallons
- Market Segmentation & Growth Outlook
- By Fuel Type- Market Insights and Forecast 2022-2032, USD Million
- By Production Technology- Market Insights and Forecast 2022-2032, USD Million
- By Feedstock- Market Insights and Forecast 2022-2032, USD Million
- By Blending Capacity- Market Insights and Forecast 2022-2032, USD Million
- By Application- Market Insights and Forecast 2022-2032, USD Million
- Market Size & Growth Outlook
- Market Size & Growth Outlook
- Asia Pacific Sustainable Aviation Fuel Market Statistics, 2022-2032F
- Market Size & Growth Outlook
- By Revenues in USD Million
- By Volume in Billion Gallons
- Market Segmentation & Growth Outlook
- By Fuel Type- Market Insights and Forecast 2022-2032, USD Million
- By Production Technology- Market Insights and Forecast 2022-2032, USD Million
- By Feedstock- Market Insights and Forecast 2022-2032, USD Million
- By Blending Capacity- Market Insights and Forecast 2022-2032, USD Million
- By Application- Market Insights and Forecast 2022-2032, USD Million
- By Country
- China
- India
- Japan
- Australia
- South Korea
- Thailand
- Indonesia
- Singapore
- Rest of Asia Pacific
- China Sustainable Aviation Fuel Market Statistics, 2022-2032F
- Market Size & Growth Outlook
- By Revenues in USD Million
- By Volume in Billion Gallons
- Market Segmentation & Growth Outlook
- By Fuel Type- Market Insights and Forecast 2022-2032, USD Million
- By Production Technology- Market Insights and Forecast 2022-2032, USD Million
- By Feedstock- Market Insights and Forecast 2022-2032, USD Million
- By Blending Capacity- Market Insights and Forecast 2022-2032, USD Million
- By Application- Market Insights and Forecast 2022-2032, USD Million
- Market Size & Growth Outlook
- India Sustainable Aviation Fuel Market Statistics, 2022-2032F
- Market Size & Growth Outlook
- By Revenues in USD Million
- By Volume in Billion Gallons
- Market Segmentation & Growth Outlook
- By Fuel Type- Market Insights and Forecast 2022-2032, USD Million
- By Production Technology- Market Insights and Forecast 2022-2032, USD Million
- By Feedstock- Market Insights and Forecast 2022-2032, USD Million
- By Blending Capacity- Market Insights and Forecast 2022-2032, USD Million
- By Application- Market Insights and Forecast 2022-2032, USD Million
- Market Size & Growth Outlook
- Japan Sustainable Aviation Fuel Market Statistics, 2022-2032F
- Market Size & Growth Outlook
- By Revenues in USD Million
- By Volume in Billion Gallons
- Market Segmentation & Growth Outlook
- By Fuel Type- Market Insights and Forecast 2022-2032, USD Million
- By Production Technology- Market Insights and Forecast 2022-2032, USD Million
- By Feedstock- Market Insights and Forecast 2022-2032, USD Million
- By Blending Capacity- Market Insights and Forecast 2022-2032, USD Million
- By Application- Market Insights and Forecast 2022-2032, USD Million
- Market Size & Growth Outlook
- Australia Sustainable Aviation Fuel Market Statistics, 2022-2032F
- Market Size & Growth Outlook
- By Revenues in USD Million
- By Volume in Billion Gallons
- Market Segmentation & Growth Outlook
- By Fuel Type- Market Insights and Forecast 2022-2032, USD Million
- By Production Technology- Market Insights and Forecast 2022-2032, USD Million
- By Feedstock- Market Insights and Forecast 2022-2032, USD Million
- By Blending Capacity- Market Insights and Forecast 2022-2032, USD Million
- By Application- Market Insights and Forecast 2022-2032, USD Million
- Market Size & Growth Outlook
- South Korea Sustainable Aviation Fuel Market Statistics, 2022-2032F
- Market Size & Growth Outlook
- By Revenues in USD Million
- By Volume in Billion Gallons
- Market Segmentation & Growth Outlook
- By Fuel Type- Market Insights and Forecast 2022-2032, USD Million
- By Production Technology- Market Insights and Forecast 2022-2032, USD Million
- By Feedstock- Market Insights and Forecast 2022-2032, USD Million
- By Blending Capacity- Market Insights and Forecast 2022-2032, USD Million
- By Application- Market Insights and Forecast 2022-2032, USD Million
- Market Size & Growth Outlook
- Thailand Sustainable Aviation Fuel Market Statistics, 2022-2032F
- Market Size & Growth Outlook
- By Revenues in USD Million
- By Volume in Billion Gallons
- Market Segmentation & Growth Outlook
- By Fuel Type- Market Insights and Forecast 2022-2032, USD Million
- By Production Technology- Market Insights and Forecast 2022-2032, USD Million
- By Feedstock- Market Insights and Forecast 2022-2032, USD Million
- By Blending Capacity- Market Insights and Forecast 2022-2032, USD Million
- By Application- Market Insights and Forecast 2022-2032, USD Million
- Market Size & Growth Outlook
- Indonesia Sustainable Aviation Fuel Market Statistics, 2022-2032F
- Market Size & Growth Outlook
- By Revenues in USD Million
- By Volume in Billion Gallons
- Market Segmentation & Growth Outlook
- By Fuel Type- Market Insights and Forecast 2022-2032, USD Million
- By Production Technology- Market Insights and Forecast 2022-2032, USD Million
- By Feedstock- Market Insights and Forecast 2022-2032, USD Million
- By Blending Capacity- Market Insights and Forecast 2022-2032, USD Million
- By Application- Market Insights and Forecast 2022-2032, USD Million
- Market Size & Growth Outlook
- Singapore Sustainable Aviation Fuel Market Statistics, 2022-2032F
- Market Size & Growth Outlook
- By Revenues in USD Million
- By Volume in Billion Gallons
- Market Segmentation & Growth Outlook
- By Fuel Type- Market Insights and Forecast 2022-2032, USD Million
- By Production Technology- Market Insights and Forecast 2022-2032, USD Million
- By Feedstock- Market Insights and Forecast 2022-2032, USD Million
- By Blending Capacity- Market Insights and Forecast 2022-2032, USD Million
- By Application- Market Insights and Forecast 2022-2032, USD Million
- Market Size & Growth Outlook
- Market Size & Growth Outlook
- Competitive Outlook
- Company Profiles
- Neste Corporation
- Business Description
- Product Portfolio
- Collaborations & Alliances
- Recent Developments
- Financial Details
- Others
- Diamond Green Diesel LLC
- Business Description
- Product Portfolio
- Collaborations & Alliances
- Recent Developments
- Financial Details
- Others
- Eni S.p.A.
- Business Description
- Product Portfolio
- Collaborations & Alliances
- Recent Developments
- Financial Details
- Others
- Phillips 66 Company
- Business Description
- Product Portfolio
- Collaborations & Alliances
- Recent Developments
- Financial Details
- Others
- TotalEnergies SE
- Business Description
- Product Portfolio
- Collaborations & Alliances
- Recent Developments
- Financial Details
- Others
- World Energy LLC
- Business Description
- Product Portfolio
- Collaborations & Alliances
- Recent Developments
- Financial Details
- Others
- Repsol S.A.
- Business Description
- Product Portfolio
- Collaborations & Alliances
- Recent Developments
- Financial Details
- Others
- China Petroleum & Chemical Corporation
- Business Description
- Product Portfolio
- Collaborations & Alliances
- Recent Developments
- Financial Details
- Others
- Shell plc
- Business Description
- Product Portfolio
- Collaborations & Alliances
- Recent Developments
- Financial Details
- Others
- Calumet Inc.
- Business Description
- Product Portfolio
- Collaborations & Alliances
- Recent Developments
- Financial Details
- Others
- Moeve S.A.
- Business Description
- Product Portfolio
- Collaborations & Alliances
- Recent Developments
- Financial Details
- Others
- OMV Aktiengesellschaft
- Business Description
- Product Portfolio
- Collaborations & Alliances
- Recent Developments
- Financial Details
- Others
- bp p.l.c.
- Business Description
- Product Portfolio
- Collaborations & Alliances
- Recent Developments
- Financial Details
- Others
- LanzaJet Inc.
- Business Description
- Product Portfolio
- Collaborations & Alliances
- Recent Developments
- Financial Details
- Others
- Neste Corporation
- Company Profiles
- Disclaimer
| Segment | Sub-Segment |
|---|---|
| By Fuel Type |
|
| By Production Technology |
|
| By Feedstock |
|
| By Blending Capacity |
|
| By Application |
|
| By Region |
|
Research Methodology
This study followed a structured approach comprising four key phases to assess the size and scope of the electro-oxidation market. The process began with thorough secondary research to collect data on the target market, related markets, and broader industry context. These findings, along with preliminary assumptions and estimates, were then validated through extensive primary research involving industry experts from across the value chain. To calculate the overall market size, both top-down and bottom-up methodologies were employed. Finally, market segmentation and data triangulation techniques were applied to refine and validate segment-level estimations.
Secondary Research
The secondary research phase involved gathering data from a wide range of credible and published sources. This step helped in identifying industry trends, defining market segmentation, and understanding the market landscape and value chain.
Sources consulted during this phase included:
- Company annual reports, investor presentations, and press releases
- Industry white papers and certified publications
- Trade directories and market-recognized databases
- Articles from authoritative authors and reputable journals
- Gold and silver standard websites
Secondary research was critical in mapping out the industry's value chain and monetary flow, identifying key market segments, understanding regional variations, and tracking significant industry developments.
Other key sources:
- Financial disclosures
- Industry associations and trade bodies
- News outlets and business magazines
- Academic journals and research studies
- Paid industry databases
Primary Research
To validate secondary data and gain deeper market insights, primary research was conducted with key stakeholders across both the supply and demand sides of the market.
On the demand side, participants included decision-makers and influencers from end-user industries—such as CIOs, CTOs, and CSOs—who provided first-hand perspectives on market needs, product usage, and future expectations.
On the supply side, interviews were conducted with manufacturers, industry associations, and institutional participants to gather insights into current offerings, product pipelines, and market challenges.
Primary interviews provided critical inputs such as:
- Market size and revenue data
- Product and service breakdowns
- Market forecasts
- Regional and application-specific trends
Stakeholders consulted included:
- Leading OEM and solution providers
- Channel and distribution partners
- End users across various applications
- Independent consultants and industry specialists
Market Size Estimation and Data Triangulation
- Identifying Key Market Participants (Secondary Research)
- Goal: To identify the major players or companies in the target market. This typically involves using publicly available data sources such as industry reports, market research publications, and financial statements of companies.
- Tools: Reports from firms like Gartner, Forrester, Euromonitor, Statista, IBISWorld, and others. Public financial statements, news articles, and press releases from top market players.
- Extracting Earnings of Key Market Participants
- Goal: To estimate the earnings generated from the product or service being analyzed. This step helps in understanding the revenue potential of each market player in a specific geography.
- Methods: Earnings data can be gathered from:
- Publicly available financial reports (for listed companies).
- Interviews and primary data sources from professionals, such as Directors, VPs, SVPs, etc. This is especially useful for understanding more nuanced, internal data that isn't publicly disclosed.
- Annual reports and investor presentations of key players.
- Data Collation and Development of a Relevant Data Model
- Goal: To collate inputs from both primary and secondary sources into a structured, data-driven model for market estimation. This model will incorporate key market KPIs and any independent variables relevant to the market.
- Key KPIs: These could include:
- Market size, growth rate, and demand drivers.
- Industry-specific metrics like market share, average revenue per customer (ARPC), or average deal size.
- External variables, such as economic growth rates, inflation rates, or commodity prices, that could affect the market.
- Data Modeling: Based on this data, the market forecasts are developed for the next 5 years. A combination of trend analysis, scenario modeling, and statistical regression might be used to generate projections.
- Scenario Analysis
- Goal: To test different assumptions and validate how sensitive the market is to changes in key variables (e.g., market demand, regulatory changes, technological disruptions).
- Types of Scenarios:
- Base Case: Based on current assumptions and historical data.
- Best-Case Scenario: Assuming favorable market conditions, regulatory environments, and technological advancements.
- Worst-Case Scenario: Accounting for adverse factors, such as economic downturns, stricter regulations, or unexpected disruptions.


