Global Food Additives Market Report: Trends, Growth and Forecast (2027-2033)
By Product Type (Flavors and Flavor Enhancers, Sweeteners, Preservatives, Antioxidants, Emulsifiers, Stabilizers, Thickeners, and Gelling Agents, Food Colorants, Acidulants and Acidity Regulators, Anticaking Agents, Food Enzymes, Other Additives), By Application (Bakery and Confectionery, Dairy Products and Frozen Desserts, Beverages, Meat and Poultry Products, Fish and Seafood Products, Soups, Sauces, Dressings, and Condiments, Snacks and Convenience Foods, Other Food Applications), By Region (North America, South America, Europe, Middle East & Africa, Asia Pacific) ... Read more
|
Major Players
|
Food Additives Market Overview
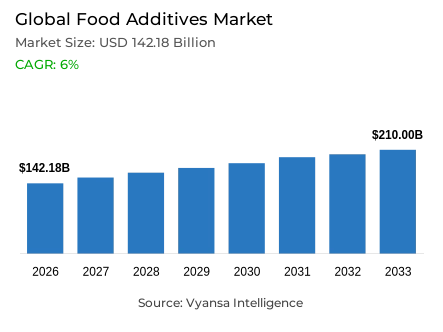
Food additives are the sweeteners, flavors, colors, texturants, preservatives and enzymes that manufacturers add to packaged food and beverages to hold taste, texture and shelf life constant across plants and seasons. Bakery, confectionery, dairy, beverage, meat, sauce and snack producers consume them as recurring recipe inputs. The Food Additives market is forecast to grow at a compound annual growth rate (CAGR) of 6% between 2027 and 2033.
Key Highlights of the Food Additives Market
- The market is estimated at USD 142.18 billion in 2026 and projected to reach USD 148 billion in 2027.
- Market value is forecast to reach USD 210 billion by 2033, expanding at a CAGR of 6% during 2027–2033.
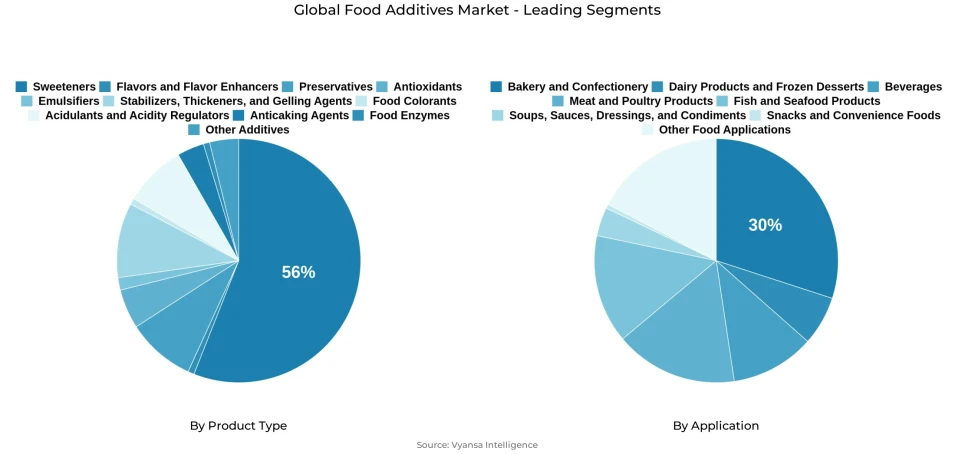
- By product type, Sweeteners are projected to lead with a 55.5% share in 2026.
- Food Colorants are the fastest-growing product type, with a projected CAGR of 8.44% during 2027–2033.
- By application, Bakery and Confectionery are projected to account for the largest share, at 30% in 2026.
- Snacks and Convenience Foods are the fastest-growing application, with a projected CAGR of 8.54% during 2027–2033.
- Asia Pacific is projected to lead with a 35% share in 2026 and record the fastest regional CAGR, at 6.67% during 2027–2033.
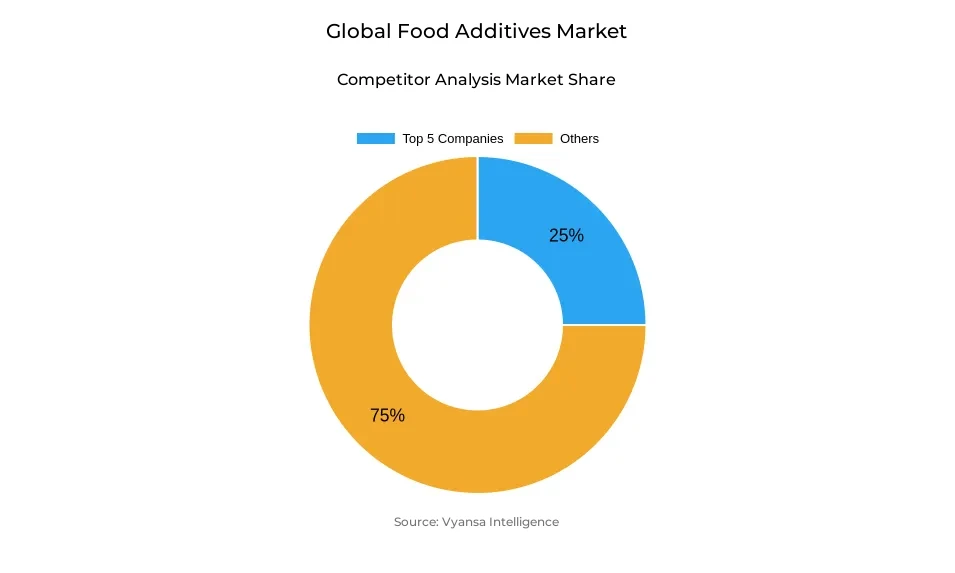
- The market is fragmented, with the five leading companies projected to hold a combined share of approximately 25% in 2026.
The Food Additives market is supported by expanding food production and the need to maintain taste, texture, appearance, and shelf life across large manufacturing networks. The OECD and FAO project global sugar consumption to increase approximately 1% annually to 199 million tons by 2035, demonstrating the continuing scale of bulk sweetener demand. The United Nations reported that cities housed 45% of the world’s 8.2 billion people in 2025, supporting a large consumer base for conveniently distributed foods.
Demand is also becoming more formulation-specific as manufacturers reduce sugar, replace colors, and adjust texture without compromising product acceptance. Roquette reports seven Food Innovation and Application Centers across France, the United States, China, Singapore, Japan, and India, supported by 370 scientists, developers, and engineers. This network illustrates how suppliers help manufacturers select, test, and scale ingredient combinations. FAO’s June 2026 assessment described food commodity conditions as relatively favorable, although energy and fertilizer volatility continued to influence input costs.
Growth opportunities remain geographically uneven. The OECD and FAO expect lower-middle-income countries, particularly India and Southeast Asian economies, to contribute approximately 39% of global agricultural consumption growth by 2035. Through 2033, higher processed-food output in developing markets and recipe upgrades in established markets should support additive demand. Suppliers combining reliable availability with effective formulation support should be best positioned to convert these needs into recurring purchases.
Food Additives Market Drivers
Sugar Taxes and Nutrition Labels Expand Reformulation Demand
Nutrition policies are encouraging manufacturers to reconsider sweetness, bulk, mouthfeel, and flavor together. Removing sugar changes several product characteristics, creating opportunities for combinations of high-intensity sweeteners, polyols, texturants, and flavor modulators.
WHO’s January 2026 assessment reported that 114 countries taxed sugar-sweetened carbonated beverages in 2024, although only eight used sugar-content-based specific taxes. This distinction matters commercially: sugar-linked thresholds provide a clearer incentive to change recipes than taxes based solely on beverage volume or price.
Lithuania introduced beverage excise duties in January 2026 covering drinks exceeding 2.5 g of added sugar per 100 ml and drinks containing added sweeteners. Because sweetener-only beverages are also covered, manufacturers must consider the complete formulation and tax treatment. In India, proposed front-of-pack warnings discussed in September 2026 could extend reformulation pressure across packaged foods high in sugar, fat, or salt if adopted.
Through 2033, differing national requirements should sustain demand for application-specific reformulation. Suppliers that preserve taste and processing performance while meeting local nutrition objectives should be better positioned to secure recurring ingredient specifications.
Food Additives Market Challenges
Changing Eating Patterns Pressure Volume Growth in Established Markets
Reduced purchasing of calorie-dense foods can limit demand for ingredients supplied primarily according to production volume. GLP-1 medication adoption adds to this pressure in markets where manufacturers already face demand for smaller portions and more selective snacking.
Research reported by Cornell University in December 2025 found that U.S. households reduced grocery spending by an average of 5.3% within six months of starting GLP-1 medication. Spending on savory snacks declined approximately 10%, while limited-service restaurant spending fell about 8%. These expenditure changes indicate pressure on relevant food categories, although their effect on additive tonnage also depends on prices, recipes, and purchase quantities.
The trend extends beyond the United States. A UCL study published in January 2026 estimated that 1.6 million adults in Great Britain had used GLP-1-based medications for weight loss during the preceding year. A further 3.3 million expressed interest in future use.
Through 2033, suppliers serving affected categories may face slower volume growth even as demand increases for protein-compatible flavors, texture systems, and portion-focused products. Maintaining value will depend partly on supplying formulations that meet changing consumption needs.
Food Additives Market Recent Trends
Integrated Ingredient Systems Gain Ground in Product Development
Food manufacturers increasingly evaluate ingredients as coordinated systems that deliver sweetness, texture, flavor, and stability together. This approach gives suppliers a larger role in recipe development and can reduce the number of separate qualification projects required for a product launch.
In June 2026, Ingredion announced a recommended acquisition of Tate & Lyle to combine complementary capabilities in texturizing, sweetening, and fortification. Shareholders approved the proposal in July, with completion expected in the second half of 2027, subject to remaining conditions. Ingredion’s existing customer reach across more than 120 countries gives the proposed combination international relevance.
Application support is expanding across regions. Kerry opened a customer co-creation center in Medellín, Colombia, in February 2026. That month, Brenntag opened an Innovation & Application Center in Mumbai, India, incorporating formulation, blending, analytical testing, and category-specific development capabilities.
Through 2033, suppliers that validate complete ingredient combinations should gain more influence over procurement specifications. Once adopted at commercial scale, effective systems can support repeat purchases and make supplier changes more technically demanding.
AI Platforms Accelerate Ingredient Screening and Formulation
AI is expanding suppliers’ ability to connect ingredient properties, historical recipes, sensory findings, and consumer preferences before physical testing. The commercial opportunity lies in identifying promising combinations earlier and directing laboratory work toward fewer, more relevant prototypes.
In May 2026, Cargill’s digital and AI leadership described using ingredient informatics and sensory technologies to compress some formulation cycles from months to days. Its AskEmma platform draws on historical development concepts, trend information, consumer insights, and testing feedback. This is a supplier-reported capability rather than a universal development-time benchmark.
Symrise expanded Symvision AI in October 2026 into four connected functions: Trend, Consumer, Concept, and Design. The platform combines information across markets with proprietary sensory and flavor expertise. Ingredion also introduced Ask Ingredion in July 2026, connecting technical knowledge, product data, and application guidance through its customer portal.
Through 2033, these tools should strengthen suppliers’ involvement at the specification stage. Commercial gains will depend on translating digital recommendations into formulations that perform consistently during processing, storage, and consumption.
Food Additives Market Future Opportunities
Stable Natural Colors Create Additional Replacement Opportunities
Natural blue, green, and white color systems offer opportunities where manufacturers need alternatives that withstand acidity, heat, light, and storage. Commercial success requires suitable pigment performance, permitted uses, and dependable raw-material availability.
In May 2025, the U.S. FDA granted three color-additive petitions covering galdieria extract blue, calcium phosphate, and expanded uses of butterfly pea flower extract. These decisions widened formulation options for specified food applications. In Europe, EFSA issued a favorable safety opinion on blue galdieria extract in March 2026. Givaudan’s Everzure Galdieria is positioned as an acid-stable alternative to Brilliant Blue FCF, although a favorable safety opinion is a step toward authorization rather than authorization itself.
Brand reformulation demonstrates commercial adoption. Nestlé USA completed removal of FD&C colors from its U.S. food and beverage portfolio in June 2026. Its foodservice transition included more than 20 Vitality beverage offerings over five months. General Mills and Kraft Heinz have also committed to removing certified colors from their respective U.S. retail portfolios by the end of 2027.
Through 2033, suppliers combining pigment stability, scalable production, and regional regulatory support should be best positioned to convert replacement programs into contracted demand.
Unlock Market Intelligence
Explore the market potential with our data-driven report
Food Additives Market Segmentation Analysis
By Product Type
- Flavors and Flavor Enhancers
- Sweeteners
- Preservatives
- Antioxidants
- Emulsifiers
- Stabilizers, Thickeners, and Gelling Agents
- Food Colorants
- Acidulants and Acidity Regulators
- Anticaking Agents
- Food Enzymes
- Other Additives
Sweeteners Command 55.5% of Product Type Demand as Sugar Reduction Rebuilds Recipes
Sweeteners lead because they carry sweetness, bulk and mouthfeel in the highest-volume recipes, so sugar reduction swaps one sweetening system for another instead of removing the load. Supply security is the second cause. In February 2026, Tate & Lyle PLC and Manus launched Yume M, a stevia rebaudioside M sweetener made at Manus's Augusta, Georgia facility with an all-Americas traceable supply chain and Tate & Lyle's formulation support, giving high-intensity sweeteners a secured route into large manufacturers' recipes. The lead holds through the forecast period unless taxes on sweetener-only drinks spread across more large economies.
Food Colorants grow at a CAGR of 8.44% across 2027 to 2033 as brands replace synthetic dyes with natural pigments. Capacity is following. Sensient Technologies Corporation broke ground on 23 March 2026 on a 28,800 square foot addition to its St. Louis natural colour plant within a programme of up to USD 250 million, and California Natural Color began an expansion in August 2026 to lift Fresno capacity by about 300%. Colorants outgrow sweeteners because each replaced dye creates new pigment demand from a small base, while sweetener growth follows total food output.
By Application
- Bakery and Confectionery
- Dairy Products and Frozen Desserts
- Beverages
- Meat and Poultry Products
- Fish and Seafood Products
- Soups, Sauces, Dressings, and Condiments
- Snacks and Convenience Foods
- Other Food Applications
Bakery and Confectionery Takes 30% of Application Demand as Every Recipe Needs Several Additives
Bakery and Confectionery leads because one recipe calls on several additive functions at once, including sweeteners, emulsifiers, enzymes, preservatives and colours, which keeps additive consumption in each batch high. Cost is the second cause. Novonesis A/S, formerly Novozymes A/S, launched Optiva LS Prime in June 2025, an enzyme solution that lets bakers cut added sugar by up to 50% at a time when the company says sugar prices have risen more than 50% since 2019. The lead holds through the forecast period unless spending shifts faster into snack formats.
Snacks and Convenience Foods grow at a CAGR of 8.54% across 2027 to 2033 as seasoning, flavour and texture systems are specified for each added snack and ready-to-eat product. Givaudan International SA opened a 24,000 square metre plant in Cikarang, Indonesia on 3 July 2026 to make savoury, sweet and snack flavour powders, bringing local supply closer to Southeast Asian snack producers. Snacks outgrow bakery because flavour systems are specified product by product in a category adding products faster than established bakery recipes change.
Unlock Market Intelligence
Explore the market potential with our data-driven report
Food Additives Market Regional Analysis
Asia Pacific Leads and Records the Fastest Growth
Asia Pacific is projected to hold a 35% share in 2027 and expand at a CAGR of 6.67% during 2027–2033. Growth is supported by food-processing expansion, a broad manufacturing base, and increasing demand for packaged products across several large economies.
India’s food-processing production-linked incentive scheme covered 165 approved applications across 274 project locations by February 2026. The government reported approximately 3.4 million tons of annual processing and preservation capacity created under the scheme, alongside more than 329,000 direct and indirect jobs. The capacity figure provides a stronger connection to potential ingredient procurement than project approvals alone.
Indonesia’s food and beverage manufacturing sector grew 6.77% in the first half of 2026, supporting additional opportunities for flavors, sweeteners, emulsifiers, and preservation systems. Through 2033, suppliers with local inventories and application teams should be better positioned to serve both expanding domestic manufacturers and regional export-oriented processors.

Food Additives Market Competitive Landscape
The supply base for food additives is fragmented, with the top five companies holding a combined share of approximately 25% in 2026 across the industry. The five companies carried into Company Profiling, in order of market presence, are Kerry Group plc, International Flavors & Fragrances Inc., Archer-Daniels-Midland Company, Cargill, Incorporated and DSM-Firmenich AG. The share is stated for 2027, consistent with the base year used across this report.
Key Companies in the Food Additives Market
- Kerry Group plc
- International Flavors & Fragrances Inc.
- Ingredion Incorporated
- Givaudan International SA
- Ajinomoto Co., Inc.
- Archer-Daniels-Midland Company
- Cargill, Incorporated
- DSM-Firmenich AG
- Tate & Lyle PLC
- Symrise AG
- Roquette Frères S.A.
- Novonesis A/S
- Fufeng Group Limited
- Döhler GmbH
- Sensient Technologies Corporation
Company Profiling
Kerry Group plc: Kerry supplies taste, preservation, enzyme, and nutrition systems for food and beverage manufacturers. Its portfolio supports flavor development, sugar and sodium reduction, and product stability across multiple applications. In October 2026, Kerry announced the opening of its Bethlehem, Pennsylvania, coffee extraction facility, featuring independent hot- and cold-brew extraction lines. The site produces formulation-specific coffee taste ingredients for ready-to-drink beverages, alcoholic drinks, ice cream, and savory sauces.
International Flavors & Fragrances Inc.: IFF supplies flavors, taste solutions, texturants, emulsifiers, sweeteners, and other functional food ingredients. Its December 2025 filing reported 112 plants across the wider company, comprising 86 owned and 26 leased facilities. In May 2026, IFF agreed to sell its Food Ingredients business to CVC, reorganizing ownership of a portfolio serving functional food applications while maintaining its broader taste activities. The announcement concerns an agreed transaction rather than a completed transfer.
Archer-Daniels-Midland Company: ADM supplies sweeteners, starches, flavors, natural colors, emulsifiers, polyols, fibers, and other formulation ingredients through its nutrition and carbohydrate businesses. Its capabilities combine agricultural sourcing with ingredient processing and application development. In August 2026, ADM reported signing two contracts to replace artificial red, yellow, and orange shades with natural alternatives, covering a packaged-food line and flavored beverages. These contracts connect its color portfolio directly with commercial reformulation programs.
Cargill, Incorporated: Cargill supplies sweeteners, starches, texturants, hydrocolloids, and lecithin for beverage, dairy, confectionery, bakery, and other food applications. Its portfolio includes ingredients used to manage sweetness, viscosity, emulsification, and product structure. In April 2026, Cargill reported modernization at its Baupte, France, hydrocolloid facility, reducing total site carbon emissions by approximately 45%. The upgrade supports the operating efficiency and long-term reliability of a production site supplying carrageenan and xanthan gum.
DSM-Firmenich AG: DSM-Firmenich supplies flavors, food enzymes, texturizing ingredients, and sugar-reduction solutions through its Taste, Texture and Health business. The wider company operates in almost 60 countries, supporting customer development across regional markets. In September 2026, it partnered with Boltz to apply AI models to ingredient discovery using its taste and odor receptor data. The collaboration targets the prediction and design of new flavor molecules, connecting molecular research with future formulation capabilities.
Recent Developments in the Food Additives Market
- In February 2026, China’s National Health Commission approved 11 new food additives under Announcement No. 1, widening the permitted ingredient list for domestic and export-oriented formulators.
- In May 2026, International Flavors & Fragrances Inc. agreed to sell its texturant and emulsifier business to CVC Capital Partners for approximately USD 3.8 billion in net cash, closing by the second quarter of 2027.
- In June 2026, Ingredion Incorporated agreed to acquire Tate & Lyle PLC, valued at about USD 3.6 billion, creating a larger sweetener and texturant supplier, with completion expected in the second half of 2027.
Frequently Asked Questions
Related Report
- Market Segmentation
- Research Scope
- Research Methodology
- Definitions and Assumptions
- Executive Summary
- Global Food Additives Market Policies, Regulations, and Standards
- Global Food Additives Market Dynamics
- Growth Factors
- Challenges
- Trends
- Opportunities
- Global Food Additives Market Statistics, 2023-2033F
- Market Size & Growth Outlook
- By Revenues in USD Million
- Market Segmentation & Growth Outlook
- By Product Type
- Flavors and Flavor Enhancers- Market Insights and Forecast 2023-2033, USD Million
- Sweeteners- Market Insights and Forecast 2023-2033, USD Million
- Preservatives- Market Insights and Forecast 2023-2033, USD Million
- Antioxidants- Market Insights and Forecast 2023-2033, USD Million
- Emulsifiers- Market Insights and Forecast 2023-2033, USD Million
- Stabilizers, Thickeners, and Gelling Agents- Market Insights and Forecast 2023-2033, USD Million
- Food Colorants- Market Insights and Forecast 2023-2033, USD Million
- Acidulants and Acidity Regulators- Market Insights and Forecast 2023-2033, USD Million
- Anticaking Agents- Market Insights and Forecast 2023-2033, USD Million
- Food Enzymes- Market Insights and Forecast 2023-2033, USD Million
- Other Additives- Market Insights and Forecast 2023-2033, USD Million
- By Application
- Bakery and Confectionery- Market Insights and Forecast 2023-2033, USD Million
- Dairy Products and Frozen Desserts- Market Insights and Forecast 2023-2033, USD Million
- Beverages- Market Insights and Forecast 2023-2033, USD Million
- Meat and Poultry Products- Market Insights and Forecast 2023-2033, USD Million
- Fish and Seafood Products- Market Insights and Forecast 2023-2033, USD Million
- Soups, Sauces, Dressings, and Condiments- Market Insights and Forecast 2023-2033, USD Million
- Snacks and Convenience Foods- Market Insights and Forecast 2023-2033, USD Million
- Other Food Applications- Market Insights and Forecast 2023-2033, USD Million
- By Region
- North America
- South America
- Europe
- Middle East & Africa
- Asia Pacific
- By Competitors
- Competition Characteristics
- Market Share & Analysis
- By Product Type
- Market Size & Growth Outlook
- North America Food Additives Market Statistics, 2023-2033F
- Market Size & Growth Outlook
- By Revenues in USD Million
- Market Segmentation & Growth Outlook
- By Product Type- Market Insights and Forecast 2023-2033, USD Million
- By Application- Market Insights and Forecast 2023-2033, USD Million
- By Country
- The US
- Canada
- Mexico
- The US Food Additives Market Statistics, 2023-2033F
- Market Size & Growth Outlook
- By Revenues in USD Million
- Market Segmentation & Growth Outlook
- By Product Type- Market Insights and Forecast 2023-2033, USD Million
- By Application- Market Insights and Forecast 2023-2033, USD Million
- Market Size & Growth Outlook
- Canada Food Additives Market Statistics, 2023-2033F
- Market Size & Growth Outlook
- By Revenues in USD Million
- Market Segmentation & Growth Outlook
- By Product Type- Market Insights and Forecast 2023-2033, USD Million
- By Application- Market Insights and Forecast 2023-2033, USD Million
- Market Size & Growth Outlook
- Mexico Food Additives Market Statistics, 2023-2033F
- Market Size & Growth Outlook
- By Revenues in USD Million
- Market Segmentation & Growth Outlook
- By Product Type- Market Insights and Forecast 2023-2033, USD Million
- By Application- Market Insights and Forecast 2023-2033, USD Million
- Market Size & Growth Outlook
- Market Size & Growth Outlook
- South America Food Additives Market Statistics, 2023-2033F
- Market Size & Growth Outlook
- By Revenues in USD Million
- Market Segmentation & Growth Outlook
- By Product Type- Market Insights and Forecast 2023-2033, USD Million
- By Application- Market Insights and Forecast 2023-2033, USD Million
- By Country
- Brazil
- Argentina
- Chile
- Rest of South America
- Brazil Food Additives Market Statistics, 2023-2033F
- Market Size & Growth Outlook
- By Revenues in USD Million
- Market Segmentation & Growth Outlook
- By Product Type- Market Insights and Forecast 2023-2033, USD Million
- By Application- Market Insights and Forecast 2023-2033, USD Million
- Market Size & Growth Outlook
- Argentina Food Additives Market Statistics, 2023-2033F
- Market Size & Growth Outlook
- By Revenues in USD Million
- Market Segmentation & Growth Outlook
- By Product Type- Market Insights and Forecast 2023-2033, USD Million
- By Application- Market Insights and Forecast 2023-2033, USD Million
- Market Size & Growth Outlook
- Chile Food Additives Market Statistics, 2023-2033F
- Market Size & Growth Outlook
- By Revenues in USD Million
- Market Segmentation & Growth Outlook
- By Product Type- Market Insights and Forecast 2023-2033, USD Million
- By Application- Market Insights and Forecast 2023-2033, USD Million
- Market Size & Growth Outlook
- Market Size & Growth Outlook
- Europe Food Additives Market Statistics, 2023-2033F
- Market Size & Growth Outlook
- By Revenues in USD Million
- Market Segmentation & Growth Outlook
- By Product Type- Market Insights and Forecast 2023-2033, USD Million
- By Application- Market Insights and Forecast 2023-2033, USD Million
- By Country
- Germany
- The UK
- France
- Italy
- Spain
- BENELUX
- Nordics
- Rest of Europe
- Germany Food Additives Market Statistics, 2023-2033F
- Market Size & Growth Outlook
- By Revenues in USD Million
- Market Segmentation & Growth Outlook
- By Product Type- Market Insights and Forecast 2023-2033, USD Million
- By Application- Market Insights and Forecast 2023-2033, USD Million
- Market Size & Growth Outlook
- The UK Food Additives Market Statistics, 2023-2033F
- Market Size & Growth Outlook
- By Revenues in USD Million
- Market Segmentation & Growth Outlook
- By Product Type- Market Insights and Forecast 2023-2033, USD Million
- By Application- Market Insights and Forecast 2023-2033, USD Million
- Market Size & Growth Outlook
- France Food Additives Market Statistics, 2023-2033F
- Market Size & Growth Outlook
- By Revenues in USD Million
- Market Segmentation & Growth Outlook
- By Product Type- Market Insights and Forecast 2023-2033, USD Million
- By Application- Market Insights and Forecast 2023-2033, USD Million
- Market Size & Growth Outlook
- Italy Food Additives Market Statistics, 2023-2033F
- Market Size & Growth Outlook
- By Revenues in USD Million
- Market Segmentation & Growth Outlook
- By Product Type- Market Insights and Forecast 2023-2033, USD Million
- By Application- Market Insights and Forecast 2023-2033, USD Million
- Market Size & Growth Outlook
- Spain Food Additives Market Statistics, 2023-2033F
- Market Size & Growth Outlook
- By Revenues in USD Million
- Market Segmentation & Growth Outlook
- By Product Type- Market Insights and Forecast 2023-2033, USD Million
- By Application- Market Insights and Forecast 2023-2033, USD Million
- Market Size & Growth Outlook
- BENELUX Food Additives Market Statistics, 2023-2033F
- Market Size & Growth Outlook
- By Revenues in USD Million
- Market Segmentation & Growth Outlook
- By Product Type- Market Insights and Forecast 2023-2033, USD Million
- By Application- Market Insights and Forecast 2023-2033, USD Million
- Market Size & Growth Outlook
- Nordics Food Additives Market Statistics, 2023-2033F
- Market Size & Growth Outlook
- By Revenues in USD Million
- Market Segmentation & Growth Outlook
- By Product Type- Market Insights and Forecast 2023-2033, USD Million
- By Application- Market Insights and Forecast 2023-2033, USD Million
- Market Size & Growth Outlook
- Market Size & Growth Outlook
- Middle East & Africa Food Additives Market Statistics, 2023-2033F
- Market Size & Growth Outlook
- By Revenues in USD Million
- Market Segmentation & Growth Outlook
- By Product Type- Market Insights and Forecast 2023-2033, USD Million
- By Application- Market Insights and Forecast 2023-2033, USD Million
- By Country
- UAE
- Saudi Arabia
- South Africa
- Turkey
- Rest of Middle East & Africa
- UAE Food Additives Market Statistics, 2023-2033F
- Market Size & Growth Outlook
- By Revenues in USD Million
- Market Segmentation & Growth Outlook
- By Product Type- Market Insights and Forecast 2023-2033, USD Million
- By Application- Market Insights and Forecast 2023-2033, USD Million
- Market Size & Growth Outlook
- Saudi Arabia Food Additives Market Statistics, 2023-2033F
- Market Size & Growth Outlook
- By Revenues in USD Million
- Market Segmentation & Growth Outlook
- By Product Type- Market Insights and Forecast 2023-2033, USD Million
- By Application- Market Insights and Forecast 2023-2033, USD Million
- Market Size & Growth Outlook
- South Africa Food Additives Market Statistics, 2023-2033F
- Market Size & Growth Outlook
- By Revenues in USD Million
- Market Segmentation & Growth Outlook
- By Product Type- Market Insights and Forecast 2023-2033, USD Million
- By Application- Market Insights and Forecast 2023-2033, USD Million
- Market Size & Growth Outlook
- Turkey Food Additives Market Statistics, 2023-2033F
- Market Size & Growth Outlook
- By Revenues in USD Million
- Market Segmentation & Growth Outlook
- By Product Type- Market Insights and Forecast 2023-2033, USD Million
- By Application- Market Insights and Forecast 2023-2033, USD Million
- Market Size & Growth Outlook
- Market Size & Growth Outlook
- Asia Pacific Food Additives Market Statistics, 2023-2033F
- Market Size & Growth Outlook
- By Revenues in USD Million
- Market Segmentation & Growth Outlook
- By Product Type- Market Insights and Forecast 2023-2033, USD Million
- By Application- Market Insights and Forecast 2023-2033, USD Million
- By Country
- China
- India
- Japan
- South Korea
- Australia
- Southeast Asia
- Rest of Asia Pacific
- China Food Additives Market Statistics, 2023-2033F
- Market Size & Growth Outlook
- By Revenues in USD Million
- Market Segmentation & Growth Outlook
- By Product Type- Market Insights and Forecast 2023-2033, USD Million
- By Application- Market Insights and Forecast 2023-2033, USD Million
- Market Size & Growth Outlook
- India Food Additives Market Statistics, 2023-2033F
- Market Size & Growth Outlook
- By Revenues in USD Million
- Market Segmentation & Growth Outlook
- By Product Type- Market Insights and Forecast 2023-2033, USD Million
- By Application- Market Insights and Forecast 2023-2033, USD Million
- Market Size & Growth Outlook
- Japan Food Additives Market Statistics, 2023-2033F
- Market Size & Growth Outlook
- By Revenues in USD Million
- Market Segmentation & Growth Outlook
- By Product Type- Market Insights and Forecast 2023-2033, USD Million
- By Application- Market Insights and Forecast 2023-2033, USD Million
- Market Size & Growth Outlook
- South Korea Food Additives Market Statistics, 2023-2033F
- Market Size & Growth Outlook
- By Revenues in USD Million
- Market Segmentation & Growth Outlook
- By Product Type- Market Insights and Forecast 2023-2033, USD Million
- By Application- Market Insights and Forecast 2023-2033, USD Million
- Market Size & Growth Outlook
- Australia Food Additives Market Statistics, 2023-2033F
- Market Size & Growth Outlook
- By Revenues in USD Million
- Market Segmentation & Growth Outlook
- By Product Type- Market Insights and Forecast 2023-2033, USD Million
- By Application- Market Insights and Forecast 2023-2033, USD Million
- Market Size & Growth Outlook
- Southeast Asia Food Additives Market Statistics, 2023-2033F
- Market Size & Growth Outlook
- By Revenues in USD Million
- Market Segmentation & Growth Outlook
- By Product Type- Market Insights and Forecast 2023-2033, USD Million
- By Application- Market Insights and Forecast 2023-2033, USD Million
- Market Size & Growth Outlook
- Market Size & Growth Outlook
- Competitive Outlook
- Company Profiles
- Kerry Group plc
- Business Description
- Product Portfolio
- Collaborations & Alliances
- Recent Developments
- Financial Details
- Others
- International Flavors & Fragrances Inc.
- Business Description
- Product Portfolio
- Collaborations & Alliances
- Recent Developments
- Financial Details
- Others
- Archer Daniels Midland Company
- Business Description
- Product Portfolio
- Collaborations & Alliances
- Recent Developments
- Financial Details
- Others
- Cargill, Incorporated
- Business Description
- Product Portfolio
- Collaborations & Alliances
- Recent Developments
- Financial Details
- Others
- DSM-Firmenich AG
- Business Description
- Product Portfolio
- Collaborations & Alliances
- Recent Developments
- Financial Details
- Others
- Ingredion Incorporated
- Business Description
- Product Portfolio
- Collaborations & Alliances
- Recent Developments
- Financial Details
- Others
- Givaudan International SA
- Business Description
- Product Portfolio
- Collaborations & Alliances
- Recent Developments
- Financial Details
- Others
- Ajinomoto Co., Inc.
- Business Description
- Product Portfolio
- Collaborations & Alliances
- Recent Developments
- Financial Details
- Others
- Tate & Lyle plc
- Business Description
- Product Portfolio
- Collaborations & Alliances
- Recent Developments
- Financial Details
- Others
- Symrise AG
- Business Description
- Product Portfolio
- Collaborations & Alliances
- Recent Developments
- Financial Details
- Others
- Roquette Frères S.A.
- Business Description
- Product Portfolio
- Collaborations & Alliances
- Recent Developments
- Financial Details
- Others
- Novozymes A/S
- Business Description
- Product Portfolio
- Collaborations & Alliances
- Recent Developments
- Financial Details
- Others
- Fufeng Group Limited
- Business Description
- Product Portfolio
- Collaborations & Alliances
- Recent Developments
- Financial Details
- Others
- Döhler GmbH
- Business Description
- Product Portfolio
- Collaborations & Alliances
- Recent Developments
- Financial Details
- Others
- Sensient Technologies Corporation
- Business Description
- Product Portfolio
- Collaborations & Alliances
- Recent Developments
- Financial Details
- Others
- Kerry Group plc
- Company Profiles
- Disclaimer
| Segment | Sub-Segment |
|---|---|
| By Product Type |
|
| By Application |
|
| By Region |
|
Research Methodology
This study followed a structured approach comprising four key phases to assess the size and scope of the electro-oxidation market. The process began with thorough secondary research to collect data on the target market, related markets, and broader industry context. These findings, along with preliminary assumptions and estimates, were then validated through extensive primary research involving industry experts from across the value chain. To calculate the overall market size, both top-down and bottom-up methodologies were employed. Finally, market segmentation and data triangulation techniques were applied to refine and validate segment-level estimations.
Secondary Research
The secondary research phase involved gathering data from a wide range of credible and published sources. This step helped in identifying industry trends, defining market segmentation, and understanding the market landscape and value chain.
Sources consulted during this phase included:
- Company annual reports, investor presentations, and press releases
- Industry white papers and certified publications
- Trade directories and market-recognized databases
- Articles from authoritative authors and reputable journals
- Gold and silver standard websites
Secondary research was critical in mapping out the industry's value chain and monetary flow, identifying key market segments, understanding regional variations, and tracking significant industry developments.
Other key sources:
- Financial disclosures
- Industry associations and trade bodies
- News outlets and business magazines
- Academic journals and research studies
- Paid industry databases
Primary Research
To validate secondary data and gain deeper market insights, primary research was conducted with key stakeholders across both the supply and demand sides of the market.
On the demand side, participants included decision-makers and influencers from end-user industries—such as CIOs, CTOs, and CSOs—who provided first-hand perspectives on market needs, product usage, and future expectations.
On the supply side, interviews were conducted with manufacturers, industry associations, and institutional participants to gather insights into current offerings, product pipelines, and market challenges.
Primary interviews provided critical inputs such as:
- Market size and revenue data
- Product and service breakdowns
- Market forecasts
- Regional and application-specific trends
Stakeholders consulted included:
- Leading OEM and solution providers
- Channel and distribution partners
- End users across various applications
- Independent consultants and industry specialists
Market Size Estimation and Data Triangulation
- Identifying Key Market Participants (Secondary Research)
- Goal: To identify the major players or companies in the target market. This typically involves using publicly available data sources such as industry reports, market research publications, and financial statements of companies.
- Tools: Reports from firms like Gartner, Forrester, Euromonitor, Statista, IBISWorld, and others. Public financial statements, news articles, and press releases from top market players.
- Extracting Earnings of Key Market Participants
- Goal: To estimate the earnings generated from the product or service being analyzed. This step helps in understanding the revenue potential of each market player in a specific geography.
- Methods: Earnings data can be gathered from:
- Publicly available financial reports (for listed companies).
- Interviews and primary data sources from professionals, such as Directors, VPs, SVPs, etc. This is especially useful for understanding more nuanced, internal data that isn't publicly disclosed.
- Annual reports and investor presentations of key players.
- Data Collation and Development of a Relevant Data Model
- Goal: To collate inputs from both primary and secondary sources into a structured, data-driven model for market estimation. This model will incorporate key market KPIs and any independent variables relevant to the market.
- Key KPIs: These could include:
- Market size, growth rate, and demand drivers.
- Industry-specific metrics like market share, average revenue per customer (ARPC), or average deal size.
- External variables, such as economic growth rates, inflation rates, or commodity prices, that could affect the market.
- Data Modeling: Based on this data, the market forecasts are developed for the next 5 years. A combination of trend analysis, scenario modeling, and statistical regression might be used to generate projections.
- Scenario Analysis
- Goal: To test different assumptions and validate how sensitive the market is to changes in key variables (e.g., market demand, regulatory changes, technological disruptions).
- Types of Scenarios:
- Base Case: Based on current assumptions and historical data.
- Best-Case Scenario: Assuming favorable market conditions, regulatory environments, and technological advancements.
- Worst-Case Scenario: Accounting for adverse factors, such as economic downturns, stricter regulations, or unexpected disruptions.