Ethiopia Dairy Market Report: Trends, Growth and Forecast (2027-2033)
By Product Type (Butter (Salted Butter, Unsalted Butter, Others), Cheese (Natural Cheese (Ayib & Fresh Cheese, Gouda, Mozzarella, Other Natural Cheese), Processed Cheese), Cream (Fresh Cream, Cooking Cream, Whipping Cream, Others), Dairy Desserts (Ice Cream, Frozen Dairy Desserts, Others), Milk (Fresh & Pasteurized Milk, UHT Milk, Flavored Milk, Condensed Milk, Powdered Milk), Yogurt (Drinkable Yogurt, Spoonable Yogurt), Sour & Fermented Milk Drinks (Ergo & Other Fermented Milk, Buttermilk, Others), Others), By Distribution Channel (Traditional Grocery & Convenience Retailers, Supermarkets & Hypermarkets, Direct Sales & Milk Agents, Foodservice & Institutional, Online Retail, Others) ... Read more
|
Major Players
|
Ethiopia Dairy Market Overview
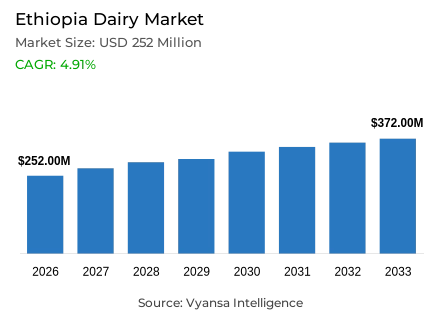
Dairy in Ethiopia spans fresh and processed milk, butter, cheese, yogurt, and other fermented products sold through formal retail and institutional channels, alongside a much larger volume of milk still traded through informal, household-level supply. Households, foodservice operators and modern retailers consume branded dairy for daily nutrition, beverages and cooking. The Ethiopia dairy market is forecast to grow at a CAGR of 4.91% between 2027 and 2033.
Key Highlights of the Ethiopia Dairy Market
- The market was valued at USD 252 million in 2026 and is estimated at USD 279 million in 2027 and USD 372 million in 2033.
- The market is to grow with a stated CAGR of 4.91% for 2027–2033.
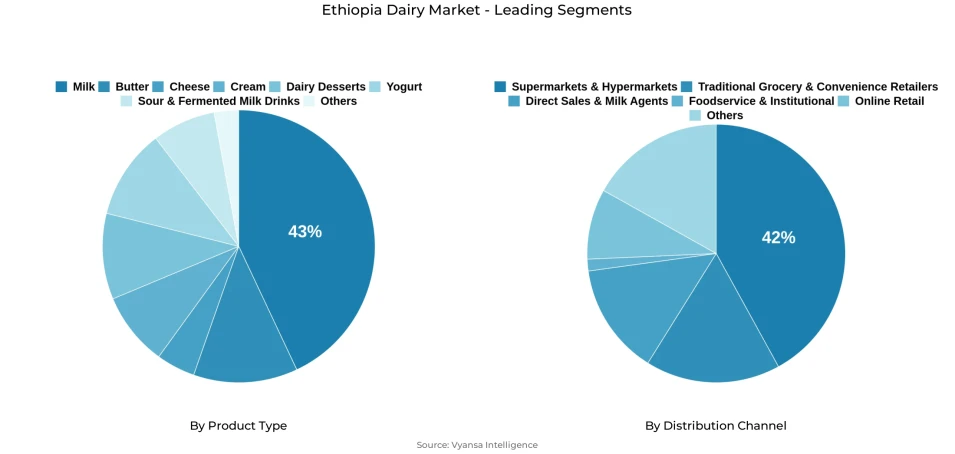
- Milk is projected to lead product sales with a 43% share in 2026.
- Yogurt is projected to be the fastest-growing product segment, at an 8.66% CAGR during 2027–2033.
- Supermarkets and hypermarkets are projected to lead distribution with a 42% share in 2026.
- Online retail is projected to be the fastest-growing channel, at a 21.97% CAGR during 2027–2033.
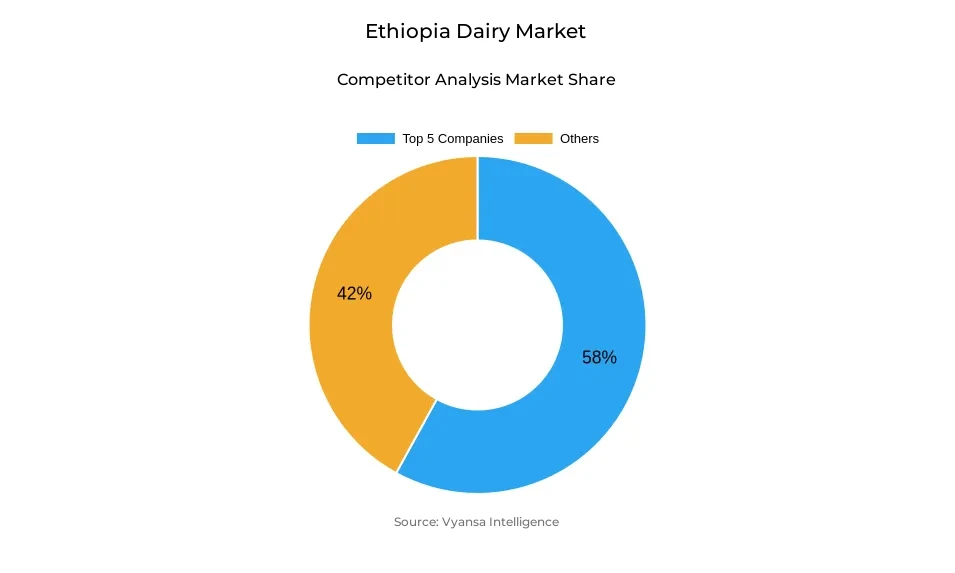
- The market is consolidated, with the combined share of the five leading companies at 58% in 2026.
Ethiopia’s dairy market encompasses milk, butter, cheese, yogurt, ice cream, and other dairy products supplied to household and commercial consumers. A substantial volume of milk continues to be consumed or traded outside organized processing channels, creating opportunities to expand packaged dairy production as collection, processing, and distribution networks improve. According to the Ministry of Agriculture, national milk production increased from 7.1 billion liters in FY2022 to 13.1 billion liters in FY2025. This increase expands the potential raw milk supply available to commercial processors, although national production volumes do not directly translate into organized market sales.
Demand is also gaining support from institutional procurement and organized retail expansion. A dairy development program reports reaching 250,000 children through its school milk initiative, establishing a recurring outlet for milk products. Meanwhile, Carrefour’s January 2026 agreement with Queens supermarket covers 13 existing stores, with plans to add 17 more by 2028. These developments create additional opportunities for dairy processors to supply packaged milk, yogurt, and cheese through institutional and retail channels. However, consistent product availability depends on reliable milk collection, quality control, cold-chain infrastructure, and distribution efficiency.
Despite these opportunities, converting rising raw milk production into affordable, branded dairy products remains a challenge. High feed costs, foreign exchange shortages, and inconsistent farm-level supply can increase operating expenses and constrain processing capacity utilization. Over the forecast period, market expansion will depend on strengthening farmer-to-processor linkages, improving collection infrastructure, and maintaining competitive pricing. Processors that establish reliable procurement networks and consistent distribution channels will be better positioned to capture growth in Ethiopia’s dairy industry.
Ethiopia Dairy Market Driver
Organized Buyers Are Strengthening Demand for Processed Dairy Products
Institutional procurement and organized retail are creating additional opportunities for Ethiopia’s dairy processors. Schools require reliable milk deliveries, while supermarkets depend on consistent product quality, appropriate packaging, and regular replenishment. These purchasing requirements encourage processors to establish dependable raw milk procurement networks and maintain consistent production schedules.
SNV reports that its school milk program has reached 250,000 children, while its broader dairy development program operates across 10 regions and 22 milk-producing areas. These initiatives demonstrate the role of institutional channels in expanding access to dairy products. Meanwhile, Carrefour’s agreement with Queens Supermarket provides a distribution route through 13 existing stores, with additional outlets planned. Although these developments do not guarantee increased sales for individual processors, they expand potential access to institutional buyers and organized retail networks.
Capturing this demand will depend on processors’ ability to coordinate milk collection, maintain quality standards, ensure safe handling, and deliver appropriately packaged products on schedule. Businesses that align procurement and processing capacity with recurring buyer requirements can improve supply reliability and strengthen their access to commercial distribution channels. Over time, the expansion of these channels could support greater penetration of processed dairy products in Ethiopia’s market.
Ethiopia Dairy Market Challenge
High Costs and Unstable Supply Limit Processing Output
More milk at the farm level does not automatically mean more affordable products on shelves. Processors need dependable raw milk deliveries, feed for their supplier farms, packaging, equipment and power. When any of these becomes costly or unreliable, plants cannot use their installed capacity efficiently or maintain steady retail supply.
A published review of Ethiopia’s dairy value chain reported that 31 processors in its underlying assessment were operating at 28% of their combined production capacity. That figure describes the earlier assessment, rather than a current industry-wide operating rate, but it illustrates the longstanding gap between installed capacity and milk that can be processed economically. As per recent report, dairy price increases of 30–40%, alongside feed inflation, foreign exchange shortages and disruptions to raw milk supply. Higher shelf prices restrict household purchases even when underlying demand remains strong.
Processors therefore need to improve sourcing and plant use while keeping products affordable. Until supply and input costs become more predictable, expansion in national milk production will translate only gradually into higher sales of packaged dairy.
Ethiopia Dairy Market Trends
Supermarket Expansion is Widening Access to Packaged Dairy
Supermarkets give dairy processors a visible outlet for packaged milk, yogurt, butter and cheese, provided they can meet requirements for stock availability and appropriate storage. Their expansion adds routes to consumers who want a consistent branded product. Traditional grocery shops and direct milk sellers remain important, particularly for frequent local purchases.
In January 2026, Carrefour announced a franchise and supply agreement with Queens Supermarket. The agreement covers conversion of 13 existing stores and plans for 17 additional stores by 2028. The planned expansion matters to dairy suppliers because each operating store can provide recurring shelf space, while a broader network rewards processors able to supply the same product reliably across locations. The additional stores remain a plan rather than completed openings.
As organized grocery coverage grows, processors should gain more opportunities to sell differentiated products alongside basic milk. The benefit will be greatest for brands that can maintain quality and availability without pricing themselves beyond routine household purchases.
Ethiopia Dairy Market Opportunity
Cooperative Collection Infrastructure Can Expand Formal Dairy Processing
Ethiopia’s dairy processing industry depends on the reliable collection of raw milk from smallholder farmers. Cooperative collection centers can consolidate milk supplies, conduct quality checks before transportation, and facilitate consistent procurement arrangements between farmers and processors. These systems can help improve raw milk utilization, support higher processing volumes, and strengthen the supply base for commercial dairy products.
The Sebeta Dairy Hubs Project illustrates this approach. In July 2026, the project, implemented by GIZ and Sebeta Agro Industry, supplied generators, milk cans, feed choppers, and quality-testing equipment to six cooperatives in Oromia. Chillers were planned for the collection centres, although their installation had not been confirmed in the handover announcement. These investments strengthen milk handling and quality assessment at the collection stage, helping address operational barriers that can prevent raw milk from reaching processing facilities.
For dairy processors, expanding cooperative networks alongside reliable procurement agreements can improve access to smallholder milk supplies and support more consistent production planning. Better-coordinated collection systems can also facilitate regular deliveries to retailers and institutional buyers, while providing participating farmers with more structured market access. The effectiveness of these investments will depend on continued infrastructure development, quality-control practices, and dependable purchasing arrangements.
Unlock Market Intelligence
Explore the market potential with our data-driven report
Ethiopia Dairy Market Segmentation Analysis
By Product Type
- Milk
- Butter
- Cheese
- Yogurt
- Ice Cream
- Others
Milk Leads the Market While Yogurt is the Fastest Growing
Milk is projected to hold the largest product share, at 43% in 2026. It serves routine household consumption and provides a basic product for processors supplying shops and institutions. Both pasteurized and long-life milk allow companies to serve buyers with different storage and delivery needs. The May 2026 inauguration of a new facility associated with Shola Milk illustrates continued investment in processed milk formats.
Yogurt is projected to grow fastest, at an 8.66% CAGR during 2027–2033. It offers processors room to introduce flavors and formats beyond basic milk, although reliable cultures, packaging and storage remain necessary. Holland Dairy’s April 2026 introduction of vanilla-flavored yogurt is a recent example of that product development. The segment’s faster forecast growth reflects expansion from a smaller base, rather than a loss of milk’s leading position.
By Distribution Channel
- Traditional Grocery and Convenience Retailers
- Supermarkets and Hypermarkets
- Direct Sales and Milk Agents
- Foodservice and Institutional Buyers
- Online Retail
- Others
Supermarkets and Hypermarkets Leads While Online Retail is the Fastest Growing
Supermarkets and hypermarkets are projected to lead with a 42% share in 2026. They can merchandise several packaged dairy categories together and give processors an organized route to urban households. Carrefour’s agreement to convert 13 Queens stores, with 17 more stores planned by 2028, supports the potential for wider retail access. This projected share applies to the supplied market model; it should not be read as a share of all milk produced or consumed nationally.
Online retail is projected to grow fastest, at a 21.97% CAGR during 2027–2033, from a small starting base. Packaged products can be listed and ordered digitally, but dairy still requires dependable fulfillment and suitable handling after purchase. Its rapid percentage growth therefore represents an emerging route to urban buyers rather than a challenge to supermarkets’ much larger projected sales base.
Unlock Market Intelligence
Explore the market potential with our data-driven report
Ethiopia Dairy Market Competitive Landscape
The supplied market estimate places the leading companies’ combined share at 58% in 2026. Lamme Dairy, Sebeta Agro Industry, Holland Dairy, MB PLC and Yala Agro Industry have different strengths across milk sourcing, processing, product variety and distribution.
Key Companies in the Ethiopia Dairy Market
- Lamme Dairy PLC
- Sebeta Agro Industry PLC
- Holland Dairy PLC
- MB PLC
- Yala Agro Industry PLC
- Mamokacha PLC
- Loni Agro Industry PLC
- Duoley Food Processing PLC
- Bobo Agro Processing
- Lala Dairy
Company Profiling
Lamme Dairy PLC: Lamme Dairy sells products under the Shola Milk brand, including processed milk and other dairy formats. Its Shola App lets business customers and delivery partners view allocations and manage orders, supporting distribution across its network. In May 2026, a new milk processing facility associated with Shola was inaugurated in Addis Ababa, adding capacity for longer-life dairy products and wider distribution.
Sebeta Agro Industry PLC: Sebeta Agro Industry operates the Mama Milk brand and works with farmers and cooperatives to source milk for processing. Its collection network is central to maintaining product quality and supplying formal buyers. In July 2026, its dairy hubs project with GIZ provided equipment to six Oromia cooperatives for milk handling, feed preparation and quality testing, with chillers planned for their collection centres.
Holland Dairy PLC: Holland Dairy sources milk from Ethiopian farmers and sells milk, yogurt and cheese. Product development and storage are especially relevant to its yogurt business because dairy demand can fluctuate during fasting periods. In September 2026, the company reported inaugurating cold storage and wastewater treatment facilities in Bishoftu, strengthening its ability to hold finished products and manage processing operations.
MB PLC: MB PLC produces Family Milk and other processed dairy products for Addis Ababa and surrounding markets. Its product range includes pasteurized and long-life milk, yogurt, cheese and butter. In its most recent identifiable distribution announcement, Family Milk partnered with Buy2Go to place its long-life milk through city retail outlets, extending access beyond MB PLC’s own sales arrangements.
Yala Agro Industry PLC: Based in Arba Minch, Yala Agro Industry combines farmer support, milk collection and processing. Its collection centres move chilled milk to a central factory, linking regional producers to a formal outlet. In April 2025, Yala announced a partnership with ABS Global, facilitated by Land O’Lakes International Development, to develop dairy breeding and artificial insemination capability in its sourcing network. The partnership’s stated yield ambitions are targets, not measured production gains.
Recent Developments in the Ethiopia Dairy Market
- September 2026: Holland Dairy reported the inauguration of cold storage and wastewater treatment facilities in Bishoftu. The additional storage supports more consistent handling of yogurt when demand fluctuates.
- July 2026: The Sebeta Dairy Hubs Project supplied six Oromia cooperatives with generators, milk cans, feed choppers and equipment for rapid quality testing. Chillers were planned for installation at the collection centres.
- June 2026: The Ethiopian Institute of Agricultural Research unveiled the locally developed Etittuu starter culture for milk fermentation, offering processors a potential alternative to imported cultures once validated for their operations.
Frequently Asked Questions
Related Report
- Market Segmentation
- Research Scope
- Research Methodology
- Definitions and Assumptions
- Executive Summary
- Ethiopia Dairy Market Policies, Regulations, and Standards
- Ethiopia Dairy Market Dynamics
- Growth Factors
- Challenges
- Trends
- Opportunities
- Ethiopia Dairy Market Statistics, 2023-2033F
- Market Size & Growth Outlook
- By Revenues in USD Million
- Market Segmentation & Growth Outlook
- By Product Type
- Butter- Market Insights and Forecast 2023-2033, USD Million
- Salted Butter- Market Insights and Forecast 2023-2033, USD Million
- Unsalted Butter- Market Insights and Forecast 2023-2033, USD Million
- Others- Market Insights and Forecast 2023-2033, USD Million
- Cheese- Market Insights and Forecast 2023-2033, USD Million
- Natural Cheese- Market Insights and Forecast 2023-2033, USD Million
- Ayib & Fresh Cheese- Market Insights and Forecast 2023-2033, USD Million
- Gouda- Market Insights and Forecast 2023-2033, USD Million
- Mozzarella- Market Insights and Forecast 2023-2033, USD Million
- Other Natural Cheese- Market Insights and Forecast 2023-2033, USD Million
- Processed Cheese- Market Insights and Forecast 2023-2033, USD Million
- Natural Cheese- Market Insights and Forecast 2023-2033, USD Million
- Cream- Market Insights and Forecast 2023-2033, USD Million
- Fresh Cream- Market Insights and Forecast 2023-2033, USD Million
- Cooking Cream- Market Insights and Forecast 2023-2033, USD Million
- Whipping Cream- Market Insights and Forecast 2023-2033, USD Million
- Others- Market Insights and Forecast 2023-2033, USD Million
- Dairy Desserts- Market Insights and Forecast 2023-2033, USD Million
- Ice Cream- Market Insights and Forecast 2023-2033, USD Million
- Frozen Dairy Desserts- Market Insights and Forecast 2023-2033, USD Million
- Others- Market Insights and Forecast 2023-2033, USD Million
- Milk- Market Insights and Forecast 2023-2033, USD Million
- Fresh & Pasteurized Milk- Market Insights and Forecast 2023-2033, USD Million
- UHT Milk- Market Insights and Forecast 2023-2033, USD Million
- Flavored Milk- Market Insights and Forecast 2023-2033, USD Million
- Condensed Milk- Market Insights and Forecast 2023-2033, USD Million
- Powdered Milk- Market Insights and Forecast 2023-2033, USD Million
- Yogurt- Market Insights and Forecast 2023-2033, USD Million
- Drinkable Yogurt- Market Insights and Forecast 2023-2033, USD Million
- Spoonable Yogurt- Market Insights and Forecast 2023-2033, USD Million
- Sour & Fermented Milk Drinks- Market Insights and Forecast 2023-2033, USD Million
- Ergo & Other Fermented Milk- Market Insights and Forecast 2023-2033, USD Million
- Buttermilk- Market Insights and Forecast 2023-2033, USD Million
- Others- Market Insights and Forecast 2023-2033, USD Million
- Others- Market Insights and Forecast 2023-2033, USD Million
- Butter- Market Insights and Forecast 2023-2033, USD Million
- By Distribution Channel
- Traditional Grocery & Convenience Retailers- Market Insights and Forecast 2023-2033, USD Million
- Supermarkets & Hypermarkets- Market Insights and Forecast 2023-2033, USD Million
- Direct Sales & Milk Agents- Market Insights and Forecast 2023-2033, USD Million
- Foodservice & Institutional- Market Insights and Forecast 2023-2033, USD Million
- Online Retail- Market Insights and Forecast 2023-2033, USD Million
- Others- Market Insights and Forecast 2023-2033, USD Million
- By Competitors
- Competition Characteristics
- Market Share & Analysis
- By Product Type
- Market Size & Growth Outlook
- Ethiopia Butter Market Statistics, 2023-2033
- Market Size & Growth Outlook
- By Revenues in USD Million
- Market Segmentation & Growth Outlook
- By Product Type- Market Insights and Forecast 2023-2033, USD Million
- By Distribution Channel- Market Insights and Forecast 2023-2033, USD Million
- Market Size & Growth Outlook
- Ethiopia Cheese Market Statistics, 2023-2033
- Market Size & Growth Outlook
- By Revenues in USD Million
- Market Segmentation & Growth Outlook
- By Product Type- Market Insights and Forecast 2023-2033, USD Million
- By Distribution Channel- Market Insights and Forecast 2023-2033, USD Million
- Market Size & Growth Outlook
- Ethiopia Cream Market Statistics, 2023-2033
- Market Size & Growth Outlook
- By Revenues in USD Million
- Market Segmentation & Growth Outlook
- By Product Type- Market Insights and Forecast 2023-2033, USD Million
- By Distribution Channel- Market Insights and Forecast 2023-2033, USD Million
- Market Size & Growth Outlook
- Ethiopia Dairy Desserts Market Statistics, 2023-2033
- Market Size & Growth Outlook
- By Revenues in USD Million
- Market Segmentation & Growth Outlook
- By Product Type- Market Insights and Forecast 2023-2033, USD Million
- By Distribution Channel- Market Insights and Forecast 2023-2033, USD Million
- Market Size & Growth Outlook
- Ethiopia Milk Market Statistics, 2023-2033
- Market Size & Growth Outlook
- By Revenues in USD Million
- Market Segmentation & Growth Outlook
- By Product Type- Market Insights and Forecast 2023-2033, USD Million
- By Distribution Channel- Market Insights and Forecast 2023-2033, USD Million
- Market Size & Growth Outlook
- Ethiopia Yogurt Market Statistics, 2023-2033
- Market Size & Growth Outlook
- By Revenues in USD Million
- Market Segmentation & Growth Outlook
- By Product Type- Market Insights and Forecast 2023-2033, USD Million
- By Distribution Channel- Market Insights and Forecast 2023-2033, USD Million
- Market Size & Growth Outlook
- Ethiopia Sour & Fermented Milk Drinks Market Statistics, 2023-2033
- Market Size & Growth Outlook
- By Revenues in USD Million
- Market Segmentation & Growth Outlook
- By Product Type- Market Insights and Forecast 2023-2033, USD Million
- By Distribution Channel- Market Insights and Forecast 2023-2033, USD Million
- Market Size & Growth Outlook
- Competitive Outlook
- Company Profiles
- Lamme Dairy PLC
- Business Description
- Product Portfolio
- Collaborations & Alliances
- Recent Developments
- Financial Details
- Others
- Sebeta Agro Industry PLC
- Business Description
- Product Portfolio
- Collaborations & Alliances
- Recent Developments
- Financial Details
- Others
- Holland Dairy PLC
- Business Description
- Product Portfolio
- Collaborations & Alliances
- Recent Developments
- Financial Details
- Others
- MB PLC
- Business Description
- Product Portfolio
- Collaborations & Alliances
- Recent Developments
- Financial Details
- Others
- Yala Agro Industry PLC
- Business Description
- Product Portfolio
- Collaborations & Alliances
- Recent Developments
- Financial Details
- Others
- Mamokacha PLC
- Business Description
- Product Portfolio
- Collaborations & Alliances
- Recent Developments
- Financial Details
- Others
- Loni Agro Industry PLC
- Business Description
- Product Portfolio
- Collaborations & Alliances
- Recent Developments
- Financial Details
- Others
- Duoley Food Processing PLC
- Business Description
- Product Portfolio
- Collaborations & Alliances
- Recent Developments
- Financial Details
- Others
- Bobo Agro Processing
- Business Description
- Product Portfolio
- Collaborations & Alliances
- Recent Developments
- Financial Details
- Others
- Lala Dairy
- Business Description
- Product Portfolio
- Collaborations & Alliances
- Recent Developments
- Financial Details
- Others
- Lamme Dairy PLC
- Company Profiles
- Disclaimer
| Segment | Sub-Segment |
|---|---|
| By Product Type |
|
| By Distribution Channel |
|
Research Methodology
This study followed a structured approach comprising four key phases to assess the size and scope of the electro-oxidation market. The process began with thorough secondary research to collect data on the target market, related markets, and broader industry context. These findings, along with preliminary assumptions and estimates, were then validated through extensive primary research involving industry experts from across the value chain. To calculate the overall market size, both top-down and bottom-up methodologies were employed. Finally, market segmentation and data triangulation techniques were applied to refine and validate segment-level estimations.
Secondary Research
The secondary research phase involved gathering data from a wide range of credible and published sources. This step helped in identifying industry trends, defining market segmentation, and understanding the market landscape and value chain.
Sources consulted during this phase included:
- Company annual reports, investor presentations, and press releases
- Industry white papers and certified publications
- Trade directories and market-recognized databases
- Articles from authoritative authors and reputable journals
- Gold and silver standard websites
Secondary research was critical in mapping out the industry's value chain and monetary flow, identifying key market segments, understanding regional variations, and tracking significant industry developments.
Other key sources:
- Financial disclosures
- Industry associations and trade bodies
- News outlets and business magazines
- Academic journals and research studies
- Paid industry databases
Primary Research
To validate secondary data and gain deeper market insights, primary research was conducted with key stakeholders across both the supply and demand sides of the market.
On the demand side, participants included decision-makers and influencers from end-user industries—such as CIOs, CTOs, and CSOs—who provided first-hand perspectives on market needs, product usage, and future expectations.
On the supply side, interviews were conducted with manufacturers, industry associations, and institutional participants to gather insights into current offerings, product pipelines, and market challenges.
Primary interviews provided critical inputs such as:
- Market size and revenue data
- Product and service breakdowns
- Market forecasts
- Regional and application-specific trends
Stakeholders consulted included:
- Leading OEM and solution providers
- Channel and distribution partners
- End users across various applications
- Independent consultants and industry specialists
Market Size Estimation and Data Triangulation
- Identifying Key Market Participants (Secondary Research)
- Goal: To identify the major players or companies in the target market. This typically involves using publicly available data sources such as industry reports, market research publications, and financial statements of companies.
- Tools: Reports from firms like Gartner, Forrester, Euromonitor, Statista, IBISWorld, and others. Public financial statements, news articles, and press releases from top market players.
- Extracting Earnings of Key Market Participants
- Goal: To estimate the earnings generated from the product or service being analyzed. This step helps in understanding the revenue potential of each market player in a specific geography.
- Methods: Earnings data can be gathered from:
- Publicly available financial reports (for listed companies).
- Interviews and primary data sources from professionals, such as Directors, VPs, SVPs, etc. This is especially useful for understanding more nuanced, internal data that isn't publicly disclosed.
- Annual reports and investor presentations of key players.
- Data Collation and Development of a Relevant Data Model
- Goal: To collate inputs from both primary and secondary sources into a structured, data-driven model for market estimation. This model will incorporate key market KPIs and any independent variables relevant to the market.
- Key KPIs: These could include:
- Market size, growth rate, and demand drivers.
- Industry-specific metrics like market share, average revenue per customer (ARPC), or average deal size.
- External variables, such as economic growth rates, inflation rates, or commodity prices, that could affect the market.
- Data Modeling: Based on this data, the market forecasts are developed for the next 5 years. A combination of trend analysis, scenario modeling, and statistical regression might be used to generate projections.
- Scenario Analysis
- Goal: To test different assumptions and validate how sensitive the market is to changes in key variables (e.g., market demand, regulatory changes, technological disruptions).
- Types of Scenarios:
- Base Case: Based on current assumptions and historical data.
- Best-Case Scenario: Assuming favorable market conditions, regulatory environments, and technological advancements.
- Worst-Case Scenario: Accounting for adverse factors, such as economic downturns, stricter regulations, or unexpected disruptions.