US Organic Food & Beverages Market Report: Trends, Growth and Forecast (2027-2033)
By Product Type (Organic Food, Organic Beverages), By Distribution Channel (Supermarkets & Hypermarkets, Specialty Stores, Convenience Stores, Online Stores, Others), By End Consumer (Household Consumers, HoReCa/ Foodservice, Institutional & Other Commercial) ... Read more
|
Major Players
|
US Organic Food & Beverages Market Overview
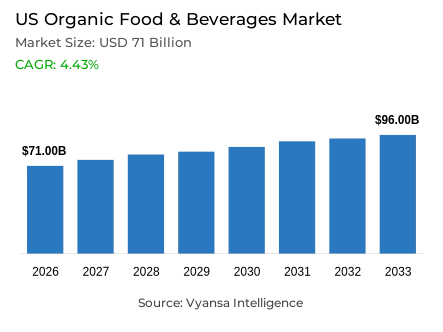
The United States organic food & beverages market comprises certified fresh, processed, and beverage products produced and labelled under recognized organic standards. Consumption extends across household meals, foodservice, and institutional use, with certification separating organic products from conventional, reduced-input, and broader natural-food positioning. The market is forecast to grow at a CAGR of 4.43% between 2027 and 2033.
Key Highlights of the US Organic Food & Beverages Market
- The US organic food & beverages market was valued at USD 71 billion in 2026, estimated at USD 74 billion in 2027, and forecast to reach USD 96 billion by 2033.
- The market is forecast to expand at a compound annual growth rate of 4.43% between 2027 and 2033.
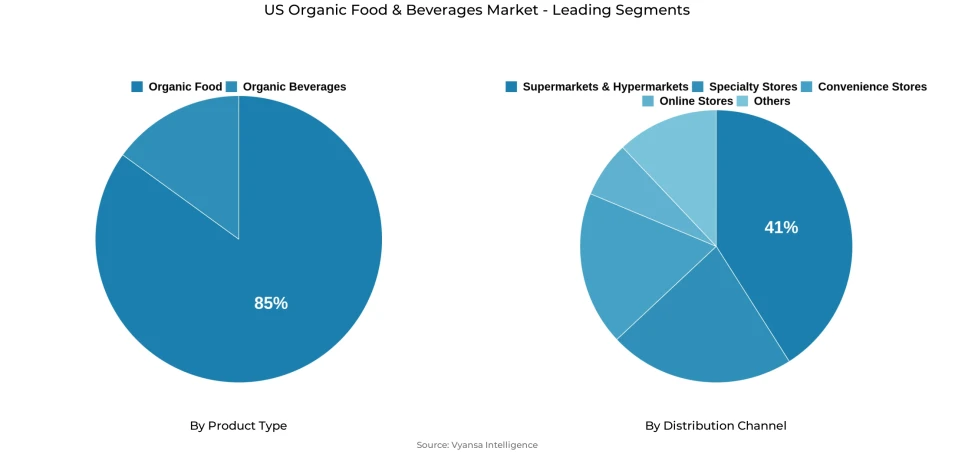
- By product type, organic food held the leading position with an 85% share of the market in 2026.
- Packaged & processed foods are the fastest-growing product type, expanding at a CAGR of approximately 7.7% between 2027 and 2033.
- By distribution channel, supermarkets & hypermarkets led the market with a 41% share in 2026.
- Online Stores are the fastest-growing distribution channel, expanding at a CAGR of approximately 8.5% between 2027 and 2033.
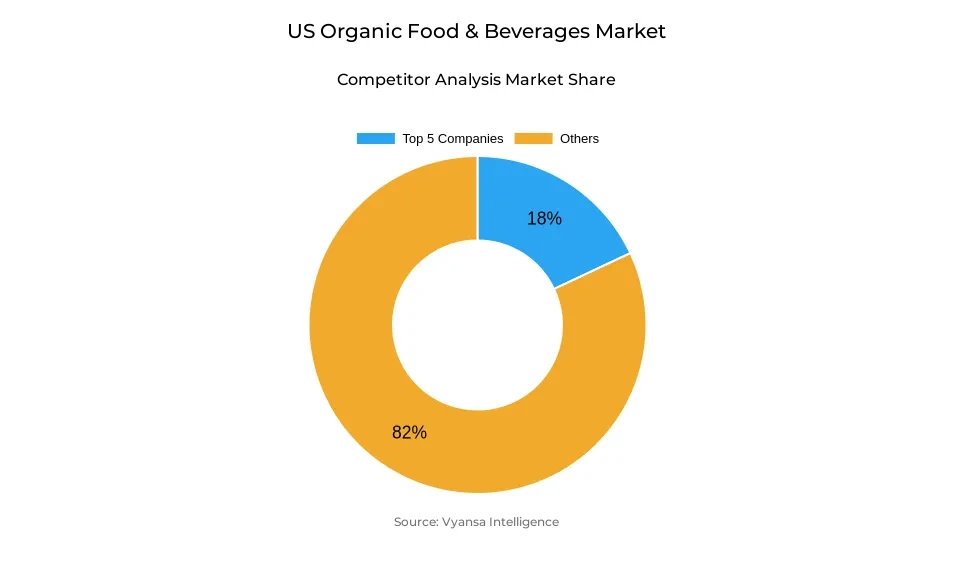
- The market is fragmented, with the top five companies holding a combined 18% share in 2026.
The US organic food and beverages market is gaining momentum as concerns around food safety, pesticide exposure, clean-label consumption, and preventive health increasingly influence purchasing decisions. U.S. sales of certified organic products reached USD 71.6 billion in 2024, growing 5.2%, more than twice the 2.5% growth of the overall comparable market. Organic food sales alone reached USD 65.4 billion, demonstrating that organic demand continued expanding despite elevated food prices.
Pesticide exposure is an important measurable consumer concern. A 2024 IFIC survey of 1,000 U.S. adults found that pesticide use was among the leading concerns when consumers considered how food was produced. Moreover, 47% of respondents believed organic agriculture does not use pesticides, while nearly 30% said the health benefits of consuming pesticide-grown fruits and vegetables outweigh the risks.
The underlying health concern is supported by regulatory evidence: the EPA identifies potential pesticide-related effects involving the nervous system, endocrine system and carcinogenicity, depending on the chemical and exposure level. In December 2024, EPA proposed revoking most food-use tolerances for chlorpyrifos, citing the need to reduce exposure and protect public health, particularly children.
This concern is translating into purchasing behavior. OTA's 2024 consumer research found that more than 50% of U.S. consumers had purchased an organic fruit or vegetable during the previous year, while 93% of consumers purchasing baby food chose organic. The same research found that organic was the food claim most associated with willingness to pay a premium, with nearly 60% considering the claim sufficient to justify a higher price.
The trend continued in 2025, when organic sales accelerated to USD 76.6 billion, up 6.8%, while organic food reached USD 70.1 billion, growing 6.9%. This growth indicates that rising attention to pesticide exposure, cleaner formulations and health-oriented consumption is increasingly translating into measurable organic purchasing rather than remaining solely a consumer-attitude trend.
US Organic Food & Beverages Market Drivers
Growing Consumer Concern Over Pesticide Exposure and Food Production Practices Is Strengthening Organic Adoption
Consumer demand for organic food in the United States is increasingly supported by the value households place on production transparency, pesticide avoidance and verified food standards. Unlike broader natural-food claims, certified organic products are backed by defined production requirements, annual inspections and regulatory oversight. This gives consumers a clearer basis for differentiating organic products from conventional alternatives and supports willingness to pay a premium when food safety, ingredient quality and production practices influence the purchase decision.
The demand effect is visible in consumer research. USDA's economic research service identifies pesticide-residue avoidance, perceived health benefits and family well-being among the important motivations for organic purchasing. A 2025 USDA agricultural research service study of 313 U.S. peanut consumers found that more than 90% purchased organic food at least occasionally, 74% expressed interest in organic peanuts and more than half indicated willingness to pay a premium. Health, naturalness, quality and pesticide-free production were among the attributes consumers associated with organic products.
These preferences are also becoming more relevant among younger consumers entering higher-spending life stages. An April 2026 survey found that more than 70% of Gen Z and Millennial consumers aged 18 to 34 considered sourcing practices when selecting protein products, while more than four in ten Americans reported paying greater attention to protein than five years earlier. As sourcing and production practices become part of routine food evaluation, certified organic products gain a broader demand base across fresh food, packaged products, beverages and protein categories. This supports continued substitution of conventional products with organic alternatives through 2032.
US Organic Food & Beverages Market Challenges
Persistent Organic-to-Conventional Price Premium Restricts Routine Household Conversion
The principal constraint on organic demand is the point at which the perceived value of certification no longer justifies the price difference against a conventional substitute. Consumers may prefer organic products for production practices, pesticide avoidance or perceived quality, but repeated household adoption depends on whether that preference can be accommodated within the overall grocery budget.
The premium remains material in frequently purchased categories. USDA dairy market news reported an advertised price of USD 4.63 for a half-gallon of organic milk in April 2026 compared with USD 1.82 for conventional milk, creating a USD 2.81 difference. The gap was USD 2.63 in February 2026. At the same time, food-at-home prices remained 2.7% higher year over year in July 2026, increasing pressure on household grocery spending before an organic premium is added.
Part of this premium reflects structural production costs rather than retailer pricing alone. Organic farmers operate under stricter input requirements, certification costs and production practices that can require additional labour or generate lower yields. USDA's Organic Certification Cost Share Program reimburses eligible producers for up to 75% of certification expenses, capped at USD 750 per certification scope, but this support does not eliminate the broader cost difference between organic and conventional production.
The result is selective rather than complete household conversion. Consumers may continue buying organic in categories where certification carries the greatest perceived value while choosing conventional alternatives elsewhere. Price therefore restricts both the number of households that adopt organic products regularly and the number of organic items included within each grocery basket. Narrowing the delivered-cost gap remains important for moving organic consumption from occasional premium purchasing toward routine household expenditure.
US Organic Food & Beverages Market Recent Trends
Mainstreaming of Organic Food Through Convenient and Familiar Consumption Formats
Organic demand is increasingly moving beyond traditional fresh and packaged formats into products designed for everyday snacking, children's meals and on-the-go consumption. This matters because future market expansion does not depend only on attracting new organic consumers. It also depends on increasing the number of occasions in which existing consumers can choose an organic alternative.
Recent product development illustrates this shift. Organic Valley introduced individually wrapped snack sticks in June 2026, providing 5 grams of protein per serving and moving organic cheese into a portable snacking format. In May 2026, Earth's Best expanded beyond its traditional baby and toddler positioning with Crispy Sticks and Veggie Waves targeting children aged four to eight. Once Upon a Farm also entered refrigerated organic meat and bone-broth pouches in 2026, offering chicken, beef and turkey products with at least 4 grams of protein. These launches place organic ingredients into formats already associated with frequent household purchasing. Snacks, children's foods, refrigerated pouches and portable protein products can generate more consumption occasions than products requiring dedicated preparation or specialist shopping behaviour.
Distribution infrastructure is also developing around these formats. Once Upon a Farm had installed more than 3,400 refrigerated coolers by the end of 2025 and identified potential for more than 15,000 locations. Wider availability of refrigerated and ready-to-consume organic products reduces access barriers while increasing product visibility inside mainstream retail. The trend therefore supports market demand by increasing purchase frequency and allowing organic products to capture a larger share of existing household food expenditure.
Precision Agriculture and Advanced Processing Are Expanding Organic Production Efficiency and Product Performance
Technology is becoming increasingly relevant to organic demand because it can address two persistent limitations of the market: higher production costs and limited differentiation beyond certification. Precision agriculture can reduce the labour required to produce organic crops, while advanced processing can improve the nutritional or functional attributes of the finished product.
Laser-based weed control illustrates the supply-side effect. Organic farming cannot rely on conventional synthetic herbicides, making weed management labour-intensive in several crops. Hungenberg Produce reported that deployment of Carbon Robotics' LaserWeeder increased organic carrot yields by approximately 15% to 20% while reducing annual weeding labour costs from around USD 700,000 to approximately USD 300,000. Peer-reviewed research published in 2025 also found that laser treatment reduced weed biomass by at least 97%. Higher yields and lower labour requirements can improve the economics of expanding certified acreage. The demand impact emerges downstream: more efficient production can increase the volume available to retailers and processors while reducing part of the cost pressure that contributes to the organic premium.
Technology is also improving the consumer proposition. Organic Valley's 2026 national launch of Protein Plus ultra-filtered milk offers 50% more protein and 50% less sugar than regular milk. Products of this type compete not only on certification but also on nutrition and functionality. Combining organic positioning with measurable product performance broadens the reasons consumers have to select the product and can support demand among health- and protein-focused households that may not purchase primarily for organic certification alone.
Unlock Market Intelligence
Explore the market potential with our data-driven report
US Organic Food & Beverages Market Future Opportunities
Securing Future Organic Supply Through Farmer Transition and Contracted Sourcing
Future market growth depends on whether the supply of certified ingredients can expand fast enough to support additional retail, foodservice and manufacturing demand. Organic acreage cannot be increased immediately because conventional farmland must complete a multi-year transition before qualifying for certification. During this period, farmers absorb conversion costs and operational changes without necessarily receiving the full organic price premium, creating a financial barrier to adding new certified acreage.
USDA's Transition to Organic Partnership Program demonstrates the size of the potential supply pipeline. As of March 31, 2026, participating mentees represented approximately 147,000 acres moving through the transition process, with more than 77,698 acres already achieving organic certification. These acres provide a visible pool of future supply that processors, retailers and cooperatives can engage before production reaches the open market. The commercial opportunity is to reduce the farmer's transition risk through multi-year purchase agreements, guaranteed offtake, transition premiums and agronomic support. For downstream companies, this is more than a sourcing strategy. Securing future acreage provides greater confidence to expand organic product ranges, enter new categories and commit shelf space or processing capacity without depending entirely on short-term certified supply.
Companies that establish relationships during the transition period can therefore convert future agricultural capacity into secured market supply. As demand expands through more products, consumption occasions and retail channels, contracted sourcing can reduce the risk that insufficient certified ingredients become a constraint on growth. This makes farmer transition support an important route for protecting long-term market expansion through 2032.
US Organic Food & Beverages Market Segmentation Analysis
By Product Type:
- Organic Food
- Fruits & Vegetables
- Cereals, Grains & Pulses
- Meat, Poultry & Seafood
- Dairy Products & Eggs
- Packaged & Processed Foods
- Other Organic Foods
- Organic Beverages
- Fruit & Vegetable Juices
- Tea & Coffee
- Dairy Beverages
- Plant-Based Beverages
- Other Organic Beverages
Organic Food Commands 85% of Product Type Demand
Organic Food leads product-type demand with an 85% share of the market in 2026, built on two decades of mainstream retail listings across fresh, dairy and packaged lines that organic beverages have not yet matched, plus supply-chain scale that spreads certification cost across a far broader input base. In February 2026, Grimmway Enterprises' Cal-Organic Farms brand launched six year-round bite-size potato offerings, extending fresh-produce shelf presence, while Nature's Path Foods introduced updated packaging with clearer benefit icons in March 2026 across its organic cereal range. This lead should hold through 2032 unless organic beverages close the retail-scale gap within the organic industry.
Packaged & Processed Foods is forecast to grow fastest among product types at approximately 7.7% CAGR between 2027 and 2033, as manufacturers convert organic ingredients into ready-to-eat, snack and shelf-stable formats reaching new everyday occasions beyond fresh-format purchases. In June 2026, SunOpta opened a fruit-snack processing line in Omak, Washington, lifting fruit-snack production capacity by 25%, while General Mills' 2026 Cascadian Farm pipeline added Organic Cookie Crunch with Chocolatey Sprinkles and cookie-inspired granolas. It grows faster than the broader Organic Food segment because packaged formats scale production and distribution faster than fresh or dairy lines constrained by shelf life and cold-chain logistics.
By Distribution Channel:
- Supermarkets & Hypermarkets
- Specialty Stores
- Convenience Stores
- Online Stores
- Others
Supermarkets and Hypermarkets Hold 41% of Distribution Channel Demand
Supermarkets & Hypermarkets lead distribution with a 41% share of the market in 2026, the default weekly grocery destination where organic assortment sits directly alongside conventional aisles rather than a separate specialty section, giving the channel unmatched reach across both dedicated and occasional shoppers. USDA recorded organic milk advertising up 43% in its February 2026 retail survey, with half-gallon organic milk receiving more advertisements than any other organic dairy item, while Straus Family Creamery expanded its organic ice-cream pints and quarts into Whole Foods Market nationwide beginning April 2026. This lead should persist provided supermarkets keep expanding organic shelf space.
Online Stores are forecast to grow fastest among distribution channels at approximately 8.5% CAGR between 2027 and 2033, as e-grocery platforms make repeat-purchase of certified organic items easier than a physical aisle allows. USDA's Economic Research Service reports internet sales grew from 2% of organic food sales in 2012 to 6.7% in 2024, and Once Upon a Farm's December 2025 consumer research found its organic pouch purchasers valued transparency, no added sugar and the absence of artificial ingredients alongside organic status. Online stores grow faster than supermarkets because e-grocery assortment is not shelf-space constrained, reaching buyers a physical store would not stock.
Unlock Market Intelligence
Explore the market potential with our data-driven report
US Organic Food & Beverages Market Competitive Landscape
The market is fragmented, with the top five companies holding a combined 18% share in 2026. The major market players in the market are Cooperative Regions of Organic Producer Pools, operating as Organic Valley, followed by Horizon Organic Dairy LLC, General Mills Inc., Taylor Fresh Foods Inc., and Amy's Kitchen Inc.
Key Companies in the US Organic Food & Beverages Market
- Cooperative Regions of Organic Producer Pools dba Organic Valley
- Horizon Organic Dairy LLC
- General Mills Inc.
- Taylor Fresh Foods Inc.
- Amy's Kitchen Inc.
- Nurture LLC (Happy Family Organics)
- Nature's Path Foods Inc.
- The Hain Celestial Group Inc.
- Once Upon A Farm PBC
- Grimmway Enterprises Inc. (Cal-Organic Farms)
Recent Developments in the US Organic Food & Beverages Market
- June 2026: USDA recorded 36,430 organic-produce retail advertisements during a single observed week, with organic accounting for 12% of all specialty-crop advertising in that period, confirming that retailers continue to feature organic produce prominently in promotional planning even as the broader grocery basket faces inflationary pressure. Sustained promotional intensity at this scale keeps organic produce visible to price-sensitive shoppers who might otherwise default to conventional alternatives, supporting continued unit velocity for fresh organic fruits and vegetables across the forecast period.
Frequently Asked Questions
Related Report
- Market Segmentation
- Research Scope
- Research Methodology
- Definitions and Assumptions
- Executive Summary
- US Organic Food and Beverages Production Trend 2023-2033
- US Organic Food and Beverages Production Trend by Product Type
- Organic Food
- Organic Beverages
- Company-Wise Production Plants and Statistics
- Installed Production Capacity
- Actual Production
- Planned Production Target
- US Organic Food and Beverages Production Trend by Product Type
- US Organic Food and Beverages Pricing Analysis 2023-2033
- US Organic Food and Beverages Pricing Trend 2023-2033
- US Organic Food and Beverages Pricing by Product Type 2023-2033
- Organic Food
- Organic Beverages
- US Organic Food and Beverages Value Chain Analysis
- US Organic Food and Beverages Import & Export Trend Analysis 2022-25
- US Organic Food and Beverages Market Policies, Regulations, and Standards
- US Organic Food and Beverages Market Dynamics
- Growth Factors
- Challenges
- Trends
- Opportunities
- US Organic Food and Beverages Market Statistics, 2023-2033
- Market Size & Growth Outlook
- By Revenues in USD Million
- Market Segmentation & Growth Outlook
- By Product Type
- Organic Food- Market Insights and Forecast 2023-2033, USD Million
- Fruits & Vegetables- Market Insights and Forecast 2023-2033, USD Million
- Cereals, Grains & Pulses- Market Insights and Forecast 2023-2033, USD Million
- Meat, Poultry & Seafood- Market Insights and Forecast 2023-2033, USD Million
- Dairy Products & Eggs- Market Insights and Forecast 2023-2033, USD Million
- Packaged & Processed Foods- Market Insights and Forecast 2023-2033, USD Million
- Other Organic Foods- Market Insights and Forecast 2023-2033, USD Million
- Organic Beverages- Market Insights and Forecast 2023-2033, USD Million
- Fruit & Vegetable Juices- Market Insights and Forecast 2023-2033, USD Million
- Tea & Coffee- Market Insights and Forecast 2023-2033, USD Million
- Dairy Beverages- Market Insights and Forecast 2023-2033, USD Million
- Plant-Based Beverages- Market Insights and Forecast 2023-2033, USD Million
- Other Organic Beverages- Market Insights and Forecast 2023-2033, USD Million
- Organic Food- Market Insights and Forecast 2023-2033, USD Million
- By Distribution Channel
- Supermarkets & Hypermarkets- Market Insights and Forecast 2023-2033, USD Million
- Specialty Stores- Market Insights and Forecast 2023-2033, USD Million
- Convenience Stores- Market Insights and Forecast 2023-2033, USD Million
- Online Stores- Market Insights and Forecast 2023-2033, USD Million
- Others- Market Insights and Forecast 2023-2033, USD Million
- By End Consumer
- Household Consumers- Market Insights and Forecast 2023-2033, USD Million
- HoReCa/ Foodservice- Market Insights and Forecast 2023-2033, USD Million
- Institutional & Other Commercial - Market Insights and Forecast 2023-2033, USD Million
- By Competitors
- Competition Characteristics
- Market Share & Analysis
- By Product Type
- Market Size & Growth Outlook
- US Organic Food Market Statistics, 2023-2033
- Market Size & Growth Outlook
- By Revenues in USD Million
- Market Segmentation & Growth Outlook
- By Distribution Channel- Market Insights and Forecast 2023-2033, USD Million
- By End Consumer- Market Insights and Forecast 2023-2033, USD Million
- Market Size & Growth Outlook
- US Organic Beverages Market Statistics, 2023-2033
- Market Size & Growth Outlook
- By Revenues in USD Million
- Market Segmentation & Growth Outlook
- By Distribution Channel- Market Insights and Forecast 2023-2033, USD Million
- By End Consumer- Market Insights and Forecast 2023-2033, USD Million
- Market Size & Growth Outlook
- Competitive Outlook
- Company Profiles
- Cooperative Regions of Organic Producer Pools dba Organic Valley
- Business Description
- Product Portfolio
- Collaborations & Alliances
- Recent Developments
- Financial Details
- Others
- Horizon Organic Dairy LLC
- Business Description
- Product Portfolio
- Collaborations & Alliances
- Recent Developments
- Financial Details
- Others
- General Mills Inc.
- Business Description
- Product Portfolio
- Collaborations & Alliances
- Recent Developments
- Financial Details
- Others
- Taylor Fresh Foods Inc.
- Business Description
- Product Portfolio
- Collaborations & Alliances
- Recent Developments
- Financial Details
- Others
- Amy's Kitchen Inc.
- Business Description
- Product Portfolio
- Collaborations & Alliances
- Recent Developments
- Financial Details
- Others
- Nurture LLC
- Business Description
- Product Portfolio
- Collaborations & Alliances
- Recent Developments
- Financial Details
- Others
- Nature's Path Foods Inc.
- Business Description
- Product Portfolio
- Collaborations & Alliances
- Recent Developments
- Financial Details
- Others
- The Hain Celestial Group Inc.
- Business Description
- Product Portfolio
- Collaborations & Alliances
- Recent Developments
- Financial Details
- Others
- Once Upon A Farm PBC
- Business Description
- Product Portfolio
- Collaborations & Alliances
- Recent Developments
- Financial Details
- Others
- Grimmway Enterprises Inc.
- Business Description
- Product Portfolio
- Collaborations & Alliances
- Recent Developments
- Financial Details
- Others
- Cooperative Regions of Organic Producer Pools dba Organic Valley
- Company Profiles
- Disclaimer
| Segment | Sub-Segment |
|---|---|
| By Product Type |
|
| By Distribution Channel |
|
| By End Consumer |
|
Research Methodology
This study followed a structured approach comprising four key phases to assess the size and scope of the electro-oxidation market. The process began with thorough secondary research to collect data on the target market, related markets, and broader industry context. These findings, along with preliminary assumptions and estimates, were then validated through extensive primary research involving industry experts from across the value chain. To calculate the overall market size, both top-down and bottom-up methodologies were employed. Finally, market segmentation and data triangulation techniques were applied to refine and validate segment-level estimations.
Secondary Research
The secondary research phase involved gathering data from a wide range of credible and published sources. This step helped in identifying industry trends, defining market segmentation, and understanding the market landscape and value chain.
Sources consulted during this phase included:
- Company annual reports, investor presentations, and press releases
- Industry white papers and certified publications
- Trade directories and market-recognized databases
- Articles from authoritative authors and reputable journals
- Gold and silver standard websites
Secondary research was critical in mapping out the industry's value chain and monetary flow, identifying key market segments, understanding regional variations, and tracking significant industry developments.
Other key sources:
- Financial disclosures
- Industry associations and trade bodies
- News outlets and business magazines
- Academic journals and research studies
- Paid industry databases
Primary Research
To validate secondary data and gain deeper market insights, primary research was conducted with key stakeholders across both the supply and demand sides of the market.
On the demand side, participants included decision-makers and influencers from end-user industries—such as CIOs, CTOs, and CSOs—who provided first-hand perspectives on market needs, product usage, and future expectations.
On the supply side, interviews were conducted with manufacturers, industry associations, and institutional participants to gather insights into current offerings, product pipelines, and market challenges.
Primary interviews provided critical inputs such as:
- Market size and revenue data
- Product and service breakdowns
- Market forecasts
- Regional and application-specific trends
Stakeholders consulted included:
- Leading OEM and solution providers
- Channel and distribution partners
- End users across various applications
- Independent consultants and industry specialists
Market Size Estimation and Data Triangulation
- Identifying Key Market Participants (Secondary Research)
- Goal: To identify the major players or companies in the target market. This typically involves using publicly available data sources such as industry reports, market research publications, and financial statements of companies.
- Tools: Reports from firms like Gartner, Forrester, Euromonitor, Statista, IBISWorld, and others. Public financial statements, news articles, and press releases from top market players.
- Extracting Earnings of Key Market Participants
- Goal: To estimate the earnings generated from the product or service being analyzed. This step helps in understanding the revenue potential of each market player in a specific geography.
- Methods: Earnings data can be gathered from:
- Publicly available financial reports (for listed companies).
- Interviews and primary data sources from professionals, such as Directors, VPs, SVPs, etc. This is especially useful for understanding more nuanced, internal data that isn't publicly disclosed.
- Annual reports and investor presentations of key players.
- Data Collation and Development of a Relevant Data Model
- Goal: To collate inputs from both primary and secondary sources into a structured, data-driven model for market estimation. This model will incorporate key market KPIs and any independent variables relevant to the market.
- Key KPIs: These could include:
- Market size, growth rate, and demand drivers.
- Industry-specific metrics like market share, average revenue per customer (ARPC), or average deal size.
- External variables, such as economic growth rates, inflation rates, or commodity prices, that could affect the market.
- Data Modeling: Based on this data, the market forecasts are developed for the next 5 years. A combination of trend analysis, scenario modeling, and statistical regression might be used to generate projections.
- Scenario Analysis
- Goal: To test different assumptions and validate how sensitive the market is to changes in key variables (e.g., market demand, regulatory changes, technological disruptions).
- Types of Scenarios:
- Base Case: Based on current assumptions and historical data.
- Best-Case Scenario: Assuming favorable market conditions, regulatory environments, and technological advancements.
- Worst-Case Scenario: Accounting for adverse factors, such as economic downturns, stricter regulations, or unexpected disruptions.