Global Bakery Products Market Report: Trends, Growth and Forecast (2027-2033)
By Product Type (Bread & Rolls, Cakes & Pastries, Biscuits & Cookies, Crackers & Savory Bakery Products, Rusks & Toasted Bakery Products, Other Bakery Products), By Form (Fresh, Frozen, Ambient / Shelf-Stable), By Distribution Channel (Supermarkets & Hypermarkets, Convenience Stores, Bakery & Specialty Stores, Online Retail, Other Retail Channels), By Region (North America, South America, Europe, Middle East & Africa, Asia Pacific) ... Read more
|
Major Players
|
Bakery Products Market Overview
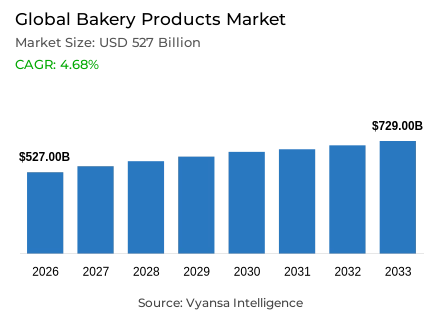
Bakery products are baked wheat-based foods, including bread, rolls, cakes, pastries, biscuits, crackers and rusks, sold fresh, frozen or shelf-stable. Households consume them daily as staples and snacks, while cafes, quick-service chains, hotels and in-store bakeries use them across breakfast, sandwich and dessert menus. The Bakery products market is forecast to grow at a compound annual growth rate (CAGR) of 4.68% between 2027 and 2033.
Key Highlights of the Bakery Products Market
- The market was valued at USD 527 billion in 2026 and is estimated at USD 554 billion in 2027.
- It is projected to reach USD 729 billion by 2033, implying a 4.68% CAGR from 2027 to 2033.
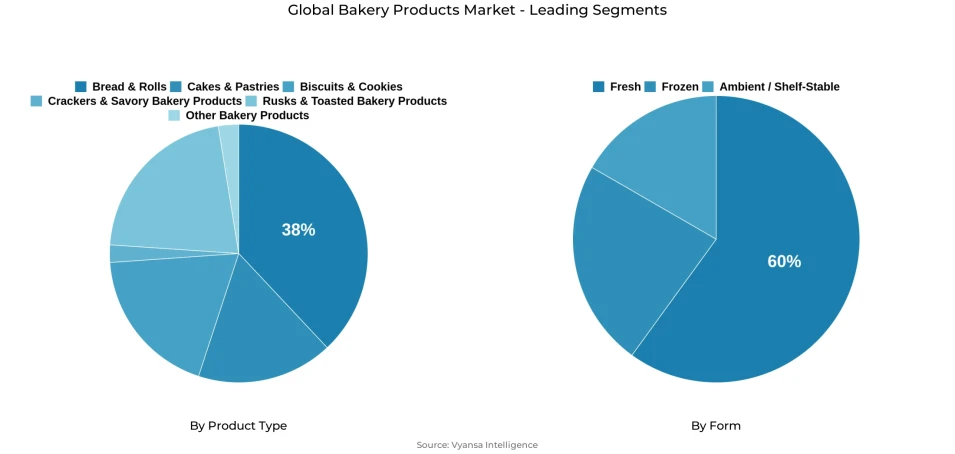
- Bread & Rolls lead by product type, with an estimated 38% share in 2026.
- Cakes & Pastries are projected to grow fastest under product type, at a 6.62% CAGR between 2027 and 2033.
- Fresh products lead by form, with an estimated 60.0% share in 2026.
- Frozen products are projected to grow fastest under form, at an 8.91% CAGR between 2027 and 2033.
- Europe leads the global bakery market with 30% market share in 2026.
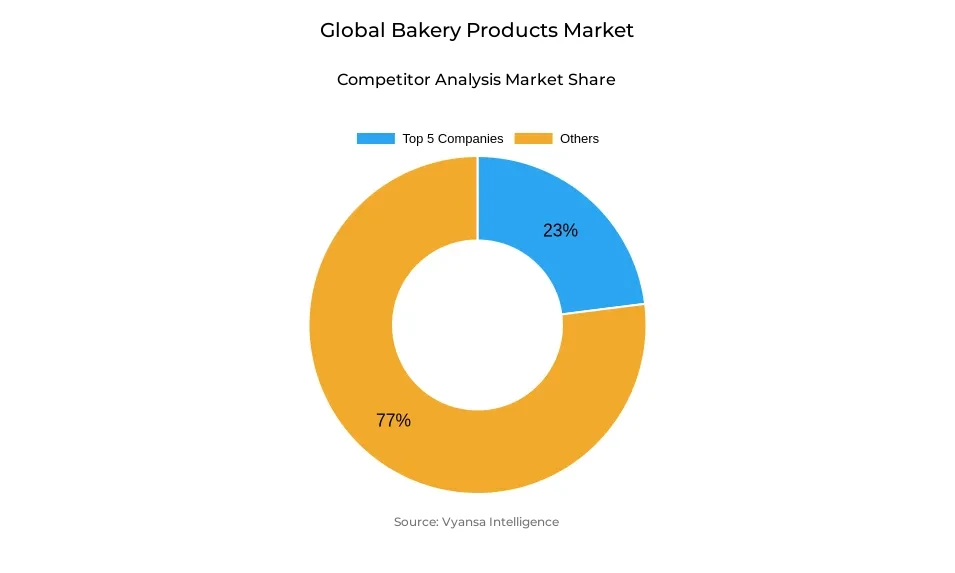
- The top five companies hold an estimated combined market share of 23% in 2026.
Bakery products benefit from frequent consumption across households, retail outlets, and foodservice businesses. The OECD–FAO Agricultural Outlook 2026–2035 projects global wheat consumption to increase by approximately 10% by 2035, with food use accounting for around 59 million tons of additional demand. Although wheat serves multiple food categories, this projected increase supports demand for bread, rolls, biscuits, and other wheat-based bakery products. Population growth and expanding access to commercial food distribution further support consumption, particularly in developing economies.
Changing lifestyles and demand for convenient food options encourage manufacturers to develop individually packed bakery items, ready-to-eat products, and longer-shelf-life alternatives. These formats accommodate on-the-go consumption while helping retailers manage inventory and product availability. Product differentiation through flavors, ingredients, and portion sizes also allows manufacturers to target diverse consumer preferences. However, the commercial success of these offerings depends on affordability, product quality, and their ability to generate repeat demand.
Fluctuations in wheat prices, energy costs, packaging expenses, and transportation charges directly influence bakery production costs and retail pricing. Even modest increases in ingredient costs can pressure manufacturers' margins when competitive conditions limit price adjustments. Meanwhile, investments in automated production and efficient distribution can help reduce operating expenses and minimize product wastage. Manufacturers must balance cost control with consistent quality and accessible pricing to maintain consumer demand. Businesses that combine reliable supply chains with differentiated products and efficient production processes will be better positioned to sustain revenue growth throughout the forecast period.
Bakery Products Market Drivers
Emerging Economy Income Growth Converting Staple Wheat Use into Packaged Bakery Consumption
Rising incomes and larger urban populations in emerging economies increase household wheat use, and industrial producers capture volume that informal and home baking once held. Households shift to packaged bread, biscuits, and cakes because modern retail and cold-chain reach make a consistent product available every day. End users consume these goods as a daily staple, so the shift adds recurring volume to the bakery industry.
The Organization for Economic Cooperation and Development (OECD) and FAO agricultural outlook, published in July 2025, projects wheat consumption in 2034 at 11% above the base period, with India and China supplying 30% of the rise. The United States Department of Agriculture (USDA) reports that 70% of flour consumed in Nigeria goes into bread, so flour supply converts almost directly into loaf and roll volume.
Through 2033, packaged bread, biscuits and cakes gain the most weight in India, China and West Africa, where small-town and rural distribution is still being built. In September 2025, Britannia Industries Limited said it plans to add about 230,000 outlets a year in villages with fewer than 3,000 people. Each new outlet adds repeat consumption, so demand for industrial bakery output grows fastest where income and distribution expand together.
Bakery Products Market Challenges
Weight Loss Medication Reshaping Household Consumption of Indulgent Bakery Lines
Sweet bakery, cookie, cake and white-bread producers in the United States and the United Kingdom carry the constraint. Glucagon-like peptide-1 (GLP-1) weight loss medication reduces appetite at the level of the individual consumer, so it changes what a household consumes. The effect is structural rather than temporary because medication use continues month after month and reformulating a product for lower sugar or smaller portions takes a full development and retailer listing cycle.
PricewaterhouseCoopers (PwC) reported in February 2025 that households using GLP-1 medication spent about 11% less across most food categories, with the steepest reductions in snacks and baked goods. That lowers basket size for indulgent lines and raises the qualification threshold for new sweet products, which must now show a lower-sugar or portion-controlled case to hold shelf space in the bakery industry.
Manufacturers are answering with reformulated, smaller-portion and higher-protein lines. International Flavors & Fragrances Inc. (IFF) research on United Kingdom consumers, reported in August 2026, suggests some products will lose volume, some will recover and some may gain value as households trade up. Demand therefore relocates toward smaller, protein-led and premium formats instead of leaving the category, and sweet bakery lines that reformulate keep their place on shelf.
Bakery Products Market Recent Trends
Retail and Quick Service Supply Moving Toward Fewer Larger Centralized Bakeries
Bakery supply is shifting from many small regional plants toward fewer, larger and more automated bakeries that serve retailer and quick-service contracts across wider areas. This replaces a model in which each region kept its own plant to deliver short-life products within hours, because centralized lines now lower the cost per loaf and meet the specification consistency that retailers and quick-service chains ask for.
In May 2025, Lantmännen Unibake Holding A/S announced an investment of about USD 73 million in a new bread facility in Örebro, Sweden, adding modern capacity at one site. In the same month, The J.M. Smucker Company said it plans to close its Hostess plant in Indianapolis, United States, and look for a new owner for the facility, which removes a sweet bakery site from its footprint.
Through 2033, retailers and quick-service chains are likely to concentrate supply contracts with producers that operate large, automated sites and can qualify across several regions. Sub-scale regional bakeries face a higher qualification threshold, while larger groups gain volume per plant. Demand for industrial bread and packaged bakery output therefore concentrates in fewer, higher-capacity facilities.
Artificial Intelligence Document Checks and Robotic Tray Handling Entering Industrial Bakery Workflows
Industrial bakeries are adopting artificial intelligence (AI) tools that remove two manual bottlenecks: checking incoming ingredient documentation and handling trays at the oven and display. Paper-based supplier certificate checks and manual tray loading depend on scarce labor and vary from shift to shift, whereas machine-read documents and robotic handling apply the same rule and motion every time.
In March 2025, Bimbo International used TraceGains software in which AI-assisted optical character recognition (OCR) compares supplier specification certificates and flags issues, allowing non-conforming shipments to be refused. In December 2025, the International Federation of Robotics (IFR) published a case study on a prototype cell from FANUC, WIESHEU and Wanzl in which a robot loads trays, moves them in and out of the oven and stocks displays. Neither example has disclosed a measured yield, uptime or throughput gain.
Adoption requires structured specification data, integration with plant systems and operators trained on the new workflow, which favors large groups that already run digital platforms, as Bimbo International's certificate checks do. Suppliers that can prove throughput, waste or labor gains will differentiate in the industry, while sub-scale bakeries wait for lower-cost, proven cells. Demand therefore shifts toward automation-ready industrial lines and away from labor-dependent manual handling.
Bakery Products Market Future Opportunities
Localized Bun Plants Serving Quick Service Restaurant Chains Away from Existing Production Hubs
Quick-service restaurant chains and foodservice operators need bakery supply that is consistent and labor-light, yet many locations sit far from the plants that make it. Frozen and par-baked product can travel, but long cold-chain distances and the capital cost of a modern plant have kept local capacity in the bakery industry limited, so the gap has not closed on its own.
On 22 January 2026, ARYZTA AG announced a bun plant near Lisbon, Portugal, to serve quick-service restaurants, with construction starting in 2026 and full operation planned by 2028. The plan confirms that suppliers are placing dedicated capacity close to chain customers. Companies can capture the same opening through regional plants, joint ventures with local operators and acquisitions of local bakers.
Execution takes purpose-built capacity, approval from chain customers' quality teams and distribution that keeps product within range of each restaurant location. Global frozen and foodservice bakers that partner with local operators are best placed to move first, while importers without plants remain exposed to freight time. Where these plants open, quick-service chains gain a local source of buns and rolls, and the demand upside is contracted volume rather than one-off supply.
Unlock Market Intelligence
Explore the market potential with our data-driven report
Bakery Products Market Segmentation Analysis
By Product Type:
- Bread & Rolls
- Cakes & Pastries
- Biscuits & Cookies
- Crackers & Savory Bakery Products
- Rusks & Toasted Bakery Products
- Other Bakery Products
Daily Staple Status Keeps Bread and Rolls at Roughly 38% of Product Type Demand
Bread & Rolls account for an estimated 38.4% of product-type demand in 2026. Their lead comes from frequent household purchases and broad use across breakfast, sandwiches and meals. They also serve both packaged retail and foodservice customers, giving the category more regular purchasing occasions than products reserved mainly for snacks or desserts. Producers can vary loaf size, grain mix and bun format while retaining the everyday use that supports the segment’s volume.
Cakes & Pastries are projected to grow fastest, at a 6.62% CAGR from 2027 to 2033. Their growth case rests on variety and the ability to serve individual treats, breakfast and sharing occasions at different price points. Product renewal can therefore bring customers back to the category without relying on a single standard format. In May 2026, Flowers Foods introduced new breakfast and snacking products across several brands, including donuts and Danish pastries, illustrating continued development around these occasions.
By Form:
- Fresh
- Frozen
- Ambient / Shelf-Stable
Freshness Expectations Keep Fresh Products at Roughly 60% of Form Demand
Fresh products hold an estimated 60 % share in 2026. Fresh bread, cakes and pastries remain central to routine bakery purchasing because shoppers can readily judge softness, aroma and appearance when choosing them. Bakeries and retailers support that demand through frequent production and replenishment. The format’s scale reflects established daily buying habits across both independent outlets and larger retail chains.
Frozen products are projected to grow fastest, at an 8.91% CAGR from 2027 to 2033. Freezing allows commercial buyers to hold stock and finish products closer to the time of sale, helping them offer a bakery range without producing every item from scratch on site. In February 2025, Vandemoortele announced its acquisition of Lizzi, a frozen bakery specialist operating four production plants in northern Italy. The move illustrates supplier investment in the production base serving this form of the market
Unlock Market Intelligence
Explore the market potential with our data-driven report
Bakery Market Regional Analysis
Europe Leads While Asia Pacific Records the Fastest Growth
Europe accounts for an estimated 30% of the global bakery market in 2026. Its lead rests on frequent bread and bakery purchases supported by both industrial producers and local bakeries. The European Association of Industrial Bakers estimates regional bakery consumption at approximately 42 million tons, with industrial production accounting for about 70%. Capacity is still being added to this established market: in January 2026, ARYZTA announced a new bun bakery in Portugal. Europe is projected to retain the largest regional share in 2033, at 31.5%.
Asia Pacific is projected to grow fastest, at a 7.34% CAGR during 2027–2033, increasing its estimated share from 26.0% to 29.0%. Growth is supported by wider retail access and demand for convenient bakery products across markets with different local tastes. Manufacturers are expanding regional supply: Lotus Bakeries reported that its new Thailand facility delivered its first cookies to Asia Pacific customers in 2025, and ARYZTA opened a bakery in Perth in August 2026. These investments bring production closer to customers and support broader distribution as demand grows

Bakery Products Market Competitive Landscape
The market is fragmented, with the top five companies holding a combined share of approximately 23% in 2027, and no single company holds a controlling position. The five companies are Grupo Bimbo, S.A.B. de C.V., Mondelēz International, Inc., Yamazaki Baking Co., Ltd., Flowers Foods, Inc. and ARYZTA AG, each operating alongside a large number of smaller producers across the industry worldwide.
Key Companies in the Bakery Products Market
- Grupo Bimbo, S.A.B. de C.V.
- Mondelēz International, Inc.
- Yamazaki Baking Co., Ltd.
- Flowers Foods, Inc.
- ARYZTA AG
- pladis Foods Limited
- The Campbell's Company
- Vandemoortele NV
- Barilla G. e R. Fratelli S.p.A.
- McKee Foods Corporation
- EUROPASTRY, S.A.
- Britannia Industries Limited
- Lantmännen Unibake Holding A/S
- PARLE PRODUCTS PRIVATE LIMITED
- The J.M. Smucker Company
Company Profiling
The following profiles cover the five leading companies shaping product development, distribution and competitive positioning in the industry.
Grupo Bimbo, S.A.B. de C.V.: Grupo Bimbo, S.A.B. de C.V. supplies bread, buns, rolls, cakes and other baked goods across multiple regions through a large manufacturing and distribution network. In May 2026, it announced approximately USD 1 billion of investment in its United States operations over 2026–28, supporting its ability to serve that established bakery market.
Mondelēz International, Inc.: Mondelēz International, Inc. participates through biscuit, cookie and cracker brands including Oreo, Ritz and belVita. In September 2026, the company detailed the production of its limited-edition Oreo and BTS cookie, showing how it uses product variation and brand collaborations within its baked-snack portfolio.
Yamazaki Baking Co., Ltd.: Yamazaki Baking Co., Ltd. produces bread, sweet buns and other bakery products for the Japanese market and operates bakery businesses elsewhere in Asia. In August 2026, it announced limited-edition Calpis-flavored cream buns, Lunch Pack sandwiches and steamed cakes, extending familiar product lines through a seasonal collaboration.
Flowers Foods, Inc.: Flowers Foods, Inc. supplies breads, buns and snack products through brands including Nature’s Own, Dave’s Killer Bread, Canyon Bakehouse, Wonder and Tastykake. In May 2026, it introduced new breakfast and snacking products across several brands, expanding its range of bakery eating occasions.
ARYZTA AG: ARYZTA AG supplies bakery products to foodservice and retail customers across Europe, Asia, Australia and New Zealand. In August 2026, it opened a bakery near Perth to manufacture products for Australian quick-service restaurant customers, adding local production capacity in Western Australia.
Recent Developments in the Bakery Products Market
- August 2026: In August 2026, Delice de France launched its Spring/Summer catalogue of 47 new products across bread, patisserie, snacks and chilled, including seven varieties of fully baked bagels, a hinged-cut multiseed sub roll and a multi-grain country roll. The range gives foodservice operators finished bakery items from one supplier, which shifts menu consumption toward supplier-led ranges and raises the range breadth that competing foodservice bakers must match.
Frequently Asked Questions
Related Report
- Market Segmentation
- Research Scope
- Research Methodology
- Definitions and Assumptions
- Executive Summary
- Global Bakery Products Market Policies, Regulations, and Standards
- Global Bakery Products Market Dynamics
- Growth Factors
- Challenges
- Trends
- Opportunities
- Global Bakery Products Market Statistics, 2023-2033F
- Market Size & Growth Outlook
- By Revenues in USD Million
- Market Segmentation & Growth Outlook
- By Product Type
- Bread & Rolls- Market Insights and Forecast 2023-2033, USD Million
- Cakes & Pastries- Market Insights and Forecast 2023-2033, USD Million
- Biscuits & Cookies- Market Insights and Forecast 2023-2033, USD Million
- Crackers & Savory Bakery Products- Market Insights and Forecast 2023-2033, USD Million
- Rusks & Toasted Bakery Products- Market Insights and Forecast 2023-2033, USD Million
- Other Bakery Products- Market Insights and Forecast 2023-2033, USD Million
- By Form
- Fresh- Market Insights and Forecast 2023-2033, USD Million
- Frozen- Market Insights and Forecast 2023-2033, USD Million
- Ambient / Shelf-Stable- Market Insights and Forecast 2023-2033, USD Million
- By Distribution Channel
- Supermarkets & Hypermarkets- Market Insights and Forecast 2023-2033, USD Million
- Convenience Stores- Market Insights and Forecast 2023-2033, USD Million
- Bakery & Specialty Stores- Market Insights and Forecast 2023-2033, USD Million
- Online Retail- Market Insights and Forecast 2023-2033, USD Million
- Other Retail Channels- Market Insights and Forecast 2023-2033, USD Million
- By Region
- North America
- South America
- Europe
- Middle East & Africa
- Asia Pacific
- By Competitors
- Competition Characteristics
- Market Share & Analysis
- By Product Type
- Market Size & Growth Outlook
- North America Bakery Products Market Statistics, 2023-2033F
- Market Size & Growth Outlook
- By Revenues in USD Million
- Market Segmentation & Growth Outlook
- By Product Type- Market Insights and Forecast 2023-2033, USD Million
- By Form- Market Insights and Forecast 2023-2033, USD Million
- By Distribution Channel- Market Insights and Forecast 2023-2033, USD Million
- By Country
- The US
- Canada
- Mexico
- The US Bakery Products Market Statistics, 2023-2033F
- Market Size & Growth Outlook
- By Revenues in USD Million
- Market Segmentation & Growth Outlook
- By Product Type- Market Insights and Forecast 2023-2033, USD Million
- By Form- Market Insights and Forecast 2023-2033, USD Million
- By Distribution Channel- Market Insights and Forecast 2023-2033, USD Million
- Market Size & Growth Outlook
- Canada Bakery Products Market Statistics, 2023-2033F
- Market Size & Growth Outlook
- By Revenues in USD Million
- Market Segmentation & Growth Outlook
- By Product Type- Market Insights and Forecast 2023-2033, USD Million
- By Form- Market Insights and Forecast 2023-2033, USD Million
- By Distribution Channel- Market Insights and Forecast 2023-2033, USD Million
- Market Size & Growth Outlook
- Mexico Bakery Products Market Statistics, 2023-2033F
- Market Size & Growth Outlook
- By Revenues in USD Million
- Market Segmentation & Growth Outlook
- By Product Type- Market Insights and Forecast 2023-2033, USD Million
- By Form- Market Insights and Forecast 2023-2033, USD Million
- By Distribution Channel- Market Insights and Forecast 2023-2033, USD Million
- Market Size & Growth Outlook
- Market Size & Growth Outlook
- South America Bakery Products Market Statistics, 2023-2033F
- Market Size & Growth Outlook
- By Revenues in USD Million
- Market Segmentation & Growth Outlook
- By Product Type- Market Insights and Forecast 2023-2033, USD Million
- By Form- Market Insights and Forecast 2023-2033, USD Million
- By Distribution Channel- Market Insights and Forecast 2023-2033, USD Million
- By Country
- Brazil
- Argentina
- Chile
- Rest of South America
- Brazil Bakery Products Market Statistics, 2023-2033F
- Market Size & Growth Outlook
- By Revenues in USD Million
- Market Segmentation & Growth Outlook
- By Product Type- Market Insights and Forecast 2023-2033, USD Million
- By Form- Market Insights and Forecast 2023-2033, USD Million
- By Distribution Channel- Market Insights and Forecast 2023-2033, USD Million
- Market Size & Growth Outlook
- Argentina Bakery Products Market Statistics, 2023-2033F
- Market Size & Growth Outlook
- By Revenues in USD Million
- Market Segmentation & Growth Outlook
- By Product Type- Market Insights and Forecast 2023-2033, USD Million
- By Form- Market Insights and Forecast 2023-2033, USD Million
- By Distribution Channel- Market Insights and Forecast 2023-2033, USD Million
- Market Size & Growth Outlook
- Chile Bakery Products Market Statistics, 2023-2033F
- Market Size & Growth Outlook
- By Revenues in USD Million
- Market Segmentation & Growth Outlook
- By Product Type- Market Insights and Forecast 2023-2033, USD Million
- By Form- Market Insights and Forecast 2023-2033, USD Million
- By Distribution Channel- Market Insights and Forecast 2023-2033, USD Million
- Market Size & Growth Outlook
- Market Size & Growth Outlook
- Europe Bakery Products Market Statistics, 2023-2033F
- Market Size & Growth Outlook
- By Revenues in USD Million
- Market Segmentation & Growth Outlook
- By Product Type- Market Insights and Forecast 2023-2033, USD Million
- By Form- Market Insights and Forecast 2023-2033, USD Million
- By Distribution Channel- Market Insights and Forecast 2023-2033, USD Million
- By Country
- Germany
- The UK
- France
- Italy
- Spain
- BENELUX
- Nordics
- Rest of Europe
- Germany Bakery Products Market Statistics, 2023-2033F
- Market Size & Growth Outlook
- By Revenues in USD Million
- Market Segmentation & Growth Outlook
- By Product Type- Market Insights and Forecast 2023-2033, USD Million
- By Form- Market Insights and Forecast 2023-2033, USD Million
- By Distribution Channel- Market Insights and Forecast 2023-2033, USD Million
- Market Size & Growth Outlook
- The UK Bakery Products Market Statistics, 2023-2033F
- Market Size & Growth Outlook
- By Revenues in USD Million
- Market Segmentation & Growth Outlook
- By Product Type- Market Insights and Forecast 2023-2033, USD Million
- By Form- Market Insights and Forecast 2023-2033, USD Million
- By Distribution Channel- Market Insights and Forecast 2023-2033, USD Million
- Market Size & Growth Outlook
- France Bakery Products Market Statistics, 2023-2033F
- Market Size & Growth Outlook
- By Revenues in USD Million
- Market Segmentation & Growth Outlook
- By Product Type- Market Insights and Forecast 2023-2033, USD Million
- By Form- Market Insights and Forecast 2023-2033, USD Million
- By Distribution Channel- Market Insights and Forecast 2023-2033, USD Million
- Market Size & Growth Outlook
- Italy Bakery Products Market Statistics, 2023-2033F
- Market Size & Growth Outlook
- By Revenues in USD Million
- Market Segmentation & Growth Outlook
- By Product Type- Market Insights and Forecast 2023-2033, USD Million
- By Form- Market Insights and Forecast 2023-2033, USD Million
- By Distribution Channel- Market Insights and Forecast 2023-2033, USD Million
- Market Size & Growth Outlook
- Spain Bakery Products Market Statistics, 2023-2033F
- Market Size & Growth Outlook
- By Revenues in USD Million
- Market Segmentation & Growth Outlook
- By Product Type- Market Insights and Forecast 2023-2033, USD Million
- By Form- Market Insights and Forecast 2023-2033, USD Million
- By Distribution Channel- Market Insights and Forecast 2023-2033, USD Million
- Market Size & Growth Outlook
- BENELUX Bakery Products Market Statistics, 2023-2033F
- Market Size & Growth Outlook
- By Revenues in USD Million
- Market Segmentation & Growth Outlook
- By Product Type- Market Insights and Forecast 2023-2033, USD Million
- By Form- Market Insights and Forecast 2023-2033, USD Million
- By Distribution Channel- Market Insights and Forecast 2023-2033, USD Million
- Market Size & Growth Outlook
- Nordics Bakery Products Market Statistics, 2023-2033F
- Market Size & Growth Outlook
- By Revenues in USD Million
- Market Segmentation & Growth Outlook
- By Product Type- Market Insights and Forecast 2023-2033, USD Million
- By Form- Market Insights and Forecast 2023-2033, USD Million
- By Distribution Channel- Market Insights and Forecast 2023-2033, USD Million
- Market Size & Growth Outlook
- Market Size & Growth Outlook
- Middle East & Africa Bakery Products Market Statistics, 2023-2033F
- Market Size & Growth Outlook
- By Revenues in USD Million
- Market Segmentation & Growth Outlook
- By Product Type- Market Insights and Forecast 2023-2033, USD Million
- By Form- Market Insights and Forecast 2023-2033, USD Million
- By Distribution Channel- Market Insights and Forecast 2023-2033, USD Million
- By Country
- UAE
- Saudi Arabia
- South Africa
- Turkey
- Rest of Middle East & Africa
- UAE Bakery Products Market Statistics, 2023-2033F
- Market Size & Growth Outlook
- By Revenues in USD Million
- Market Segmentation & Growth Outlook
- By Product Type- Market Insights and Forecast 2023-2033, USD Million
- By Form- Market Insights and Forecast 2023-2033, USD Million
- By Distribution Channel- Market Insights and Forecast 2023-2033, USD Million
- Market Size & Growth Outlook
- Saudi Arabia Bakery Products Market Statistics, 2023-2033F
- Market Size & Growth Outlook
- By Revenues in USD Million
- Market Segmentation & Growth Outlook
- By Product Type- Market Insights and Forecast 2023-2033, USD Million
- By Form- Market Insights and Forecast 2023-2033, USD Million
- By Distribution Channel- Market Insights and Forecast 2023-2033, USD Million
- Market Size & Growth Outlook
- South Africa Bakery Products Market Statistics, 2023-2033F
- Market Size & Growth Outlook
- By Revenues in USD Million
- Market Segmentation & Growth Outlook
- By Product Type- Market Insights and Forecast 2023-2033, USD Million
- By Form- Market Insights and Forecast 2023-2033, USD Million
- By Distribution Channel- Market Insights and Forecast 2023-2033, USD Million
- Market Size & Growth Outlook
- Turkey Bakery Products Market Statistics, 2023-2033F
- Market Size & Growth Outlook
- By Revenues in USD Million
- Market Segmentation & Growth Outlook
- By Product Type- Market Insights and Forecast 2023-2033, USD Million
- By Form- Market Insights and Forecast 2023-2033, USD Million
- By Distribution Channel- Market Insights and Forecast 2023-2033, USD Million
- Market Size & Growth Outlook
- Market Size & Growth Outlook
- Asia Pacific Bakery Products Market Statistics, 2023-2033F
- Market Size & Growth Outlook
- By Revenues in USD Million
- Market Segmentation & Growth Outlook
- By Product Type- Market Insights and Forecast 2023-2033, USD Million
- By Form- Market Insights and Forecast 2023-2033, USD Million
- By Distribution Channel- Market Insights and Forecast 2023-2033, USD Million
- By Country
- China
- India
- Japan
- South Korea
- Australia
- Southeast Asia
- Rest of Asia Pacific
- China Bakery Products Market Statistics, 2023-2033F
- Market Size & Growth Outlook
- By Revenues in USD Million
- Market Segmentation & Growth Outlook
- By Product Type- Market Insights and Forecast 2023-2033, USD Million
- By Form- Market Insights and Forecast 2023-2033, USD Million
- By Distribution Channel- Market Insights and Forecast 2023-2033, USD Million
- Market Size & Growth Outlook
- India Bakery Products Market Statistics, 2023-2033F
- Market Size & Growth Outlook
- By Revenues in USD Million
- Market Segmentation & Growth Outlook
- By Product Type- Market Insights and Forecast 2023-2033, USD Million
- By Form- Market Insights and Forecast 2023-2033, USD Million
- By Distribution Channel- Market Insights and Forecast 2023-2033, USD Million
- Market Size & Growth Outlook
- Japan Bakery Products Market Statistics, 2023-2033F
- Market Size & Growth Outlook
- By Revenues in USD Million
- Market Segmentation & Growth Outlook
- By Product Type- Market Insights and Forecast 2023-2033, USD Million
- By Form- Market Insights and Forecast 2023-2033, USD Million
- By Distribution Channel- Market Insights and Forecast 2023-2033, USD Million
- Market Size & Growth Outlook
- South Korea Bakery Products Market Statistics, 2023-2033F
- Market Size & Growth Outlook
- By Revenues in USD Million
- Market Segmentation & Growth Outlook
- By Product Type- Market Insights and Forecast 2023-2033, USD Million
- By Form- Market Insights and Forecast 2023-2033, USD Million
- By Distribution Channel- Market Insights and Forecast 2023-2033, USD Million
- Market Size & Growth Outlook
- Australia Bakery Products Market Statistics, 2023-2033F
- Market Size & Growth Outlook
- By Revenues in USD Million
- Market Segmentation & Growth Outlook
- By Product Type- Market Insights and Forecast 2023-2033, USD Million
- By Form- Market Insights and Forecast 2023-2033, USD Million
- By Distribution Channel- Market Insights and Forecast 2023-2033, USD Million
- Market Size & Growth Outlook
- Southeast Asia Bakery Products Market Statistics, 2023-2033F
- Market Size & Growth Outlook
- By Revenues in USD Million
- Market Segmentation & Growth Outlook
- By Product Type- Market Insights and Forecast 2023-2033, USD Million
- By Form- Market Insights and Forecast 2023-2033, USD Million
- By Distribution Channel- Market Insights and Forecast 2023-2033, USD Million
- Market Size & Growth Outlook
- Market Size & Growth Outlook
- Competitive Outlook
- Company Profiles
- Grupo Bimbo, S.A.B. de C.V.
- Business Description
- Product Portfolio
- Collaborations & Alliances
- Recent Developments
- Financial Details
- Others
- Mondelēz International, Inc.
- Business Description
- Product Portfolio
- Collaborations & Alliances
- Recent Developments
- Financial Details
- Others
- Yamazaki Baking Co., Ltd.
- Business Description
- Product Portfolio
- Collaborations & Alliances
- Recent Developments
- Financial Details
- Others
- Flowers Foods, Inc.
- Business Description
- Product Portfolio
- Collaborations & Alliances
- Recent Developments
- Financial Details
- Others
- ARYZTA AG
- Business Description
- Product Portfolio
- Collaborations & Alliances
- Recent Developments
- Financial Details
- Others
- pladis Foods Limited
- Business Description
- Product Portfolio
- Collaborations & Alliances
- Recent Developments
- Financial Details
- Others
- The Campbell’s Company
- Business Description
- Product Portfolio
- Collaborations & Alliances
- Recent Developments
- Financial Details
- Others
- Vandemoortele NV
- Business Description
- Product Portfolio
- Collaborations & Alliances
- Recent Developments
- Financial Details
- Others
- Barilla G. e R. Fratelli S.p.A.
- Business Description
- Product Portfolio
- Collaborations & Alliances
- Recent Developments
- Financial Details
- Others
- McKee Foods Corporation
- Business Description
- Product Portfolio
- Collaborations & Alliances
- Recent Developments
- Financial Details
- Others
- EUROPASTRY, S.A.
- Business Description
- Product Portfolio
- Collaborations & Alliances
- Recent Developments
- Financial Details
- Others
- Britannia Industries Limited
- Business Description
- Product Portfolio
- Collaborations & Alliances
- Recent Developments
- Financial Details
- Others
- Lantmännen Unibake Holding A/S
- Business Description
- Product Portfolio
- Collaborations & Alliances
- Recent Developments
- Financial Details
- Others
- PARLE PRODUCTS PRIVATE LIMITED
- Business Description
- Product Portfolio
- Collaborations & Alliances
- Recent Developments
- Financial Details
- Others
- The J.M. Smucker Company
- Business Description
- Product Portfolio
- Collaborations & Alliances
- Recent Developments
- Financial Details
- Others
- Grupo Bimbo, S.A.B. de C.V.
- Company Profiles
- Disclaimer
| Segment | Sub-Segment |
|---|---|
| By Product Type |
|
| By Form |
|
| By Distribution Channel |
|
| By Region |
|
Research Methodology
This study followed a structured approach comprising four key phases to assess the size and scope of the electro-oxidation market. The process began with thorough secondary research to collect data on the target market, related markets, and broader industry context. These findings, along with preliminary assumptions and estimates, were then validated through extensive primary research involving industry experts from across the value chain. To calculate the overall market size, both top-down and bottom-up methodologies were employed. Finally, market segmentation and data triangulation techniques were applied to refine and validate segment-level estimations.
Secondary Research
The secondary research phase involved gathering data from a wide range of credible and published sources. This step helped in identifying industry trends, defining market segmentation, and understanding the market landscape and value chain.
Sources consulted during this phase included:
- Company annual reports, investor presentations, and press releases
- Industry white papers and certified publications
- Trade directories and market-recognized databases
- Articles from authoritative authors and reputable journals
- Gold and silver standard websites
Secondary research was critical in mapping out the industry's value chain and monetary flow, identifying key market segments, understanding regional variations, and tracking significant industry developments.
Other key sources:
- Financial disclosures
- Industry associations and trade bodies
- News outlets and business magazines
- Academic journals and research studies
- Paid industry databases
Primary Research
To validate secondary data and gain deeper market insights, primary research was conducted with key stakeholders across both the supply and demand sides of the market.
On the demand side, participants included decision-makers and influencers from end-user industries—such as CIOs, CTOs, and CSOs—who provided first-hand perspectives on market needs, product usage, and future expectations.
On the supply side, interviews were conducted with manufacturers, industry associations, and institutional participants to gather insights into current offerings, product pipelines, and market challenges.
Primary interviews provided critical inputs such as:
- Market size and revenue data
- Product and service breakdowns
- Market forecasts
- Regional and application-specific trends
Stakeholders consulted included:
- Leading OEM and solution providers
- Channel and distribution partners
- End users across various applications
- Independent consultants and industry specialists
Market Size Estimation and Data Triangulation
- Identifying Key Market Participants (Secondary Research)
- Goal: To identify the major players or companies in the target market. This typically involves using publicly available data sources such as industry reports, market research publications, and financial statements of companies.
- Tools: Reports from firms like Gartner, Forrester, Euromonitor, Statista, IBISWorld, and others. Public financial statements, news articles, and press releases from top market players.
- Extracting Earnings of Key Market Participants
- Goal: To estimate the earnings generated from the product or service being analyzed. This step helps in understanding the revenue potential of each market player in a specific geography.
- Methods: Earnings data can be gathered from:
- Publicly available financial reports (for listed companies).
- Interviews and primary data sources from professionals, such as Directors, VPs, SVPs, etc. This is especially useful for understanding more nuanced, internal data that isn't publicly disclosed.
- Annual reports and investor presentations of key players.
- Data Collation and Development of a Relevant Data Model
- Goal: To collate inputs from both primary and secondary sources into a structured, data-driven model for market estimation. This model will incorporate key market KPIs and any independent variables relevant to the market.
- Key KPIs: These could include:
- Market size, growth rate, and demand drivers.
- Industry-specific metrics like market share, average revenue per customer (ARPC), or average deal size.
- External variables, such as economic growth rates, inflation rates, or commodity prices, that could affect the market.
- Data Modeling: Based on this data, the market forecasts are developed for the next 5 years. A combination of trend analysis, scenario modeling, and statistical regression might be used to generate projections.
- Scenario Analysis
- Goal: To test different assumptions and validate how sensitive the market is to changes in key variables (e.g., market demand, regulatory changes, technological disruptions).
- Types of Scenarios:
- Base Case: Based on current assumptions and historical data.
- Best-Case Scenario: Assuming favorable market conditions, regulatory environments, and technological advancements.
- Worst-Case Scenario: Accounting for adverse factors, such as economic downturns, stricter regulations, or unexpected disruptions.