Global Water & Wastewater Pump Market Report: Trends, Growth and Forecast (2026-2032)
Pump Type (Centrifugal Pumps (End Suction, Split Case, Vertical (Turbine, Axial Pump, Mixed Flow Pump), Submersible Pump), Positive Displacement Pumps (Progressing Cavity, Diaphragm, Gear Pump, Others)), Application (Water, Wastewater), End User (Industrial Water & Wastewater, Municipal Water & Wastewater), Regions (North America, South America, Europe, Middle East & Africa, Asia Pacific) ... Read more
|
Major Players
|
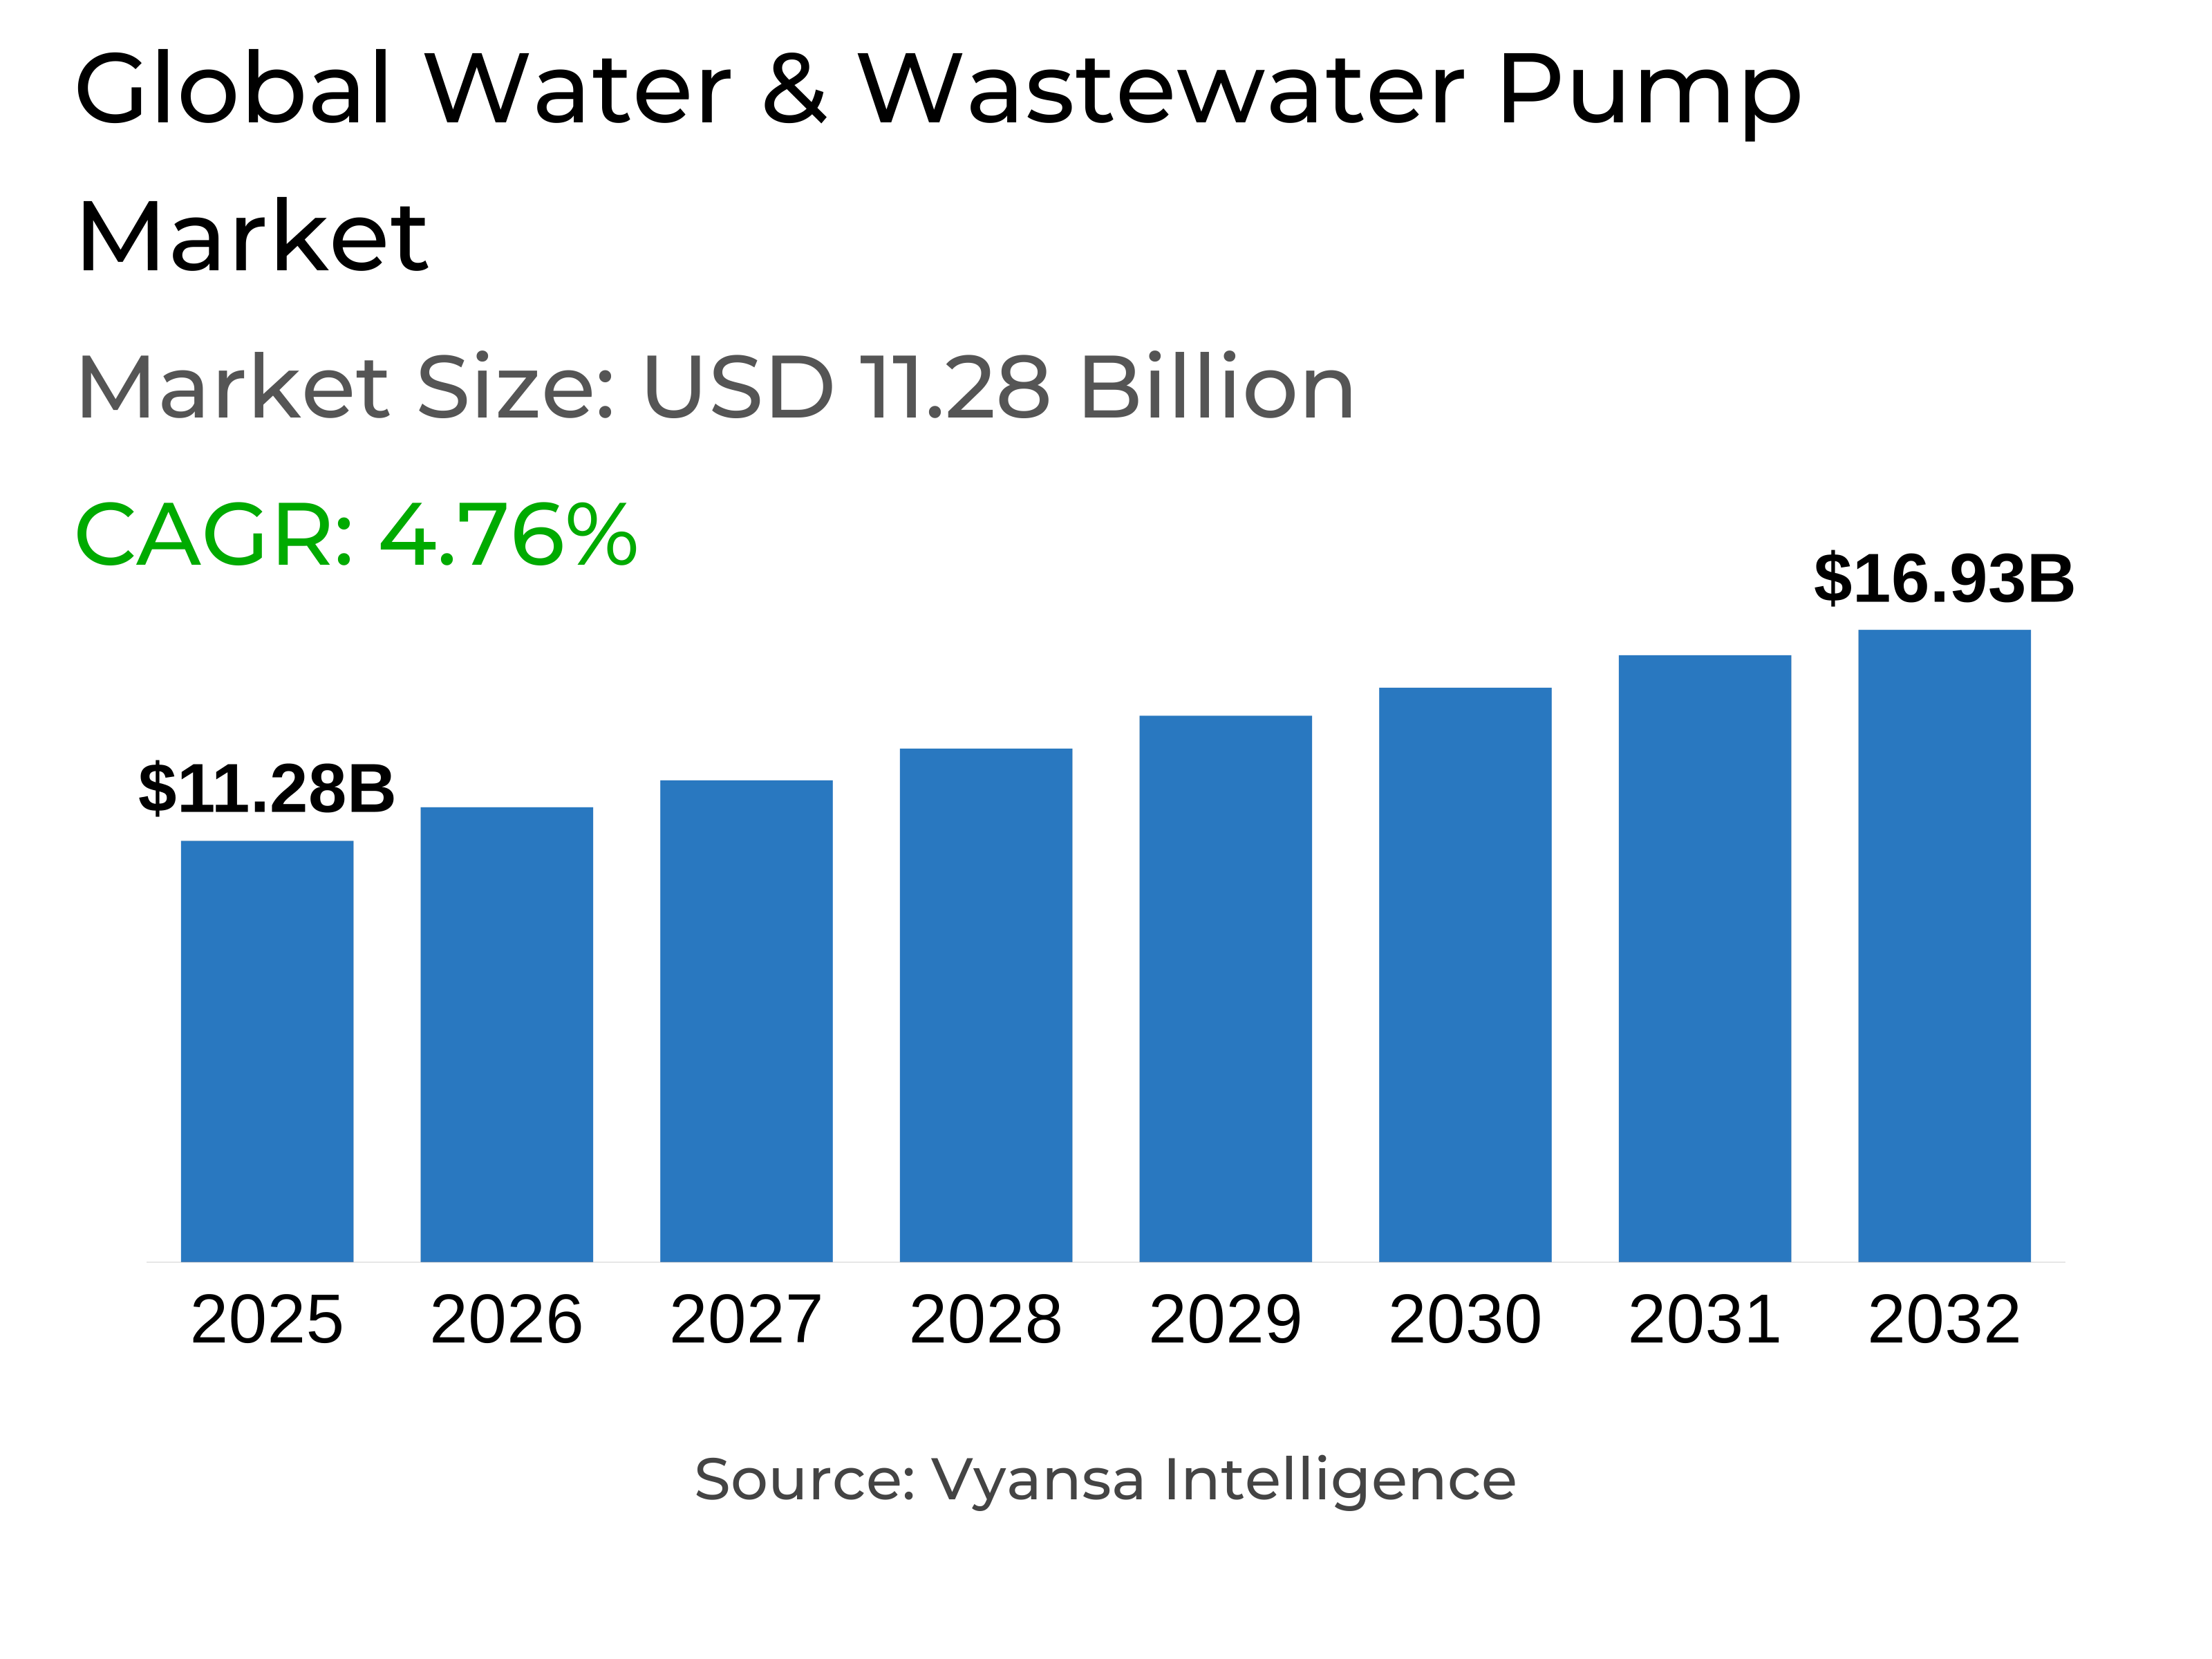
Global Water & Wastewater Pump Market Statistics and Insights, 2026
- Market Size Statistics
- Global water & wastewater pump market is estimated at $ 11.28 billion.
- The market size is expected to grow to $ 16.93 billion by 2032.
- Market to register a cagr of around 4.76% during 2026-32.
- Pump Type Shares
- Centrifugal pumps grabbed market share of 90%.
- Competition
- More than 10 companies are actively engaged in producing water & wastewater pump.
- Top 5 companies acquired around 50% of the market share.
- Xylem Inc., KSB SE & Co. KGaA, WILO SE, Flowserve Corporation, Pentair PLC etc., are few of the top companies.
- End User
- Municipal water & wastewater grabbed 70% of the market.
- Region
- Asia Pacific leads with a 55% share of the global market.
Global Water & Wastewater Pump Market Outlook
The Global Water & Wastewater Pump Market, worth USD 11.28 billion in 2025, is expected to grow to approximately USD 16.93 billion by the year 2032, with a CAGR of about 4.76% for 2026-2032. Increasing population and urbanization are putting tremendous pressure on the available water infrastructure, compelling governments and utilities to increase treatment capacity and improve pumping equipment. With the generation of wastewater set to grow over 50% by 2050, energy-efficient centrifugal pumps are becoming more widely applied to provide reliability, reduce downtime, and meet environmental legislation.
Investment gaps remain a problem for modernization, however. An estimated almost USD 7 trillion will be required in water infrastructure by 2030, according to the World Bank, yet much of the developing world still lags behind on finances. Inadequate capital and prolonged delay in maintenance have resulted in aging infrastructure and inefficient operations. Utilities are now addressing these problems through public-private partnerships and smart finance schemes to finance upgrades of the infrastructure and replacement of the pumps, leading to long-term performance and sustainability.
Technological innovation is reshaping pump operations worldwide. Intelligent monitoring, IoT, and AI-based systems are driving predictive maintenance, energy optimization, and reliability improvement in municipal and industrial applications. Asia-Pacific continues to lead the change with a share of nearly 55% in the global market, with massive government plans in China and India fueling large-scale infrastructure growth.
Centrifugal pumps account for 90% market share because they are universal in their applications across treatment processes. Municipal utilities account for the largest end-user segment with close to 70% share, underpinned by public funding and regulatory requirements for uninterrupted water supply and sanitation. The industrial segment is also emerging as the fastest-growing end user, especially as industries invest in water recycling and zero-liquid-discharge systems for purposes of boosting sustainability and operational efficiency.

Global Water & Wastewater Pump Market Growth Driver
Accelerating Urbanization Drives Expanding Wastewater Treatment Needs
Urbanization at a rapid pace is now the major influencer of the world's water and wastewater management. 55% of the global population reside in cities, which is forecast to grow to 68% by 2050. Urban areas are producing immense volumes of wastewater, beyond present-day treatment capabilities. Such growth calls for treatment infrastructure expansion and effective fluid-handling systems. Wastewater generation is projected to rise by 24% by 2030 and 51% by 2050, compelling governments and utilities to invest heavily in pumping solutions. Centrifugal pumps, known for reliability and efficiency, are increasingly used in aeration, sedimentation, and filtration to support round-the-clock operation in both municipal and industrial facilities.
Urban growth also demands sustainable water infrastructure to support high population densities. Energy-efficient pumps are the focus area for policymakers in order to improve process optimization and cut maintenance expenses. Advanced centrifugal solutions provide stable flow rates, decreased downtime, and environmental compliance. As urbanization increases and water demand heightens, it is imperative to increase treatment capacity using advanced pumping technologies to ensure sustainable urban water management and it is a leading growth driver for the global water and wastewater pump market.
Global Water & Wastewater Pump Market Challenge
Severe Funding Shortfalls Restrict Water Infrastructure Modernization
Massive investment gaps are still one of the most salient impediments to the worldwide water and wastewater industry's progress. The World Bank estimates $7 trillion through 2030 for water-related infrastructure, but present funds fall far short of this figure. Numerous developing countries suffer from financial shortages, with difficulty accessing capital and tariff recovery schemes that stifle utilities from upgrading antiquated systems. The absence of long-term investment postpones modernization and inhibits deployment of high-efficiency centrifugal pumps, sustaining inefficiencies in wastewater collection and treatment plants.
These cost constraints translate to aging networks with leakage, excessive energy usage, and constant failures. Utilities in developing countries also tend to postpone maintenance, raising non-revenue water losses and operational pressure. Unless enhanced financing methods like public-private partnerships or subsidies are developed, modernization is slow. Bridging this gap is crucial for increasing treatment capacity, enhancing service reliability, and ensuring the adoption of advanced energy-efficient pumping technology that can enable sustainable water management globally.
Unlock Market Intelligence
Explore the market potential with our data-driven report
Global Water & Wastewater Pump Market Trend
Digital Transformation Revolutionizes Water Utility Efficiency
Implementation of smart monitoring and artificial intelligence-based technologies is transforming the operations of water utilities around the world. Real-time analytics and predictive maintenance improve early fault detection, reducing downtime by as much as 30% and enhancing pump efficiency. Smart flow systems optimize energy consumption and leakage reduction, enabling utilities to operate big networks with greater precision and reduced operating expenses. Automation. Nowadays, it is an integral part of modern treatment plants, and it aids precision in chemical dosing, flow control, and pump performance in treatment stages.
Asia-Pacific is at the forefront of this digital transition, and Public-Private Partnerships are increasingly a part of incorporating smart infrastructure into a new project. Utilities are deploying IoT-enabled centrifugal pumps facilitating remote monitoring and adaptive control to achieve efficiency and compliance objectives. These technologies enable operators to maximize system performance and streamline lifecycle costs. As water utilities around the world go digital, the convergence of high-tech monitoring and control systems with energy-saving pumping technology is creating a new standard for reliability and operational excellence in contemporary water management.
Global Water & Wastewater Pump Market Opportunity
Industrial Water Reuse Opens High-Value Growth Pathways
Industrial water reuse is emerging as a critical growth opportunity, based on attempts to diminish freshwater usage and deliver sustainable operations. Semiconductor, chemical, and food processing industries are investing in cutting-edge recycling systems to reduce discharge and facilitate regulatory compliance. Data centers, which use as much as 1.5 million liters a day in cooling, rely more and more on centrifugal pumps for continuous recirculation. This trend toward closed-loop water use systems reflects industrial reuse as a key driver of future market growth.
Large-scale infrastructure projects are promoting industrial water reuse in emerging economies. China's $757 billion water conservancy plan and India's Namami Gange initiative demonstrate government devotion to wastewater recycling and reuse. Industrial plants are implementing effective pumping systems to treat challenging effluents and facilitate circular water operations. As sustainability comes to the forefront of industrial strategy, the need for high-performance, durable pumps facilitating water recycling will drive growth, making industrial reuse one of the most exciting segments in the international water and wastewater pump market.
Global Water & Wastewater Pump Market Regional Analysis

By Regions
- North America
- South America
- Europe
- Middle East & Africa
- Asia Pacific
Asia Pacific accounts for around 55% of the world's water and wastewater pump market, making it the industry's focal growth center. Billions of dollars of Chinese infrastructure investments-higher than $757 billion for 2021-2025—have built the biggest in the world water management network, which has over 660 million population. India's AMRUT 2.0 and Namami Gange initiatives are implementing hybrid PPP models to increase sewage treatment capacity beyond metro cities, whereas Indonesia, Vietnam, and the Philippines are boosting private sector involvement with design-build-operate contracts. Japan and South Korea are still upgrading old systems, with priorities on energy-efficient and high-performance pump installations.
Throughout all regions, increasing cooperation among governments, financial institutions, and private operators will be driving long-term investment momentum that entrenches Asia-Pacific as the global leader in water infrastructure development. Increasing industrialization, urban population expansion, and expanding water reuse initiatives will continue to keep the region at the forefront of the demand driver for innovative pumping technologies. As governments step up the linking of water policies to sustainability and efficiency objectives, Asia-Pacific continues to be central to defining world-class developments in water and wastewater management systems.
Unlock Market Intelligence
Explore the market potential with our data-driven report
Global Water & Wastewater Pump Market Segmentation Analysis

By Pump Type
- Centrifugal Pumps
- Positive Displacement Pumps
Centrifugal pumps are used in approximately 90% of water and wastewater treatment processes, demonstrating their unparalleled versatility and reliability in municipal and industrial plants. Single-stage centrifugal pumps, which can handle 3 to 1,680 cubic meters per hour of flow at up to 152 meters of head pressure, are the workhorse of the majority of treatment processes. Overhung impeller designs hold over 45% market share because of their space-saving nature, affordability, and applicability in moderate pressure and flow applications. These facilities enable critical treatment processes like aeration, sedimentation, and sludge management, maximizing process flow and uptime operation.
Vertically suspended configurations address small, space-constrained treatment plants, whereas between-bearing centrifugal pumps provide improved operational reliability in heavy-duty wastewater treatment, offering continuous performance under tough conditions. With sustainability and efficiency goals increasing, centrifugal pump manufacturers are targeting material innovation, energy efficiency, and sophisticated control technologies to boost long-term reliability and minimize lifecycle expenses for end users globally.
By End User
- Industrial Water & Wastewater
- Municipal Water & Wastewater
Municipal utilities control around 70% of the gloabal market, prompted by regulatory requirements, stable funding, and the necessity of public infrastructure to deliver safe water. They must operate in steady, uninterrupted fashion over variable flow rates, supporting the need for long-lasting pumping solutions. Municipal treatment projects globally are combining smart monitoring and automation to minimize the cost of maintenance and enhance energy efficiency, ensuring adaptation to changing environmental regulations while providing continued public service.
At the same time, the industrial market is likely to be the largest-growing end-user sector, with a 4.70% CAGR between 2025-2030. Chemicals, pharmaceuticals, food processing, and mining are all large consumers of high-tech pumps to treat varied and potentially toxic wastewater streams. Increasing focus on water recycling and zero-liquid-discharge systems is fuelling investment in efficient high-performance pumping equipment capable of operating with high-effluent complexity and closed-loop recycling. This shift highlights the increasing influence of industrial end users in forming the future trend of global water and wastewater pump demand.
Top Companies in Global Water & Wastewater Pump Market
The top companies operating in the market include Xylem Inc., KSB SE & Co. KGaA, WILO SE, Flowserve Corporation, Pentair PLC, Sulzer Limited, Kirloskar Brothers Limited (KBL), Grundfos Holding A/S, Ebara Corporation, Franklin Electric, Armstrong Fluid Technologies, etc., are the top players operating in the Global Water & Wastewater Pump Market.
Frequently Asked Questions
Related Report
1. Market Segmentation
1.1. Research Scope
1.2. Research Methodology
1.3. Definitions and Assumptions
2. Executive Summary
3. Global Water & Wastewater Pump Market Policies, Regulations, and Standards
4. Global Water & Wastewater Pump Market Dynamics
4.1. Growth Factors
4.2. Challenges
4.3. Trends
4.4. Opportunities
5. Global Water & Wastewater Pump Market Statistics, 2022-2032F
5.1. Market Size & Growth Outlook
5.1.1.By Revenues in US$ Million
5.2. Market Segmentation & Growth Outlook
5.2.1.By Pump Type
5.2.1.1. Centrifugal Pumps- Market Insights and Forecast 2022-2032, USD Million
5.2.1.1.1. End Suction- Market Insights and Forecast 2022-2032, USD Million
5.2.1.1.2. Split Case- Market Insights and Forecast 2022-2032, USD Million
5.2.1.1.3. Vertical- Market Insights and Forecast 2022-2032, USD Million
5.2.1.1.3.1. Turbine- Market Insights and Forecast 2022-2032, USD Million
5.2.1.1.3.2. Axial Pump- Market Insights and Forecast 2022-2032, USD Million
5.2.1.1.3.3. Mixed Flow Pump- Market Insights and Forecast 2022-2032, USD Million
5.2.1.1.4. Submersible Pump- Market Insights and Forecast 2022-2032, USD Million
5.2.1.2. Positive Displacement Pumps- Market Insights and Forecast 2022-2032, USD Million
5.2.1.2.1. Progressing Cavity- Market Insights and Forecast 2022-2032, USD Million
5.2.1.2.2. Diaphragm- Market Insights and Forecast 2022-2032, USD Million
5.2.1.2.3. Gear Pump- Market Insights and Forecast 2022-2032, USD Million
5.2.1.2.4. Others- Market Insights and Forecast 2022-2032, USD Million
5.2.2.By Application
5.2.2.1. Water- Market Insights and Forecast 2022-2032, USD Million
5.2.2.2. Wastewater- Market Insights and Forecast 2022-2032, USD Million
5.2.3.By End User
5.2.3.1. Industrial Water & Wastewater- Market Insights and Forecast 2022-2032, USD Million
5.2.3.2. Municipal Water & Wastewater- Market Insights and Forecast 2022-2032, USD Million
5.2.4.By Regions
5.2.4.1. North America
5.2.4.2. South America
5.2.4.3. Europe
5.2.4.4. Middle East & Africa
5.2.4.5. Asia Pacific
5.2.5.By Competitors
5.2.5.1. Competition Characteristics
5.2.5.2. Market Share & Analysis
6. North America Water & Wastewater Pump Market Statistics, 2022-2032F
6.1. Market Size & Growth Outlook
6.1.1.By Revenues in US$ Million
6.2. Market Segmentation & Growth Outlook
6.2.1.By Pump Type- Market Insights and Forecast 2022-2032, USD Million
6.2.2.By Application- Market Insights and Forecast 2022-2032, USD Million
6.2.3.By End User- Market Insights and Forecast 2022-2032, USD Million
6.2.4.By Country
6.2.4.1. US
6.2.4.2. Canada
6.2.4.3. Mexico
6.2.4.4. Rest of North America
6.3. US Water & Wastewater Pump Market Statistics, 2022-2032F
6.3.1.Market Size & Growth Outlook
6.3.1.1. By Revenues in US$ Million
6.3.2.Market Segmentation & Growth Outlook
6.3.2.1. By Pump Type- Market Insights and Forecast 2022-2032, USD Million
6.3.2.2. By Application- Market Insights and Forecast 2022-2032, USD Million
6.4. Canada Water & Wastewater Pump Market Statistics, 2022-2032F
6.4.1.Market Size & Growth Outlook
6.4.1.1. By Revenues in US$ Million
6.4.2.Market Segmentation & Growth Outlook
6.4.2.1. By Pump Type- Market Insights and Forecast 2022-2032, USD Million
6.4.2.2. By Application- Market Insights and Forecast 2022-2032, USD Million
6.5. Mexico Water & Wastewater Pump Market Statistics, 2022-2032F
6.5.1.Market Size & Growth Outlook
6.5.1.1. By Revenues in US$ Million
6.5.2.Market Segmentation & Growth Outlook
6.5.2.1. By Pump Type- Market Insights and Forecast 2022-2032, USD Million
6.5.2.2. By Application- Market Insights and Forecast 2022-2032, USD Million
7. South America Water & Wastewater Pump Market Statistics, 2022-2032F
7.1. Market Size & Growth Outlook
7.1.1.By Revenues in US$ Million
7.2. Market Segmentation & Growth Outlook
7.2.1.By Pump Type- Market Insights and Forecast 2022-2032, USD Million
7.2.2.By Application- Market Insights and Forecast 2022-2032, USD Million
7.2.3.By End User- Market Insights and Forecast 2022-2032, USD Million
7.2.4.By Country
7.2.4.1. Brazil
7.2.4.2. Argentina
7.2.4.3. Rest of South America
7.3. Brazil Water & Wastewater Pump Market Statistics, 2022-2032F
7.3.1.Market Size & Growth Outlook
7.3.1.1. By Revenues in US$ Million
7.3.2.Market Segmentation & Growth Outlook
7.3.2.1. By Pump Type- Market Insights and Forecast 2022-2032, USD Million
7.3.2.2. By Application- Market Insights and Forecast 2022-2032, USD Million
7.4. Argentina Water & Wastewater Pump Market Statistics, 2022-2032F
7.4.1.Market Size & Growth Outlook
7.4.1.1. By Revenues in US$ Million
7.4.2.Market Segmentation & Growth Outlook
7.4.2.1. By Pump Type- Market Insights and Forecast 2022-2032, USD Million
7.4.2.2. By Application- Market Insights and Forecast 2022-2032, USD Million
8. Europe Water & Wastewater Pump Market Statistics, 2022-2032F
8.1. Market Size & Growth Outlook
8.1.1.By Revenues in US$ Million
8.2. Market Segmentation & Growth Outlook
8.2.1.By Pump Type- Market Insights and Forecast 2022-2032, USD Million
8.2.2.By Application- Market Insights and Forecast 2022-2032, USD Million
8.2.3.By End User- Market Insights and Forecast 2022-2032, USD Million
8.2.4.By Country
8.2.4.1. Germany
8.2.4.2. UK
8.2.4.3. France
8.2.4.4. Italy
8.2.4.5. Spain
8.2.4.6. Poland
8.2.4.7. Benelux
8.2.4.8. Rest of Europe
8.3. Germany Water & Wastewater Pump Market Statistics, 2022-2032F
8.3.1.Market Size & Growth Outlook
8.3.1.1. By Revenues in US$ Million
8.3.2.Market Segmentation & Growth Outlook
8.3.2.1. By Pump Type- Market Insights and Forecast 2022-2032, USD Million
8.3.2.2. By Application- Market Insights and Forecast 2022-2032, USD Million
8.4. UK Water & Wastewater Pump Market Statistics, 2022-2032F
8.4.1.Market Size & Growth Outlook
8.4.1.1. By Revenues in US$ Million
8.4.2.Market Segmentation & Growth Outlook
8.4.2.1. By Pump Type- Market Insights and Forecast 2022-2032, USD Million
8.4.2.2. By Application- Market Insights and Forecast 2022-2032, USD Million
8.5. France Water & Wastewater Pump Market Statistics, 2022-2032F
8.5.1.Market Size & Growth Outlook
8.5.1.1. By Revenues in US$ Million
8.5.2.Market Segmentation & Growth Outlook
8.5.2.1. By Pump Type- Market Insights and Forecast 2022-2032, USD Million
8.5.2.2. By Application- Market Insights and Forecast 2022-2032, USD Million
8.6. Italy Water & Wastewater Pump Market Statistics, 2022-2032F
8.6.1.Market Size & Growth Outlook
8.6.1.1. By Revenues in US$ Million
8.6.2.Market Segmentation & Growth Outlook
8.6.2.1. By Pump Type- Market Insights and Forecast 2022-2032, USD Million
8.6.2.2. By Application- Market Insights and Forecast 2022-2032, USD Million
8.7. Spain Water & Wastewater Pump Market Statistics, 2022-2032F
8.7.1.Market Size & Growth Outlook
8.7.1.1. By Revenues in US$ Million
8.7.2.Market Segmentation & Growth Outlook
8.7.2.1. By Pump Type- Market Insights and Forecast 2022-2032, USD Million
8.7.2.2. By Application- Market Insights and Forecast 2022-2032, USD Million
8.8. Poland Water & Wastewater Pump Market Statistics, 2022-2032F
8.8.1.Market Size & Growth Outlook
8.8.1.1. By Revenues in US$ Million
8.8.2.Market Segmentation & Growth Outlook
8.8.2.1. By Pump Type- Market Insights and Forecast 2022-2032, USD Million
8.8.2.2. By Application- Market Insights and Forecast 2022-2032, USD Million
8.9. Benelux Water & Wastewater Pump Market Statistics, 2022-2032F
8.9.1.Market Size & Growth Outlook
8.9.1.1. By Revenues in US$ Million
8.9.2.Market Segmentation & Growth Outlook
8.9.2.1. By Pump Type- Market Insights and Forecast 2022-2032, USD Million
8.9.2.2. By Application- Market Insights and Forecast 2022-2032, USD Million
9. Middle East & Africa Water & Wastewater Pump Market Statistics, 2022-2032F
9.1. Market Size & Growth Outlook
9.1.1.By Revenues in US$ Million
9.2. Market Segmentation & Growth Outlook
9.2.1.By Pump Type- Market Insights and Forecast 2022-2032, USD Million
9.2.2.By Application- Market Insights and Forecast 2022-2032, USD Million
9.2.3.By End User- Market Insights and Forecast 2022-2032, USD Million
9.2.4.By Country
9.2.4.1. Saudi Arabia
9.2.4.2. UAE
9.2.4.3. Egypt
9.2.4.4. Nigeria
9.2.4.5. South Africa
9.2.4.6. Rest of Middle East & Africa
9.3. Saudi Arabia Water & Wastewater Pump Market Statistics, 2022-2032F
9.3.1.Market Size & Growth Outlook
9.3.1.1. By Revenues in US$ Million
9.3.2.Market Segmentation & Growth Outlook
9.3.2.1. By Pump Type- Market Insights and Forecast 2022-2032, USD Million
9.3.2.2. By Application- Market Insights and Forecast 2022-2032, USD Million
9.4. UAE Water & Wastewater Pump Market Statistics, 2022-2032F
9.4.1.Market Size & Growth Outlook
9.4.1.1. By Revenues in US$ Million
9.4.2.Market Segmentation & Growth Outlook
9.4.2.1. By Pump Type- Market Insights and Forecast 2022-2032, USD Million
9.4.2.2. By Application- Market Insights and Forecast 2022-2032, USD Million
9.5. Egypt Water & Wastewater Pump Market Statistics, 2022-2032F
9.5.1.Market Size & Growth Outlook
9.5.1.1. By Revenues in US$ Million
9.5.2.Market Segmentation & Growth Outlook
9.5.2.1. By Pump Type- Market Insights and Forecast 2022-2032, USD Million
9.5.2.2. By Application- Market Insights and Forecast 2022-2032, USD Million
9.6. Nigeria Water & Wastewater Pump Market Statistics, 2022-2032F
9.6.1.Market Size & Growth Outlook
9.6.1.1. By Revenues in US$ Million
9.6.2.Market Segmentation & Growth Outlook
9.6.2.1. By Pump Type- Market Insights and Forecast 2022-2032, USD Million
9.6.2.2. By Application- Market Insights and Forecast 2022-2032, USD Million
9.7. South Africa Water & Wastewater Pump Market Statistics, 2022-2032F
9.7.1.Market Size & Growth Outlook
9.7.1.1. By Revenues in US$ Million
9.7.2.Market Segmentation & Growth Outlook
9.7.2.1. By Pump Type- Market Insights and Forecast 2022-2032, USD Million
9.7.2.2. By Application- Market Insights and Forecast 2022-2032, USD Million
10. Asia Pacific Water & Wastewater Pump Market Statistics, 2022-2032F
10.1. Market Size & Growth Outlook
10.1.1. By Revenues in US$ Million
10.2. Market Segmentation & Growth Outlook
10.2.1. By Pump Type- Market Insights and Forecast 2022-2032, USD Million
10.2.2. By Application- Market Insights and Forecast 2022-2032, USD Million
10.2.3. By End User- Market Insights and Forecast 2022-2032, USD Million
10.2.4. By Country
10.2.4.1. China
10.2.4.2. Japan
10.2.4.3. India
10.2.4.4. South Korea
10.2.4.5. Australia
10.2.4.6. Indonesia
10.2.4.7. Rest of Asia
10.3. China Water & Wastewater Pump Market Statistics, 2022-2032F
10.3.1. Market Size & Growth Outlook
10.3.1.1. By Revenues in US$ Million
10.3.2. Market Segmentation & Growth Outlook
10.3.2.1. By Pump Type- Market Insights and Forecast 2022-2032, USD Million
10.3.2.2. By Application- Market Insights and Forecast 2022-2032, USD Million
10.4. Japan Water & Wastewater Pump Market Statistics, 2022-2032F
10.4.1. Market Size & Growth Outlook
10.4.1.1. By Revenues in US$ Million
10.4.2. Market Segmentation & Growth Outlook
10.4.2.1. By Pump Type- Market Insights and Forecast 2022-2032, USD Million
10.4.2.2. By Application- Market Insights and Forecast 2022-2032, USD Million
10.5. India Water & Wastewater Pump Market Statistics, 2022-2032F
10.5.1. Market Size & Growth Outlook
10.5.1.1. By Revenues in US$ Million
10.5.2. Market Segmentation & Growth Outlook
10.5.2.1. By Pump Type- Market Insights and Forecast 2022-2032, USD Million
10.5.2.2. By Application- Market Insights and Forecast 2022-2032, USD Million
10.6. South Korea Water & Wastewater Pump Market Statistics, 2022-2032F
10.6.1. Market Size & Growth Outlook
10.6.1.1. By Revenues in US$ Million
10.6.2. Market Segmentation & Growth Outlook
10.6.2.1. By Pump Type- Market Insights and Forecast 2022-2032, USD Million
10.6.2.2. By Application- Market Insights and Forecast 2022-2032, USD Million
10.7. Australia Water & Wastewater Pump Market Statistics, 2022-2032F
10.7.1. Market Size & Growth Outlook
10.7.1.1. By Revenues in US$ Million
10.7.2. Market Segmentation & Growth Outlook
10.7.2.1. By Pump Type- Market Insights and Forecast 2022-2032, USD Million
10.7.2.2. By Application- Market Insights and Forecast 2022-2032, USD Million
10.8. Indonesia Water & Wastewater Pump Market Statistics, 2022-2032F
10.8.1. Market Size & Growth Outlook
10.8.1.1. By Revenues in US$ Million
10.8.2. Market Segmentation & Growth Outlook
10.8.2.1. By Pump Type- Market Insights and Forecast 2022-2032, USD Million
10.8.2.2. By Application- Market Insights and Forecast 2022-2032, USD Million
11. Competitive Outlook
11.1. Company Profiles
11.1.1. Flowserve Corporation
11.1.1.1. Business Description
11.1.1.2. Product Portfolio
11.1.1.3. Collaborations & Alliances
11.1.1.4. Recent Developments
11.1.1.5. Financial Details
11.1.1.6. Others
11.1.2. Pentair PLC
11.1.2.1. Business Description
11.1.2.2. Product Portfolio
11.1.2.3. Collaborations & Alliances
11.1.2.4. Recent Developments
11.1.2.5. Financial Details
11.1.2.6. Others
11.1.3. Sulzer Limited
11.1.3.1. Business Description
11.1.3.2. Product Portfolio
11.1.3.3. Collaborations & Alliances
11.1.3.4. Recent Developments
11.1.3.5. Financial Details
11.1.3.6. Others
11.1.4. Kirloskar Brothers Limited (KBL)
11.1.4.1. Business Description
11.1.4.2. Product Portfolio
11.1.4.3. Collaborations & Alliances
11.1.4.4. Recent Developments
11.1.4.5. Financial Details
11.1.4.6. Others
11.1.5. Grundfos Holding A/S
11.1.5.1. Business Description
11.1.5.2. Product Portfolio
11.1.5.3. Collaborations & Alliances
11.1.5.4. Recent Developments
11.1.5.5. Financial Details
11.1.5.6. Others
11.1.6. Xylem Inc.
11.1.6.1. Business Description
11.1.6.2. Product Portfolio
11.1.6.3. Collaborations & Alliances
11.1.6.4. Recent Developments
11.1.6.5. Financial Details
11.1.6.6. Others
11.1.7. KSB SE & Co. KGaA
11.1.7.1. Business Description
11.1.7.2. Product Portfolio
11.1.7.3. Collaborations & Alliances
11.1.7.4. Recent Developments
11.1.7.5. Financial Details
11.1.7.6. Others
11.1.8. WILO SE
11.1.8.1. Business Description
11.1.8.2. Product Portfolio
11.1.8.3. Collaborations & Alliances
11.1.8.4. Recent Developments
11.1.8.5. Financial Details
11.1.8.6. Others
11.1.9. Ebara Corporation
11.1.9.1. Business Description
11.1.9.2. Product Portfolio
11.1.9.3. Collaborations & Alliances
11.1.9.4. Recent Developments
11.1.9.5. Financial Details
11.1.9.6. Others
11.1.10. Franklin Electric
11.1.10.1.Business Description
11.1.10.2.Product Portfolio
11.1.10.3.Collaborations & Alliances
11.1.10.4.Recent Developments
11.1.10.5.Financial Details
11.1.10.6.Others
11.1.11. Armstrong Fluid Technologies
11.1.11.1.Business Description
11.1.11.2.Product Portfolio
11.1.11.3.Collaborations & Alliances
11.1.11.4.Recent Developments
11.1.11.5.Financial Details
11.1.11.6.Others
11.1.12. Company 12
11.1.12.1.Business Description
11.1.12.2.Product Portfolio
11.1.12.3.Collaborations & Alliances
11.1.12.4.Recent Developments
11.1.12.5.Financial Details
11.1.12.6.Others
11.1.13. Company 13
11.1.13.1.Business Description
11.1.13.2.Product Portfolio
11.1.13.3.Collaborations & Alliances
11.1.13.4.Recent Developments
11.1.13.5.Financial Details
11.1.13.6.Others
11.1.14. Company 14
11.1.14.1.Business Description
11.1.14.2.Product Portfolio
11.1.14.3.Collaborations & Alliances
11.1.14.4.Recent Developments
11.1.14.5.Financial Details
11.1.14.6.Others
11.1.15. Company 15
11.1.15.1.Business Description
11.1.15.2.Product Portfolio
11.1.15.3.Collaborations & Alliances
11.1.15.4.Recent Developments
11.1.15.5.Financial Details
11.1.15.6.Others
12. Disclaimer
| Segment | Sub-Segment |
|---|---|
| By Pump Type |
|
| By Application |
|
| By End User |
|
| By Regions |
|
Research Methodology
This study followed a structured approach comprising four key phases to assess the size and scope of the electro-oxidation market. The process began with thorough secondary research to collect data on the target market, related markets, and broader industry context. These findings, along with preliminary assumptions and estimates, were then validated through extensive primary research involving industry experts from across the value chain. To calculate the overall market size, both top-down and bottom-up methodologies were employed. Finally, market segmentation and data triangulation techniques were applied to refine and validate segment-level estimations.
Secondary Research
The secondary research phase involved gathering data from a wide range of credible and published sources. This step helped in identifying industry trends, defining market segmentation, and understanding the market landscape and value chain.
Sources consulted during this phase included:
- Company annual reports, investor presentations, and press releases
- Industry white papers and certified publications
- Trade directories and market-recognized databases
- Articles from authoritative authors and reputable journals
- Gold and silver standard websites
Secondary research was critical in mapping out the industry's value chain and monetary flow, identifying key market segments, understanding regional variations, and tracking significant industry developments.
Other key sources:
- Financial disclosures
- Industry associations and trade bodies
- News outlets and business magazines
- Academic journals and research studies
- Paid industry databases
Primary Research
To validate secondary data and gain deeper market insights, primary research was conducted with key stakeholders across both the supply and demand sides of the market.
On the demand side, participants included decision-makers and influencers from end-user industries—such as CIOs, CTOs, and CSOs—who provided first-hand perspectives on market needs, product usage, and future expectations.
On the supply side, interviews were conducted with manufacturers, industry associations, and institutional participants to gather insights into current offerings, product pipelines, and market challenges.
Primary interviews provided critical inputs such as:
- Market size and revenue data
- Product and service breakdowns
- Market forecasts
- Regional and application-specific trends
Stakeholders consulted included:
- Leading OEM and solution providers
- Channel and distribution partners
- End users across various applications
- Independent consultants and industry specialists
Market Size Estimation and Data Triangulation
- Identifying Key Market Participants (Secondary Research)
- Goal: To identify the major players or companies in the target market. This typically involves using publicly available data sources such as industry reports, market research publications, and financial statements of companies.
- Tools: Reports from firms like Gartner, Forrester, Euromonitor, Statista, IBISWorld, and others. Public financial statements, news articles, and press releases from top market players.
- Extracting Earnings of Key Market Participants
- Goal: To estimate the earnings generated from the product or service being analyzed. This step helps in understanding the revenue potential of each market player in a specific geography.
- Methods: Earnings data can be gathered from:
- Publicly available financial reports (for listed companies).
- Interviews and primary data sources from professionals, such as Directors, VPs, SVPs, etc. This is especially useful for understanding more nuanced, internal data that isn't publicly disclosed.
- Annual reports and investor presentations of key players.
- Data Collation and Development of a Relevant Data Model
- Goal: To collate inputs from both primary and secondary sources into a structured, data-driven model for market estimation. This model will incorporate key market KPIs and any independent variables relevant to the market.
- Key KPIs: These could include:
- Market size, growth rate, and demand drivers.
- Industry-specific metrics like market share, average revenue per customer (ARPC), or average deal size.
- External variables, such as economic growth rates, inflation rates, or commodity prices, that could affect the market.
- Data Modeling: Based on this data, the market forecasts are developed for the next 5 years. A combination of trend analysis, scenario modeling, and statistical regression might be used to generate projections.
- Scenario Analysis
- Goal: To test different assumptions and validate how sensitive the market is to changes in key variables (e.g., market demand, regulatory changes, technological disruptions).
- Types of Scenarios:
- Base Case: Based on current assumptions and historical data.
- Best-Case Scenario: Assuming favorable market conditions, regulatory environments, and technological advancements.
- Worst-Case Scenario: Accounting for adverse factors, such as economic downturns, stricter regulations, or unexpected disruptions.


