Australia Industrial Gases Market Report: Trends, Growth and Forecast (2026-2032)
Gas Type (Nitrogen Gas, Oxygen Gas, Carbon Dioxide Gas, Argon Gas, Helium Gas, Hydrogen Gas, Other), Supply Mode (Cylinders, Bulk, On-Site Production, Captive, Other), Application (Combustion and Process Oxygen, Welding and Metal Fabrication, Inerting Blanketing and Heat Treating, Cryogenics and liquefaction, Chemical Synthesis and Hydrogenation, Purging and Purifications, Analytical and Calibration), End User Industry (General Manufacturing, Food, Metallurgy, Chemicals, Healthcare, Electronics, Refining & Energy, Glass, Pulp & Paper, Others) ... Read more
|
Major Players
|
Australia Industrial Gases Market Statistics and Insights, 2026
- Market Size Statistics
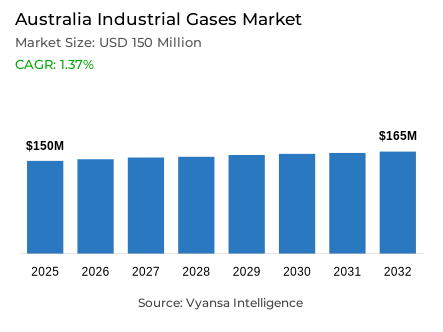
- Industrial gases in Australia is estimated at USD 150 million in 2025.
- The market size is expected to grow to USD 165 million by 2032.
- Market to register a cagr of around 1.37% during 2026-32.
- Gas Type Shares
- Oxygen gas grabbed market share of 50%.
- Competition
- More than 10 companies are actively engaged in producing industrial gases in Australia.
- Top 5 companies acquired around 70% of the market share.
- Iwatani; Coregas (Nippon Sanso); Supagas; Linde; Air Liquide etc., are few of the top companies.
- Supply Mode
- Cylinders grabbed 55% of the market.
Australia Industrial Gases Market Outlook
The continuity of manufacturing, food processing, chemicals, and mining activities should result in further growth in the Australia industrial gases market during 2026-32. Industrial gases in Australia were valued at approximately USD 150 million in 2025 and are expected to attain a value of around USD 165 million by 2032, representing a CAGR of roughly 1.37% during the forecast period. The demand for oxygen, nitrogen, and other atmospheric gases used in the production and processing operations of various industries is aptly met due to the increasing local sourcing in food processing and chemical output. It has remained one of the most important drivers of demand, and the sector contributed approximately AUD 312 billion in value added during the financial year 2024.
Mining and mineral processing are generally very intensive sub-sectors in terms of industrial gases, which have to be used in volumes for the extraction, refining, and other related activities. This kind of ongoing activity supports consistent gas consumption and underpins long-term demand across resource-rich regions of Australia, strengthening the overall market outlook. Meanwhile, supply chain pressures are structuring market dynamics. Constraints in transportation, congestion at ports, oscillations in fuel prices, and labor shortages kept logistics costs through 2023 and 2024 high.
While diesel prices decreased by 18% from 2023, the profit margin for road freight forwarding remains tight, at about 3.9%, limiting flexibility for suppliers. Increasing regulatory and compliance costs, exposure to extreme weather, and global disruptions are expected to remain key considerations through 2025 and beyond. In the segment of gas type, oxygen dominates the market share with approximately 50% due to its crucial usage in metals, chemicals, food production, and health care.
Cylinders remain the dominating supply mode at around 55% market share due to their flexibility for meeting Australia's geographically dispersed demand. Put together, these elements will support a stable but moderate outlook for growth in the Australia industrial gases market through 2032.

Australia Industrial Gases Market Growth Driver
Growth from Expansion of Manufacturing and Industrial Activities
Food processing and chemicals are some of the areas in which Australia's manufacturing sector is growing, hence increasing the demand for industrial gases. Major processors, such as McDonald's Australia, increased sourcing from the local market to more than 330 million kgs of produce in 2023, while continued food and chemical production has also sparked ongoing consistent demand for oxygen, nitrogen, and other atmospheric gases that are required in the operation and processing.
It remains a critical driver, with the mining industry contributing some 312 billion Australian dollars in value added during the financial year 2024. These activities involve huge quantities of industrial gases for various extraction and processing applications, and this supports the overall expansion of the market.
Australia Industrial Gases Market Challenge
Constraints from Intensifying Supply Chain Logistics and Regulatory Pressures
The industrial gas supply chain is under increasing stress due to transportation bottlenecks and cost volatility within Australia. The ongoing global supply chain bottlenecks, inflation, and rising labor costs have kept logistics costs high despite the 18% decrease in diesel prices from 2023. Congestion at ports, changes in fuel prices, and a shortage of labor put immense pressure on freight forwarding and distribution until 2023 and into 2024. The average margin for companies in the road freight forwarding industry is just 3.9%, which does not give much room for flexibility or investment with suppliers. These compressed margins increase the challenge of cryogenic transport for bulk gases, while for end users, it means operational burdens and increasing costs while searching for reliable delivery.
Costs related to compliance with regulations continue to increase as the standards on safety and concern for the environment change. Supply chain risks due to extreme weather events, geopolitical tensions, and port congestion are expected to continue through 2025, requiring sustained investment in logistics resilience and adaptive strategies to maintain stable distribution across Australia's highly diverse geographic markets.
Unlock Market Intelligence
Explore the market potential with our data-driven report
Australia Industrial Gases Market Trend
Green Hydrogen Integration and Energy Transition Dynamics
Australia's hydrogen sector picks up as a transformative element of industrial gas demand. The federal government, in September of 2024, published the 2024 National Hydrogen Strategy, which aspired to more than 1 million tonnes of green hydrogen per year produced by 2030 and up to 15 million tonnes produced by 2050. About 20% of the announced hydrogen projects are currently held by the country, reports the International Energy Agency. Incentive schemes by the government, including the Hydrogen Production Tax Incentive at AUD 2 per kilogram and the expanded Hydrogen Headstart initiative, are driving large-scale investments into the sector.
As hydrogen gains further traction in manufacturing and energy storage, as well as export industries, the demand composition within the Australia industrial gases market will continue to shift structurally toward integrated solutions across both traditional atmospheric gases and clean hydrogen portfolios. Industries like green steel and clean energy manufacturing have begun to assess hydrogen compatibility.
Unlock Market Intelligence
Explore the market potential with our data-driven report
Australia Industrial Gases Market Segmentation Analysis
By Gas Type
- Nitrogen Gas
- Oxygen Gas
- Carbon Dioxide Gas
- Argon Gas
- Helium Gas
- Hydrogen Gas
- Other
Oxygen holds the dominant position in the Australia industrial gases market, accounting for approximately 50% of total share by gas type. This reflects oxygen’s indispensable role in industries such as metals manufacturing, chemical processing, food production, and expanding healthcare applications. Its widespread use highlights both the maturity of oxygen supply infrastructure and the critical dependence of Australia’s industrial ecosystem on oxygen-intensive processes.
Nitrogen and argon provide complementary demand streams, serving applications across welding, metal fabrication, electronics manufacturing, and food preservation. The strong concentration of demand around oxygen reinforces the strategic importance of high-capacity air separation units and bulk liquid oxygen distribution networks located near major industrial and resource extraction zones.

By Supply Mode
- Cylinders
- Bulk
- On-Site Production
- Captive
- Other
Cylinders remain the largest supply mode, capturing 55% of Australia’s industrial gases market share. Their dominance reflects the flexibility they provide for smaller-volume users, the geographic dispersion of demand across Australia, and the simplicity of cylinder-based supply for intermittent usage patterns. Standard cylinder packs-including 4, 9, or 15 G-size cylinders housed in steel frames-form the backbone of packaged gas distribution for small and medium enterprises in welding, maintenance, hospitality, and laboratory settings.
Bulk and liquid supply modes serve fewer but substantially larger industrial clients, contributing high value due to continuous-demand operations. The strong role of cylinder distribution underscores Australia’s diverse customer base and the economic viability of packaged gas logistics across long-distance freight routes supported by established national supply chains.
List of Companies Covered in Australia Industrial Gases Market
The companies listed below are highly influential in the Australia industrial gases market, with a significant market share and a strong impact on industry developments.
- Iwatani
- Coregas (Nippon Sanso)
- Supagas
- Linde
- Air Liquide
- Air Products
- BOC Australia
- BASF
- Wesfarmers Kleenheat Gas
- SOL
Market News & Updates
- Air Liquide S.A., 2025:
Entered agreement with Manildra Group (May 2025) to build Australia's largest food and beverage grade CO₂ plant in Bomaderry, New South Wales, with production capacity exceeding 90,000 tonnes annually; facility will capture and purify biogenic CO₂ from wheat fermentation at Shoalhaven Starches; construction to commence H2 2025 with operational startup expected 2027.
- BOC Australia, 2025:
Commenced operations of new CO₂ processing facility in Longford, Victoria (March 2025) producing over 60,000 tonnes beverage-grade liquid CO₂ annually from long-term supply agreement with Gippsland Basin Joint Venture; facility supports Australian industries in medical, food processing, beverage, hospitality, and manufacturing sectors; signed 10-year renewable energy PPA (through 2035) with ACEN Australia to supply 45% of BOC's grid power needs across Queensland, New South Wales, and Victoria via 400MW solar plant in New England.
Frequently Asked Questions
Related Report
1. Market Segmentation
1.1. Research Scope
1.2. Research Methodology
1.3. Definitions and Assumptions
2. Executive Summary
3. Australia Industrial Gases Market Policies, Regulations, and Standards
4. Australia Industrial Gases Market Dynamics
4.1. Growth Factors
4.2. Challenges
4.3. Trends
4.4. Opportunities
5. Australia Industrial Gases Market Statistics, 2022-2032F
5.1. Market Size & Growth Outlook
5.1.1.By Revenues in USD Million
5.1.2.By Quantity Sold in Tons
5.2. Market Segmentation & Growth Outlook
5.2.1.By Gas Type
5.2.1.1. Nitrogen Gas- Market Insights and Forecast 2022-2032, USD Million & Quantity in Tons
5.2.1.2. Oxygen Gas- Market Insights and Forecast 2022-2032, USD Million & Quantity in Tons
5.2.1.3. Carbon Dioxide Gas- Market Insights and Forecast 2022-2032, USD Million & Quantity in Tons
5.2.1.4. Argon Gas- Market Insights and Forecast 2022-2032, USD Million & Quantity in Tons
5.2.1.5. Helium Gas- Market Insights and Forecast 2022-2032, USD Million & Quantity in Tons
5.2.1.6. Hydrogen Gas- Market Insights and Forecast 2022-2032, USD Million & Quantity in Tons
5.2.1.7. Other- Market Insights and Forecast 2022-2032, USD Million & Quantity in Tons
5.2.2.By Supply Mode
5.2.2.1. Cylinders- Market Insights and Forecast 2022-2032, USD Million & Quantity in Tons
5.2.2.2. Bulk- Market Insights and Forecast 2022-2032, USD Million & Quantity in Tons
5.2.2.3. On-Site Production- Market Insights and Forecast 2022-2032, USD Million & Quantity in Tons
5.2.2.4. Captive- Market Insights and Forecast 2022-2032, USD Million & Quantity in Tons
5.2.2.5. Other- Market Insights and Forecast 2022-2032, USD Million & Quantity in Tons
5.2.3.By Application
5.2.3.1. Combustion and Process Oxygen- Market Insights and Forecast 2022-2032, USD Million & Quantity in Tons
5.2.3.2. Welding and Metal Fabrication- Market Insights and Forecast 2022-2032, USD Million & Quantity in Tons
5.2.3.3. Inerting Blanketing and Heat Treating- Market Insights and Forecast 2022-2032, USD Million & Quantity in Tons
5.2.3.4. Cryogenics and liquefaction- Market Insights and Forecast 2022-2032, USD Million & Quantity in Tons
5.2.3.5. Chemical Synthesis and Hydrogenation- Market Insights and Forecast 2022-2032, USD Million & Quantity in Tons
5.2.3.6. Purging and Purifications- Market Insights and Forecast 2022-2032, USD Million & Quantity in Tons
5.2.3.7. Analytical and Calibration- Market Insights and Forecast 2022-2032, USD Million & Quantity in Tons
5.2.4.By End User Industry
5.2.4.1. General Manufacturing- Market Insights and Forecast 2022-2032, USD Million & Quantity in Tons
5.2.4.2. Food- Market Insights and Forecast 2022-2032, USD Million & Quantity in Tons
5.2.4.3. Metallurgy- Market Insights and Forecast 2022-2032, USD Million & Quantity in Tons
5.2.4.4. Chemicals- Market Insights and Forecast 2022-2032, USD Million & Quantity in Tons
5.2.4.5. Healthcare- Market Insights and Forecast 2022-2032, USD Million & Quantity in Tons
5.2.4.6. Electronics- Market Insights and Forecast 2022-2032, USD Million & Quantity in Tons
5.2.4.7. Refining & Energy- Market Insights and Forecast 2022-2032, USD Million & Quantity in Tons
5.2.4.8. Glass- Market Insights and Forecast 2022-2032, USD Million & Quantity in Tons
5.2.4.9. Pulp & Paper- Market Insights and Forecast 2022-2032, USD Million & Quantity in Tons
5.2.4.10. Others- Market Insights and Forecast 2022-2032, USD Million & Quantity in Tons
5.2.5.By Competitors
5.2.5.1. Competition Characteristics
5.2.5.2. Market Share & Analysis
6. Australia Nitrogen Gas Market Statistics, 2022-2032
6.1. Market Size & Growth Outlook
6.1.1.By Revenues in USD Million
6.1.2.By Quantity Sold in Tons
6.2. Market Segmentation & Growth Outlook
6.2.1.By Supply Mode- Market Insights and Forecast 2022-2032, USD Million & Quantity in Tons
6.2.2.By Application- Market Insights and Forecast 2022-2032, USD Million & Quantity in Tons
6.2.3.By End User Industry- Market Insights and Forecast 2022-2032, USD Million & Quantity in Tons
7. Australia Oxygen Gas Market Statistics, 2022-2032
7.1. Market Size & Growth Outlook
7.1.1.By Revenues in USD Million
7.1.2.By Quantity Sold in Tons
7.2. Market Segmentation & Growth Outlook
7.2.1.By Supply Mode- Market Insights and Forecast 2022-2032, USD Million & Quantity in Tons
7.2.2.By Application- Market Insights and Forecast 2022-2032, USD Million & Quantity in Tons
7.2.3.By End User Industry- Market Insights and Forecast 2022-2032, USD Million & Quantity in Tons
8. Australia Carbon Dioxide Gas Market Statistics, 2022-2032
8.1. Market Size & Growth Outlook
8.1.1.By Revenues in USD Million
8.1.2.By Quantity Sold in Tons
8.2. Market Segmentation & Growth Outlook
8.2.1.By Supply Mode- Market Insights and Forecast 2022-2032, USD Million & Quantity in Tons
8.2.2.By Application- Market Insights and Forecast 2022-2032, USD Million & Quantity in Tons
8.2.3.By End User Industry- Market Insights and Forecast 2022-2032, USD Million & Quantity in Tons
9. Australia Argon Gas Market Statistics, 2022-2032
9.1. Market Size & Growth Outlook
9.1.1.By Revenues in USD Million
9.1.2.By Quantity Sold in Tons
9.2. Market Segmentation & Growth Outlook
9.2.1.By Supply Mode- Market Insights and Forecast 2022-2032, USD Million & Quantity in Tons
9.2.2.By Application- Market Insights and Forecast 2022-2032, USD Million & Quantity in Tons
9.2.3.By End User Industry- Market Insights and Forecast 2022-2032, USD Million & Quantity in Tons
10. Australia Helium Gas Market Statistics, 2022-2032
10.1. Market Size & Growth Outlook
10.1.1. By Revenues in USD Million
10.1.2. By Quantity Sold in Tons
10.2. Market Segmentation & Growth Outlook
10.2.1. By Supply Mode- Market Insights and Forecast 2022-2032, USD Million & Quantity in Tons
10.2.2. By Application- Market Insights and Forecast 2022-2032, USD Million & Quantity in Tons
10.2.3. By End User Industry- Market Insights and Forecast 2022-2032, USD Million & Quantity in Tons
11. Australia Hydrogen Gas Market Statistics, 2022-2032
11.1. Market Size & Growth Outlook
11.1.1. By Revenues in USD Million
11.1.2. By Quantity Sold in Tons
11.2. Market Segmentation & Growth Outlook
11.2.1. By Supply Mode- Market Insights and Forecast 2022-2032, USD Million & Quantity in Tons
11.2.2. By Application- Market Insights and Forecast 2022-2032, USD Million & Quantity in Tons
11.2.3. By End User Industry- Market Insights and Forecast 2022-2032, USD Million & Quantity in Tons
12. Competitive Outlook
12.1. Company Profiles
12.1.1. Linde
12.1.1.1. Business Description
12.1.1.2. Product Portfolio
12.1.1.3. Collaborations & Alliances
12.1.1.4. Recent Developments
12.1.1.5. Financial Details
12.1.1.6. Others
12.1.2. Air Liquide
12.1.2.1. Business Description
12.1.2.2. Product Portfolio
12.1.2.3. Collaborations & Alliances
12.1.2.4. Recent Developments
12.1.2.5. Financial Details
12.1.2.6. Others
12.1.3. Air Products
12.1.3.1. Business Description
12.1.3.2. Product Portfolio
12.1.3.3. Collaborations & Alliances
12.1.3.4. Recent Developments
12.1.3.5. Financial Details
12.1.3.6. Others
12.1.4. BOC (Linde subsidiary)
12.1.4.1. Business Description
12.1.4.2. Product Portfolio
12.1.4.3. Collaborations & Alliances
12.1.4.4. Recent Developments
12.1.4.5. Financial Details
12.1.4.6. Others
12.1.5. SOL
12.1.5.1. Business Description
12.1.5.2. Product Portfolio
12.1.5.3. Collaborations & Alliances
12.1.5.4. Recent Developments
12.1.5.5. Financial Details
12.1.5.6. Others
12.1.6. Iwatani
12.1.6.1. Business Description
12.1.6.2. Product Portfolio
12.1.6.3. Collaborations & Alliances
12.1.6.4. Recent Developments
12.1.6.5. Financial Details
12.1.6.6. Others
12.1.7. Coregas (Nippon Sanso)
12.1.7.1. Business Description
12.1.7.2. Product Portfolio
12.1.7.3. Collaborations & Alliances
12.1.7.4. Recent Developments
12.1.7.5. Financial Details
12.1.7.6. Others
12.1.8. Supagas
12.1.8.1. Business Description
12.1.8.2. Product Portfolio
12.1.8.3. Collaborations & Alliances
12.1.8.4. Recent Developments
12.1.8.5. Financial Details
12.1.8.6. Others
12.1.9. Wesfarmers Kleenheat Gas
12.1.9.1. Business Description
12.1.9.2. Product Portfolio
12.1.9.3. Collaborations & Alliances
12.1.9.4. Recent Developments
12.1.9.5. Financial Details
12.1.9.6. Others
13. Disclaimer
| Segment | Sub-Segment |
|---|---|
| By Gas Type |
|
| By Supply Mode |
|
| By Application |
|
| By End User Industry |
|
Research Methodology
This study followed a structured approach comprising four key phases to assess the size and scope of the electro-oxidation market. The process began with thorough secondary research to collect data on the target market, related markets, and broader industry context. These findings, along with preliminary assumptions and estimates, were then validated through extensive primary research involving industry experts from across the value chain. To calculate the overall market size, both top-down and bottom-up methodologies were employed. Finally, market segmentation and data triangulation techniques were applied to refine and validate segment-level estimations.
Secondary Research
The secondary research phase involved gathering data from a wide range of credible and published sources. This step helped in identifying industry trends, defining market segmentation, and understanding the market landscape and value chain.
Sources consulted during this phase included:
- Company annual reports, investor presentations, and press releases
- Industry white papers and certified publications
- Trade directories and market-recognized databases
- Articles from authoritative authors and reputable journals
- Gold and silver standard websites
Secondary research was critical in mapping out the industry's value chain and monetary flow, identifying key market segments, understanding regional variations, and tracking significant industry developments.
Other key sources:
- Financial disclosures
- Industry associations and trade bodies
- News outlets and business magazines
- Academic journals and research studies
- Paid industry databases
Primary Research
To validate secondary data and gain deeper market insights, primary research was conducted with key stakeholders across both the supply and demand sides of the market.
On the demand side, participants included decision-makers and influencers from end-user industries—such as CIOs, CTOs, and CSOs—who provided first-hand perspectives on market needs, product usage, and future expectations.
On the supply side, interviews were conducted with manufacturers, industry associations, and institutional participants to gather insights into current offerings, product pipelines, and market challenges.
Primary interviews provided critical inputs such as:
- Market size and revenue data
- Product and service breakdowns
- Market forecasts
- Regional and application-specific trends
Stakeholders consulted included:
- Leading OEM and solution providers
- Channel and distribution partners
- End users across various applications
- Independent consultants and industry specialists
Market Size Estimation and Data Triangulation
- Identifying Key Market Participants (Secondary Research)
- Goal: To identify the major players or companies in the target market. This typically involves using publicly available data sources such as industry reports, market research publications, and financial statements of companies.
- Tools: Reports from firms like Gartner, Forrester, Euromonitor, Statista, IBISWorld, and others. Public financial statements, news articles, and press releases from top market players.
- Extracting Earnings of Key Market Participants
- Goal: To estimate the earnings generated from the product or service being analyzed. This step helps in understanding the revenue potential of each market player in a specific geography.
- Methods: Earnings data can be gathered from:
- Publicly available financial reports (for listed companies).
- Interviews and primary data sources from professionals, such as Directors, VPs, SVPs, etc. This is especially useful for understanding more nuanced, internal data that isn't publicly disclosed.
- Annual reports and investor presentations of key players.
- Data Collation and Development of a Relevant Data Model
- Goal: To collate inputs from both primary and secondary sources into a structured, data-driven model for market estimation. This model will incorporate key market KPIs and any independent variables relevant to the market.
- Key KPIs: These could include:
- Market size, growth rate, and demand drivers.
- Industry-specific metrics like market share, average revenue per customer (ARPC), or average deal size.
- External variables, such as economic growth rates, inflation rates, or commodity prices, that could affect the market.
- Data Modeling: Based on this data, the market forecasts are developed for the next 5 years. A combination of trend analysis, scenario modeling, and statistical regression might be used to generate projections.
- Scenario Analysis
- Goal: To test different assumptions and validate how sensitive the market is to changes in key variables (e.g., market demand, regulatory changes, technological disruptions).
- Types of Scenarios:
- Base Case: Based on current assumptions and historical data.
- Best-Case Scenario: Assuming favorable market conditions, regulatory environments, and technological advancements.
- Worst-Case Scenario: Accounting for adverse factors, such as economic downturns, stricter regulations, or unexpected disruptions.


