Vietnam Energy Drink Market Report: Trends, Growth and Forecast (2025-2030)
By Product Type (Alcoholic, Non-Alcoholic), By Consumption (Drinks, Shots, Mixers), By Nature (Conventional, Natural/Organic), By Flavour (Flavoured, Unflavoured), By Packaging (Bottles, Metal Cans, Pouches, Others), By Packaging Size (Small, Medium, Large), By End User (Teenagers, Adults, Geriatric), By Sales Channel (On-Trade, Off-Trade) ... Read more

|
Major Players
|
Vietnam Energy Drink Market Statistics, 2025
- Market Size Statistics
- Energy Drink in Vietnam is estimated at $ 1.27 Billion.
- The market size is expected to grow to $ 1.62 Billion by 2030.
- Market to register a CAGR of around 4.14% during 2025-30.
- Product Shares
- Non Alcoholic Energy Drinks grabbed market share of 95%.
- Non Alcoholic Energy Drinks to witness a volume CAGR of around 3.81%.
- Competition
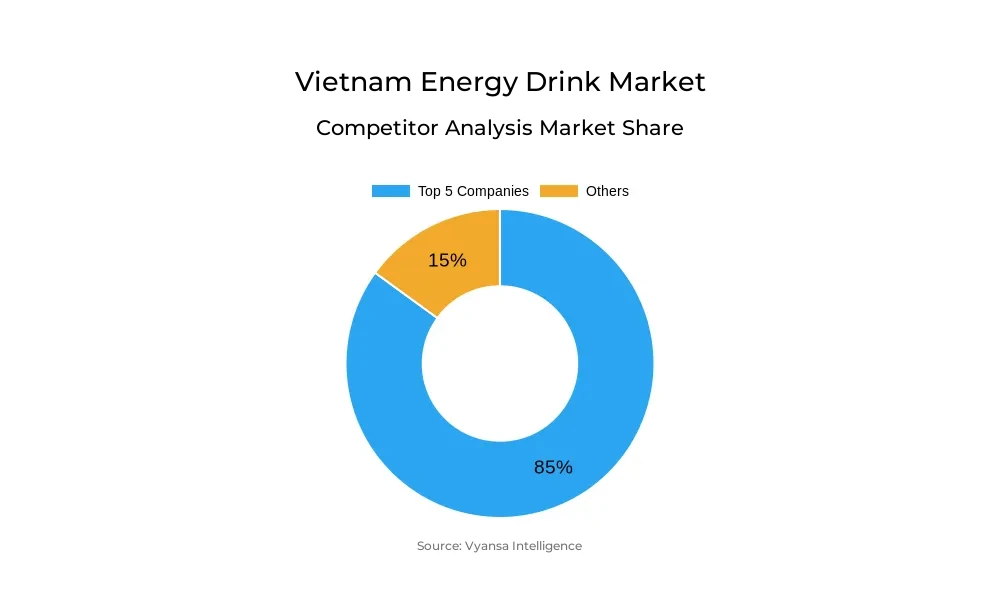
- More than 10 companies are actively engaged in producing Energy Drink in Vietnam.
- Top 5 companies acquired 85% of the market share.
- A&B Foods & Beverage Co Ltd, Masan Group Corp, Taisho Vietnam Co Ltd, Red Bull (Vietnam) Co Ltd, Tan Hiep Phat Group etc., are few of the top companies.
- Sales Channel
- Off-Trade grabbed 65% of the market.
Vietnam Energy Drink Market Outlook
Vietnam energy drinks market is expected to maintain its growth trend between 2025 and 2030 due to hectic lifestyles and growing demand among young consumers. Additional stress from studies and work is pushing more individuals, particularly youth, towards quick injections of energy. Economically challenging times notwithstanding, this increased demand is also supporting sales in both off-trade and on-trade channels. With the maturation of the market in metro locations, industry leaders will likely focus on distribution expansion in rural and suburban markets.
The market is getting more competitive with new brands emerging and introducing nationwide campaigns. Thums Up Charged, for example, grew fast post-launch, and other players are likely to adopt similar tactics. Rising health awareness, however, is impacting consumer choice, and therefore there is a slowing in demand for normal sugary energy drinks. Reduced sugar and zero sugar variants are gaining popularity instead, presenting both existing and new brands opportunities for growth.
Dynamic campaign marketing is still a central vehicle for brand interaction. Red Bull's Húc Fest 2024 and Number 1's cash prize campaign are just a couple of ways that brands are reaching out to consumers through enjoyment and reward. Furthermore, partnerships with influential personalities and appearances at gaming events will become increasingly significant, particularly in bringing in the younger crowd.
Product innovation will be key to maintaining the dynamism of the market. Brands are looking to new ingredients and flavors to satisfy changing consumer tastes. Lipovitan Tongkat Ali, for example, blending classic energy drink nutrients with herbal extracts, illustrates how innovation can attract health-aware consumers. The trend will continue to 2030, shaping Vietnam's energy drinks market of the future.
Vietnam Energy Drink Market Growth Driver
The building pressure of contemporary living is anticipated to continue to propel demand for energy drinks in Vietnam over 2025-30. Off-trade and on-trade channels, in 2024, experienced robust growth in terms of volume and value. This performance is expected to carry over, boosted by increasingly frenetic lifestyles, like working extended hours or achieving tighter performance standards, that urge customers to look for instant energy-giving solutions.
In the face of increasing economic pressures, most people have begun to reduce overall expenditure. Energy drinks are a notable exception, however, particularly among young buyers. The prevalence of tight deadlines and high expectations has fostered greater dependence on these drinks for sustaining energy and concentration. Accordingly, energy drinks are likely to continue enjoying popularity among Vietnam's youth and promoting further market success in the future.
Vietnam Energy Drink Market Opportunity
In the next few years, health-conscious behavior will increase among Vietnamese consumers, particularly sugar consumption. High sugar intake has been associated with ailments such as diabetes, obesity, and tooth decay. Consequently, energy drinks that are sugar-free or low in sugar, including Monster Zero Ultra and BCAA Zero, are becoming increasingly popular. This trend will continue to prompt brands to create healthier products to address increasing demand.
In addition, competitors are concentrating on product innovation in order to drive sales and gain new consumers. The best example is Lipovitan Tongkat Ali, released in 2024 by Taisho Vietnam Co Ltd. The beverage integrates the classic advantages of Lipovitan, including rich vitamin B1 content, with Tongkat Ali extract—becoming the first energy drink in Vietnam to carry this component. Products such as these are likely to maintain the growth of the market during 2025-30.
Unlock Market Intelligence
Explore the market potential with our data-driven report
| Report Coverage | Details |
|---|---|
| Market Forecast | 2025-30 |
| USD Value 2024 | $ 1.27 Billion |
| USD Value 2030 | $ 1.62 Billion |
| CAGR 2025-2030 | 4.14% |
| Largest Category | Non Alcoholic Energy Drinks segment leads with 95% market share |
| Top Drivers | Rising Pressure of Modern Life Fueling Market Demand |
| Top Opportunities | Rising Product Innovation Driving Consumer Interest Fueling The Market |
| Key Players | A&B Foods & Beverage Co Ltd, Masan Group Corp, Taisho Vietnam Co Ltd, Red Bull (Vietnam) Co Ltd, Tan Hiep Phat Group, Suntory PepsiCo Vietnam Beverage Co Ltd, AJE Group, Universal Robina Corporation, The Coca-Cola Company, Osotspa Public Company Limited and Others. |
Unlock Market Intelligence
Explore the market potential with our data-driven report
Top Companies in Vietnam Energy Drink Market

The top companies operating in the market include A&B Foods & Beverage Co Ltd, Masan Group Corp, Taisho Vietnam Co Ltd, Red Bull (Vietnam) Co Ltd, Tan Hiep Phat Group, Suntory PepsiCo Vietnam Beverage Co Ltd, AJE Group, Universal Robina Corporation, The Coca-Cola Company, Osotspa Public Company Limited, etc., are the top players operating in the Vietnam Energy Drink Market.
Frequently Asked Questions
Related Report
1. Market Segmentation
1.1. Research Scope
1.2. Research Methodology
1.3. Definitions and Assumptions
2. Executive Summary
3. Vietnam Energy Drinks Market Policies, Regulations, and Standards
4. Vietnam Energy Drinks Market Dynamics
4.1. Growth Factors
4.2. Challenges
4.3. Trends
4.4. Opportunities
5. Vietnam Energy Drinks Market Statistics, 2020-2030F
5.1. Market Size & Growth Outlook
5.1.1.By Revenues in US$ Million
5.1.2.By Quantity Sold (Million Liters)
5.2. Market Segmentation & Growth Outlook
5.2.1.By Product Type
5.2.1.1. Alcoholic- Market Insights and Forecast 2020-2030, USD Million
5.2.1.2. Non-Alcoholic- Market Insights and Forecast 2020-2030, USD Million
5.2.2.By Consumption
5.2.2.1. Drinks- Market Insights and Forecast 2020-2030, USD Million
5.2.2.2. Shots- Market Insights and Forecast 2020-2030, USD Million
5.2.2.3. Mixers- Market Insights and Forecast 2020-2030, USD Million
5.2.3.By Nature
5.2.3.1. Conventional- Market Insights and Forecast 2020-2030, USD Million
5.2.3.2. Natural/Organic- Market Insights and Forecast 2020-2030, USD Million
5.2.4.By Flavour
5.2.4.1. Flavoured- Market Insights and Forecast 2020-2030, USD Million
5.2.4.2. Unflavoured- Market Insights and Forecast 2020-2030, USD Million
5.2.5.By Packaging
5.2.5.1. Bottles- Market Insights and Forecast 2020-2030, USD Million
5.2.5.1.1. PET Bottles- Market Insights and Forecast 2020-2030, USD Million
5.2.5.1.2. Glass Bottles- Market Insights and Forecast 2020-2030, USD Million
5.2.5.2. Metal Cans- Market Insights and Forecast 2020-2030, USD Million
5.2.5.3. Pouches- Market Insights and Forecast 2020-2030, USD Million
5.2.5.4. Others- Market Insights and Forecast 2020-2030, USD Million
5.2.6.By Packaging Size
5.2.6.1. Small- Market Insights and Forecast 2020-2030, USD Million
5.2.6.2. Medium- Market Insights and Forecast 2020-2030, USD Million
5.2.6.3. Large- Market Insights and Forecast 2020-2030, USD Million
5.2.7.By End User
5.2.7.1. Teenagers- Market Insights and Forecast 2020-2030, USD Million
5.2.7.2. Adults- Market Insights and Forecast 2020-2030, USD Million
5.2.7.3. Geriatric- Market Insights and Forecast 2020-2030, USD Million
5.2.8.By Sales Channel
5.2.8.1. On-Trade- Market Insights and Forecast 2020-2030, USD Million
5.2.8.2. Off-Trade- Market Insights and Forecast 2020-2030, USD Million
5.2.9.By Competitors
5.2.9.1. Competition Characteristics
5.2.9.2. Market Share & Analysis
6. Vietnam Alcoholic Energy Drinks Market Outlook, 2020-2030F
6.1. Market Size & Growth Outlook
6.1.1.By Revenues in US$ Million
6.1.2.By Quantity Sold (Million Liters)
6.2. Market Segmentation & Growth Outlook
6.2.1.By Consumption- Market Insights and Forecast 2020-2030, USD Million
6.2.2.By Nature- Market Insights and Forecast 2020-2030, USD Million
6.2.3.By Flavour- Market Insights and Forecast 2020-2030, USD Million
6.2.4.By Packaging- Market Insights and Forecast 2020-2030, USD Million
6.2.5.By Packaging Size- Market Insights and Forecast 2020-2030, USD Million
6.2.6.By End Users- Market Insights and Forecast 2020-2030, USD Million
6.2.7.By Sales Channel- Market Insights and Forecast 2020-2030, USD Million
7. Vietnam Non-Alcoholic Energy Drinks Market Outlook, 2020-2030F
7.1. Market Size & Growth Outlook
7.1.1.By Revenues in US$ Million
7.1.2.By Quantity Sold (Million Liters)
7.2. Market Segmentation & Growth Outlook
7.2.1.By Consumption- Market Insights and Forecast 2020-2030, USD Million
7.2.2.By Nature- Market Insights and Forecast 2020-2030, USD Million
7.2.3.By Flavour- Market Insights and Forecast 2020-2030, USD Million
7.2.4.By Packaging- Market Insights and Forecast 2020-2030, USD Million
7.2.5.By Packaging Size- Market Insights and Forecast 2020-2030, USD Million
7.2.6.By End Users- Market Insights and Forecast 2020-2030, USD Million
7.2.7.By Sales Channel- Market Insights and Forecast 2020-2030, USD Million
8. Competitive Outlook
8.1. Company Profiles
8.1.1.Red Bull (Vietnam) Co Ltd
8.1.1.1. Business Description
8.1.1.2. Product Portfolio
8.1.1.3. Collaborations & Alliances
8.1.1.4. Recent Developments
8.1.1.5. Financial Details
8.1.1.6. Others
8.1.2.Tan Hiep Phat Group
8.1.2.1. Business Description
8.1.2.2. Product Portfolio
8.1.2.3. Collaborations & Alliances
8.1.2.4. Recent Developments
8.1.2.5. Financial Details
8.1.2.6. Others
8.1.3.Suntory PepsiCo Vietnam Beverage Co Ltd
8.1.3.1. Business Description
8.1.3.2. Product Portfolio
8.1.3.3. Collaborations & Alliances
8.1.3.4. Recent Developments
8.1.3.5. Financial Details
8.1.3.6. Others
8.1.4.A&B Foods & Beverage Co Ltd
8.1.4.1. Business Description
8.1.4.2. Product Portfolio
8.1.4.3. Collaborations & Alliances
8.1.4.4. Recent Developments
8.1.4.5. Financial Details
8.1.4.6. Others
8.1.5.Masan Group Corp
8.1.5.1. Business Description
8.1.5.2. Product Portfolio
8.1.5.3. Collaborations & Alliances
8.1.5.4. Recent Developments
8.1.5.5. Financial Details
8.1.5.6. Others
8.1.6.Taisho Vietnam Co Ltd
8.1.6.1. Business Description
8.1.6.2. Product Portfolio
8.1.6.3. Collaborations & Alliances
8.1.6.4. Recent Developments
8.1.6.5. Financial Details
8.1.6.6. Others
8.1.7.AJE Group
8.1.7.1. Business Description
8.1.7.2. Product Portfolio
8.1.7.3. Collaborations & Alliances
8.1.7.4. Recent Developments
8.1.7.5. Financial Details
8.1.7.6. Others
8.1.8.Universal Robina Corporation
8.1.8.1. Business Description
8.1.8.2. Product Portfolio
8.1.8.3. Collaborations & Alliances
8.1.8.4. Recent Developments
8.1.8.5. Financial Details
8.1.8.6. Others
8.1.9.The Coca-Cola Company
8.1.9.1. Business Description
8.1.9.2. Product Portfolio
8.1.9.3. Collaborations & Alliances
8.1.9.4. Recent Developments
8.1.9.5. Financial Details
8.1.9.6. Others
8.1.10. Osotspa Public Company Limited
8.1.10.1. Business Description
8.1.10.2. Product Portfolio
8.1.10.3. Collaborations & Alliances
8.1.10.4. Recent Developments
8.1.10.5. Financial Details
8.1.10.6. Others
9. Disclaimer
| Segment | Sub-Segment |
|---|---|
| By Product Type |
|
| By Consumption |
|
| By Nature |
|
| By Flavour |
|
| By Packaging |
|
| By Packaging Size |
|
| By End User |
|
| By Sales Channel |
|
Research Methodology
This study followed a structured approach comprising four key phases to assess the size and scope of the electro-oxidation market. The process began with thorough secondary research to collect data on the target market, related markets, and broader industry context. These findings, along with preliminary assumptions and estimates, were then validated through extensive primary research involving industry experts from across the value chain. To calculate the overall market size, both top-down and bottom-up methodologies were employed. Finally, market segmentation and data triangulation techniques were applied to refine and validate segment-level estimations.
Secondary Research
The secondary research phase involved gathering data from a wide range of credible and published sources. This step helped in identifying industry trends, defining market segmentation, and understanding the market landscape and value chain.
Sources consulted during this phase included:
- Company annual reports, investor presentations, and press releases
- Industry white papers and certified publications
- Trade directories and market-recognized databases
- Articles from authoritative authors and reputable journals
- Gold and silver standard websites
Secondary research was critical in mapping out the industry's value chain and monetary flow, identifying key market segments, understanding regional variations, and tracking significant industry developments.
Other key sources:
- Financial disclosures
- Industry associations and trade bodies
- News outlets and business magazines
- Academic journals and research studies
- Paid industry databases
Primary Research
To validate secondary data and gain deeper market insights, primary research was conducted with key stakeholders across both the supply and demand sides of the market.
On the demand side, participants included decision-makers and influencers from end-user industries—such as CIOs, CTOs, and CSOs—who provided first-hand perspectives on market needs, product usage, and future expectations.
On the supply side, interviews were conducted with manufacturers, industry associations, and institutional participants to gather insights into current offerings, product pipelines, and market challenges.
Primary interviews provided critical inputs such as:
- Market size and revenue data
- Product and service breakdowns
- Market forecasts
- Regional and application-specific trends
Stakeholders consulted included:
- Leading OEM and solution providers
- Channel and distribution partners
- End users across various applications
- Independent consultants and industry specialists
Market Size Estimation and Data Triangulation
- Identifying Key Market Participants (Secondary Research)
- Goal: To identify the major players or companies in the target market. This typically involves using publicly available data sources such as industry reports, market research publications, and financial statements of companies.
- Tools: Reports from firms like Gartner, Forrester, Euromonitor, Statista, IBISWorld, and others. Public financial statements, news articles, and press releases from top market players.
- Extracting Earnings of Key Market Participants
- Goal: To estimate the earnings generated from the product or service being analyzed. This step helps in understanding the revenue potential of each market player in a specific geography.
- Methods: Earnings data can be gathered from:
- Publicly available financial reports (for listed companies).
- Interviews and primary data sources from professionals, such as Directors, VPs, SVPs, etc. This is especially useful for understanding more nuanced, internal data that isn't publicly disclosed.
- Annual reports and investor presentations of key players.
- Data Collation and Development of a Relevant Data Model
- Goal: To collate inputs from both primary and secondary sources into a structured, data-driven model for market estimation. This model will incorporate key market KPIs and any independent variables relevant to the market.
- Key KPIs: These could include:
- Market size, growth rate, and demand drivers.
- Industry-specific metrics like market share, average revenue per customer (ARPC), or average deal size.
- External variables, such as economic growth rates, inflation rates, or commodity prices, that could affect the market.
- Data Modeling: Based on this data, the market forecasts are developed for the next 5 years. A combination of trend analysis, scenario modeling, and statistical regression might be used to generate projections.
- Scenario Analysis
- Goal: To test different assumptions and validate how sensitive the market is to changes in key variables (e.g., market demand, regulatory changes, technological disruptions).
- Types of Scenarios:
- Base Case: Based on current assumptions and historical data.
- Best-Case Scenario: Assuming favorable market conditions, regulatory environments, and technological advancements.
- Worst-Case Scenario: Accounting for adverse factors, such as economic downturns, stricter regulations, or unexpected disruptions.


