US Beer Market Report: Trends, Growth and Forecast (2026-2032)
Product Type (Dark Beer (Ale, Sorghum Beer, Weissbier/Weizen/Wheat Beer), Lager (Flavoured/Mixed Lager, Standard Lager (Premium Lager (Domestic Premium Lager, Imported Premium Lager), Mid-Priced Lager (Domestic Mid-Priced Lager, Imported Mid-Priced Lager), Economy Lager (Domestic Economy Lager, Imported Economy Lager))), Non/Low Alcohol Beer (Low Alcohol Beer, Non Alcoholic Beer), Stout, Others (Porter, Malt etc.)), Production (Macro Brewery, Micro Brewery, Craft Brewery), Packaging Type (Bottles, Cans, Others), Sales Channel (On-Trade, Off-Trade) ... Read more
|
Major Players
|
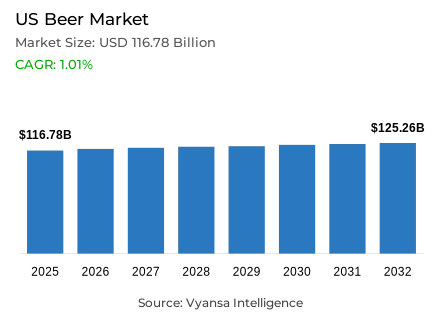
US Beer Market Statistics and Insights, 2026
- Market Size Statistics
- Beer in US is estimated at USD 116.78 billion in 2025.
- The market size is expected to grow to USD 125.26 billion by 2032.
- Market to register a cagr of around 1.01% during 2026-32.
- Product Type Shares
- Lager grabbed market share of 75%.
- Competition
- More than 20 companies are actively engaged in producing beer in US.
- Top 5 companies acquired around 60% of the market share.
- BrewDog plc; CKA Holdings Ltd; Sharp's Brewery Ltd; Heineken UK Ltd; Molson Coors Brewing Co (UK) Ltd etc., are few of the top companies.
- Sales Channel
- Off-trade grabbed 52% of the market.
US Beer Market Outlook
The Us Beer Market is USD 116.78 billion in 2025, reaching USD 125.26 billion in 2032, with a CAGR of approximately 1.01% in 2026-2032. The market still must contend with economic pressures, such as high ingredient and packaging costs, which have limited volume sales, while spending on beer remains stable. End users are clearly making a shift towards less but better consumption, with a concentration on premium and imported beers and reducing overall consumption in light of lower disposable incomes.
Lager continues to be the leading category accounting for roughly 75% of total market share. However, the performance within the lager segment is becoming increasingly polarized between economy and premium brands. Although mid-priced lagers are slipping in market presence, premium lager brands are solidifying their dominance. Crown Imports LLC, as wholesaler of Modelo Especial, has gained the upper hand, while Anheuser-Busch InBev and Molson Coors maintain top sales overall utilizing diverse portfolios across price points.
Following a distribution perspective, off-trade channels have a 52% market share through solid distribution in supermarkets and convenience stores. The off-trade market is also heavily regulated in several Alcohol Beverage Control (ABC) states, limiting the availability of alcoholic beverages among mainstream retailers. Retail online is seeing only modest growth, as major delivery platforms Instacart, Uber Eats, etc. have recently caught onto the growth of home consumption following the closure of Drizly.
Moving forward, the non-acloholic and low-alcohol beer categories are predicted to be major growth drivers for the U.S. beer market., Brands that have expanded in this category include Athletic Brewing, AB InBev, and Molson Coors, with proper investment into cutting-edge formulations and on-trade opportunities to attract health-conscious end users. Despite a competitive landscape of cannabinoid beverages in the marketplace, the growth of new flavor experimentation, yeast, and brewing methods, are anticipated to bring moderate growth and renewal to the beer market.

US Beer Market Growth DriverRising Demand for Non/Low-Alcohol Beer Supports Market Growth
The increasing popularity of non-alcoholic and low-alcohol beer offerings bolsters the beer market throughout the US. With health consciousness and moderation emerging as the leading drivers of drinking behavior, end users are gravitating towards beverages that serve a social function, without the negative aspects associated with high alcohol consumption. Major brewers such as AB InBev, Molson Coors and Heineken are broadening their portfolios with flavorful, high-quality non-alcoholic options that they believe will resonate with end users focused on health and wellness.
The social inclination towards moderation supports innovation and helps brewers stay relevant in an evolving lifestyle environment. By developing non-alcoholic beverage options with good taste and character, brands are proving successful in reaching both the traditional beer drinker, and the new end users looking for a balance between drinking enjoyment and wellbeing. The growth of this category in retail and hospitality channels contributes to the resiliency of this market and consistently recovering or increasing value.
US Beer Market ChallengeRising Inflation and Cost Pressures Limit Volume Growth
Economic uncertainty and persistent inflation present significant challenges for the beer market in the Us. Higher prices for raw materials, packaging, and logistics drive up production costs, resulting in elevated retail prices. These prices, along with stagnant wages and reduced household spending, have further eroded beer affordability for many end users, particularly in the mid-price segment.
This dynamic causes end users to reduce discretionary spending altogether, or shift spending down to smaller pack sizes in a budget brand. While premium and imported lagers retain a more loyal base of end users, mainstream and mid-range price points are not achieving volume growth. As affordability remains at the forefront of end users' minds, the overall challenge of the beer market for breweries will continue to be balancing margins and accessibility, while also maintaining brand loyalty of the end users among increasingly price sensitive end users.
Unlock Market Intelligence
Explore the market potential with our data-driven report
US Beer Market TrendMarket Polarisation Between Premium and Value Segments
In Us beer market, there is a definite polarisation between the economy and premium segments. While mid-tier lagers have declined in popularity, premium beers such as Modelo and Michelob Ultra have seen continued end users demand, along with value-priced brands, like Busch Light. Both of these trends exemplify how end users are either focusing on price or quality, depending on income level and lifestyle choice.
Premiumisation continues to dictate buying behaviour by many end users who want authenticity, taste and identity within brands. At the same time, budget-conscious end users are purchasing value-driven products, demonstrating a divide between consumption behaviours. These changes in market structure suggest that breweries must purposely identify their products in the minds of end users as premium or affordable, to be competitive in a more segmented market.
US Beer Market OpportunityInnovation in Brewing and Flavour Expansion to Attract New Audiences
Innovation in brewing methods and flavour development will present new opportunities to penetrate different market segments. Breweries will experiment with new hop profiles, yeast strains, and flavour modifications to create unique taste experiences. Innovation and experimentation will especially appeal to younger and health-conscious end users in non/low-alcohol categories who are seeking out greater variety and creativity in their choices.
In addition, brands will invest in product differentiation and small-batch releases as interest grows in craft-style and other experimental beers. By adding elements of authenticity to unique products, brewers appeal to a diverse audience and can create occasions to re-engage end users. The distilling of innovation and sensory experience will change the perception of the beer, with strong opportunity for long-term category growth.
Unlock Market Intelligence
Explore the market potential with our data-driven report
US Beer Market Segmentation Analysis
By Product Type
- Dark Beer
- Lager
- Non/Low Alcohol Beer
- Stout
The segment with highest market share under product type is lager has the largest share of almost 75% in Us beer market, representing the highest segment by a wide margin. Lager principles, large established end users base, broad options of brands, and availability across all price points from economy to premium continues to Lock lager into its respectable position. The significant players in the market like AB InBev, Molson Coors, and Constellation Brands have further entrenched this position by offering a wide range of domestic, imported, and low-alcohol lager options to match the variety of their end-users.
Furthermore, a major driver for the preference of lager is the increased demand for liquor alternatives and new low-, and non-alcohol options—as these end users are exercising a more health-conscious end users decision-making ability. Regular innovation, reformulating to low- or no-alcohol options, and improved delivery within on-trade and off-trade options, ensure that lager remains a strong leader in the US beer market.

By Sales Channel
- On-Trade
- Off-Trade
The segment with highest market share under sales channel is off-trade with almost 52% of the market. The channel's strength relates to the growing trend of at-home consumption alongside competitive pricing, multipack offers, and increases in availability across supermarket chains, forecourt retailers, and specialist retailers. Legislative restrictions on alcohol sales in several states have reinforced off-trade channel dominance, as it is the most accessible point of sale for most end-users.
Also, affordability pressures and changing lifestyle patterns have prompted end-users to choose convenient retail formats and value purchases. Leading retailers are extending beer assortments further, including better quality beers and lower alcohol products, creating further category growth. As the end-user sees affordability and accessibility as a priority, Off-Trade is poised to lead the US Beer Market through the forecast period.
List of Companies Covered in US Beer Market
The companies listed below are highly influential in the US beer market, with a significant market share and a strong impact on industry developments.
- BrewDog plc
- CKA Holdings Ltd
- Sharp's Brewery Ltd
- Heineken UK Ltd
- Molson Coors Brewing Co (UK) Ltd
- Carlsberg Marston's Brewing Co Ltd
- Diageo Plc
- Asahi UK Ltd
- Shepherd Neame Ltd
- Camden Town Brewery Ltd
Frequently Asked Questions
Related Report
1. Market Segmentation
1.1. Research Scope
1.2. Research Methodology
1.3. Definitions and Assumptions
2. Executive Summary
3. US Beer Market Policies, Regulations, and Standards
4. US Beer Market Dynamics
4.1. Growth Factors
4.2. Challenges
4.3. Trends
4.4. Opportunities
5. US Beer Market Statistics, 2022-2032F
5.1. Market Size & Growth Outlook
5.1.1.By Revenues in US$ Million
5.1.2.By Quantity Sold in Million Litres
5.2. Market Segmentation & Growth Outlook
5.2.1.By Product Type
5.2.1.1. Dark Beer- Market Insights and Forecast 2022-2032, USD Million
5.2.1.1.1. Ale- Market Insights and Forecast 2022-2032, USD Million
5.2.1.1.2. Sorghum Beer- Market Insights and Forecast 2022-2032, USD Million
5.2.1.1.3. Weissbier/Weizen/Wheat Beer- Market Insights and Forecast 2022-2032, USD Million
5.2.1.2. Lager- Market Insights and Forecast 2022-2032, USD Million
5.2.1.2.1. Flavoured/Mixed Lager- Market Insights and Forecast 2022-2032, USD Million
5.2.1.2.2. Standard Lager- Market Insights and Forecast 2022-2032, USD Million
5.2.1.2.2.1. Premium Lager- Market Insights and Forecast 2022-2032, USD Million
5.2.1.2.2.1.1. Domestic Premium Lager- Market Insights and Forecast 2022-2032, USD Million
5.2.1.2.2.1.2. Imported Premium Lager- Market Insights and Forecast 2022-2032, USD Million
5.2.1.2.2.2. Mid-Priced Lager- Market Insights and Forecast 2022-2032, USD Million
5.2.1.2.2.2.1. Domestic Mid-Priced Lager- Market Insights and Forecast 2022-2032, USD Million
5.2.1.2.2.2.2. Imported Mid-Priced Lager- Market Insights and Forecast 2022-2032, USD Million
5.2.1.2.2.3. Economy Lager- Market Insights and Forecast 2022-2032, USD Million
5.2.1.2.2.3.1. Domestic Economy Lager- Market Insights and Forecast 2022-2032, USD Million
5.2.1.2.2.3.2. Imported Economy Lager- Market Insights and Forecast 2022-2032, USD Million
5.2.1.3. Non/Low Alcohol Beer- Market Insights and Forecast 2022-2032, USD Million
5.2.1.3.1. Low Alcohol Beer- Market Insights and Forecast 2022-2032, USD Million
5.2.1.3.2. Non Alcoholic Beer- Market Insights and Forecast 2022-2032, USD Million
5.2.1.4. Stout- Market Insights and Forecast 2022-2032, USD Million
5.2.1.5. Others (Porter, Malt etc.) - Market Insights and Forecast 2022-2032, USD Million
5.2.2.By Production
5.2.2.1. Macro Brewery- Market Insights and Forecast 2022-2032, USD Million
5.2.2.2. Micro Brewery- Market Insights and Forecast 2022-2032, USD Million
5.2.2.3. Craft Brewery- Market Insights and Forecast 2022-2032, USD Million
5.2.3.By Packaging Type
5.2.3.1. Bottles- Market Insights and Forecast 2022-2032, USD Million
5.2.3.2. Cans- Market Insights and Forecast 2022-2032, USD Million
5.2.3.3. Others- Market Insights and Forecast 2022-2032, USD Million
5.2.4.By Sales Channel
5.2.4.1. On-Trade- Market Insights and Forecast 2022-2032, USD Million
5.2.4.2. Off-Trade- Market Insights and Forecast 2022-2032, USD Million
5.2.5.By Competitors
5.2.5.1. Competition Characteristics
5.2.5.2. Market Share & Analysis
6. US Dark Beer Market Statistics, 2022-2032F
6.1. Market Size & Growth Outlook
6.1.1.By Revenues in US$ Million
6.1.2.By Quantity Sold in Million Litres
6.2. Market Segmentation & Growth Outlook
6.2.1.By Product Type- Market Insights and Forecast 2022-2032, USD Million
6.2.2.By Production- Market Insights and Forecast 2022-2032, USD Million
6.2.3.By Packaging Type- Market Insights and Forecast 2022-2032, USD Million
6.2.4.By Sales Channel- Market Insights and Forecast 2022-2032, USD Million
7. US Lager Beer Market Statistics, 2022-2032F
7.1. Market Size & Growth Outlook
7.1.1.By Revenues in US$ Million
7.1.2.By Quantity Sold in Million Litres
7.2. Market Segmentation & Growth Outlook
7.2.1.By Product Type- Market Insights and Forecast 2022-2032, USD Million
7.2.2.By Production- Market Insights and Forecast 2022-2032, USD Million
7.2.3.By Packaging Type- Market Insights and Forecast 2022-2032, USD Million
7.2.4.By Sales Channel- Market Insights and Forecast 2022-2032, USD Million
8. US Non/Low Alcohol Beer Market Statistics, 2022-2032F
8.1. Market Size & Growth Outlook
8.1.1.By Revenues in US$ Million
8.1.2.By Quantity Sold in Million Litres
8.2. Market Segmentation & Growth Outlook
8.2.1.By Production- Market Insights and Forecast 2022-2032, USD Million
8.2.2.By Packaging Type- Market Insights and Forecast 2022-2032, USD Million
8.2.3.By Sales Channel- Market Insights and Forecast 2022-2032, USD Million
9. US Stout Beer Market Statistics, 2022-2032F
9.1. Market Size & Growth Outlook
9.1.1.By Revenues in US$ Million
9.1.2.By Quantity Sold in Million Litres
9.2. Market Segmentation & Growth Outlook
9.2.1.By Production- Market Insights and Forecast 2022-2032, USD Million
9.2.2.By Packaging Type- Market Insights and Forecast 2022-2032, USD Million
9.2.3.By Sales Channel- Market Insights and Forecast 2022-2032, USD Million
10. Competitive Outlook
10.1. Company Profiles
10.1.1. Anheuser-Busch InBev NV
10.1.1.1. Business Description
10.1.1.2. Product Portfolio
10.1.1.3. Collaborations & Alliances
10.1.1.4. Recent Developments
10.1.1.5. Financial Details
10.1.1.6. Others
10.1.2. MillerCoors LLC
10.1.2.1. Business Description
10.1.2.2. Product Portfolio
10.1.2.3. Collaborations & Alliances
10.1.2.4. Recent Developments
10.1.2.5. Financial Details
10.1.2.6. Others
10.1.3. Crown Imports LLC
10.1.3.1. Business Description
10.1.3.2. Product Portfolio
10.1.3.3. Collaborations & Alliances
10.1.3.4. Recent Developments
10.1.3.5. Financial Details
10.1.3.6. Others
10.1.4. Heineken USA Inc
10.1.4.1. Business Description
10.1.4.2. Product Portfolio
10.1.4.3. Collaborations & Alliances
10.1.4.4. Recent Developments
10.1.4.5. Financial Details
10.1.4.6. Others
10.1.5. Pabst Brewing Co
10.1.5.1. Business Description
10.1.5.2. Product Portfolio
10.1.5.3. Collaborations & Alliances
10.1.5.4. Recent Developments
10.1.5.5. Financial Details
10.1.5.6. Others
10.1.6. Yuengling Brewery
10.1.6.1. Business Description
10.1.6.2. Product Portfolio
10.1.6.3. Collaborations & Alliances
10.1.6.4. Recent Developments
10.1.6.5. Financial Details
10.1.6.6. Others
10.1.7. New Belgium Brewing Co
10.1.7.1. Business Description
10.1.7.2. Product Portfolio
10.1.7.3. Collaborations & Alliances
10.1.7.4. Recent Developments
10.1.7.5. Financial Details
10.1.7.6. Others
10.1.8. Boston Beer Co Inc, The
10.1.8.1. Business Description
10.1.8.2. Product Portfolio
10.1.8.3. Collaborations & Alliances
10.1.8.4. Recent Developments
10.1.8.5. Financial Details
10.1.8.6. Others
10.1.9. Diageo Beer Co USA
10.1.9.1. Business Description
10.1.9.2. Product Portfolio
10.1.9.3. Collaborations & Alliances
10.1.9.4. Recent Developments
10.1.9.5. Financial Details
10.1.9.6. Others
10.1.10. Sierra Nevada Brewing Co
10.1.10.1.Business Description
10.1.10.2.Product Portfolio
10.1.10.3.Collaborations & Alliances
10.1.10.4.Recent Developments
10.1.10.5.Financial Details
10.1.10.6.Others
11. Disclaimer
| Segment | Sub-Segment |
|---|---|
| By Product Type |
|
| By Production |
|
| By Packaging Type |
|
| By Sales Channel |
|
Research Methodology
This study followed a structured approach comprising four key phases to assess the size and scope of the electro-oxidation market. The process began with thorough secondary research to collect data on the target market, related markets, and broader industry context. These findings, along with preliminary assumptions and estimates, were then validated through extensive primary research involving industry experts from across the value chain. To calculate the overall market size, both top-down and bottom-up methodologies were employed. Finally, market segmentation and data triangulation techniques were applied to refine and validate segment-level estimations.
Secondary Research
The secondary research phase involved gathering data from a wide range of credible and published sources. This step helped in identifying industry trends, defining market segmentation, and understanding the market landscape and value chain.
Sources consulted during this phase included:
- Company annual reports, investor presentations, and press releases
- Industry white papers and certified publications
- Trade directories and market-recognized databases
- Articles from authoritative authors and reputable journals
- Gold and silver standard websites
Secondary research was critical in mapping out the industry's value chain and monetary flow, identifying key market segments, understanding regional variations, and tracking significant industry developments.
Other key sources:
- Financial disclosures
- Industry associations and trade bodies
- News outlets and business magazines
- Academic journals and research studies
- Paid industry databases
Primary Research
To validate secondary data and gain deeper market insights, primary research was conducted with key stakeholders across both the supply and demand sides of the market.
On the demand side, participants included decision-makers and influencers from end-user industries—such as CIOs, CTOs, and CSOs—who provided first-hand perspectives on market needs, product usage, and future expectations.
On the supply side, interviews were conducted with manufacturers, industry associations, and institutional participants to gather insights into current offerings, product pipelines, and market challenges.
Primary interviews provided critical inputs such as:
- Market size and revenue data
- Product and service breakdowns
- Market forecasts
- Regional and application-specific trends
Stakeholders consulted included:
- Leading OEM and solution providers
- Channel and distribution partners
- End users across various applications
- Independent consultants and industry specialists
Market Size Estimation and Data Triangulation
- Identifying Key Market Participants (Secondary Research)
- Goal: To identify the major players or companies in the target market. This typically involves using publicly available data sources such as industry reports, market research publications, and financial statements of companies.
- Tools: Reports from firms like Gartner, Forrester, Euromonitor, Statista, IBISWorld, and others. Public financial statements, news articles, and press releases from top market players.
- Extracting Earnings of Key Market Participants
- Goal: To estimate the earnings generated from the product or service being analyzed. This step helps in understanding the revenue potential of each market player in a specific geography.
- Methods: Earnings data can be gathered from:
- Publicly available financial reports (for listed companies).
- Interviews and primary data sources from professionals, such as Directors, VPs, SVPs, etc. This is especially useful for understanding more nuanced, internal data that isn't publicly disclosed.
- Annual reports and investor presentations of key players.
- Data Collation and Development of a Relevant Data Model
- Goal: To collate inputs from both primary and secondary sources into a structured, data-driven model for market estimation. This model will incorporate key market KPIs and any independent variables relevant to the market.
- Key KPIs: These could include:
- Market size, growth rate, and demand drivers.
- Industry-specific metrics like market share, average revenue per customer (ARPC), or average deal size.
- External variables, such as economic growth rates, inflation rates, or commodity prices, that could affect the market.
- Data Modeling: Based on this data, the market forecasts are developed for the next 5 years. A combination of trend analysis, scenario modeling, and statistical regression might be used to generate projections.
- Scenario Analysis
- Goal: To test different assumptions and validate how sensitive the market is to changes in key variables (e.g., market demand, regulatory changes, technological disruptions).
- Types of Scenarios:
- Base Case: Based on current assumptions and historical data.
- Best-Case Scenario: Assuming favorable market conditions, regulatory environments, and technological advancements.
- Worst-Case Scenario: Accounting for adverse factors, such as economic downturns, stricter regulations, or unexpected disruptions.


