Vietnam Cards and Payments Market Report: Trends, Growth and Forecast (2026-2032)
ByInstrument Type (Cards (Debit Card, Charge Card, ATM Card, Pre-Paid Card, Credit Card, Store Card), Mobile Wallets, Cheques, Others), ByCard Type (Contact Smart Card, Contactless Smart Card, Non-Smart Card), ByType of Payments (B2B, B2C, C2C, C2B (E-commerce Shopping, Payment at POS Terminals)), ByTransaction Type (Domestic, Foreign), ByApplication (Food & Groceries, Health & Pharmacies, Travel & Tourism, Hospitality, Others (Media & Entertainment)) ... Read more
|
Major Players
|
Vietnam Cards and Payments Market Statistics and Insights, 2026
- Market Size Statistics
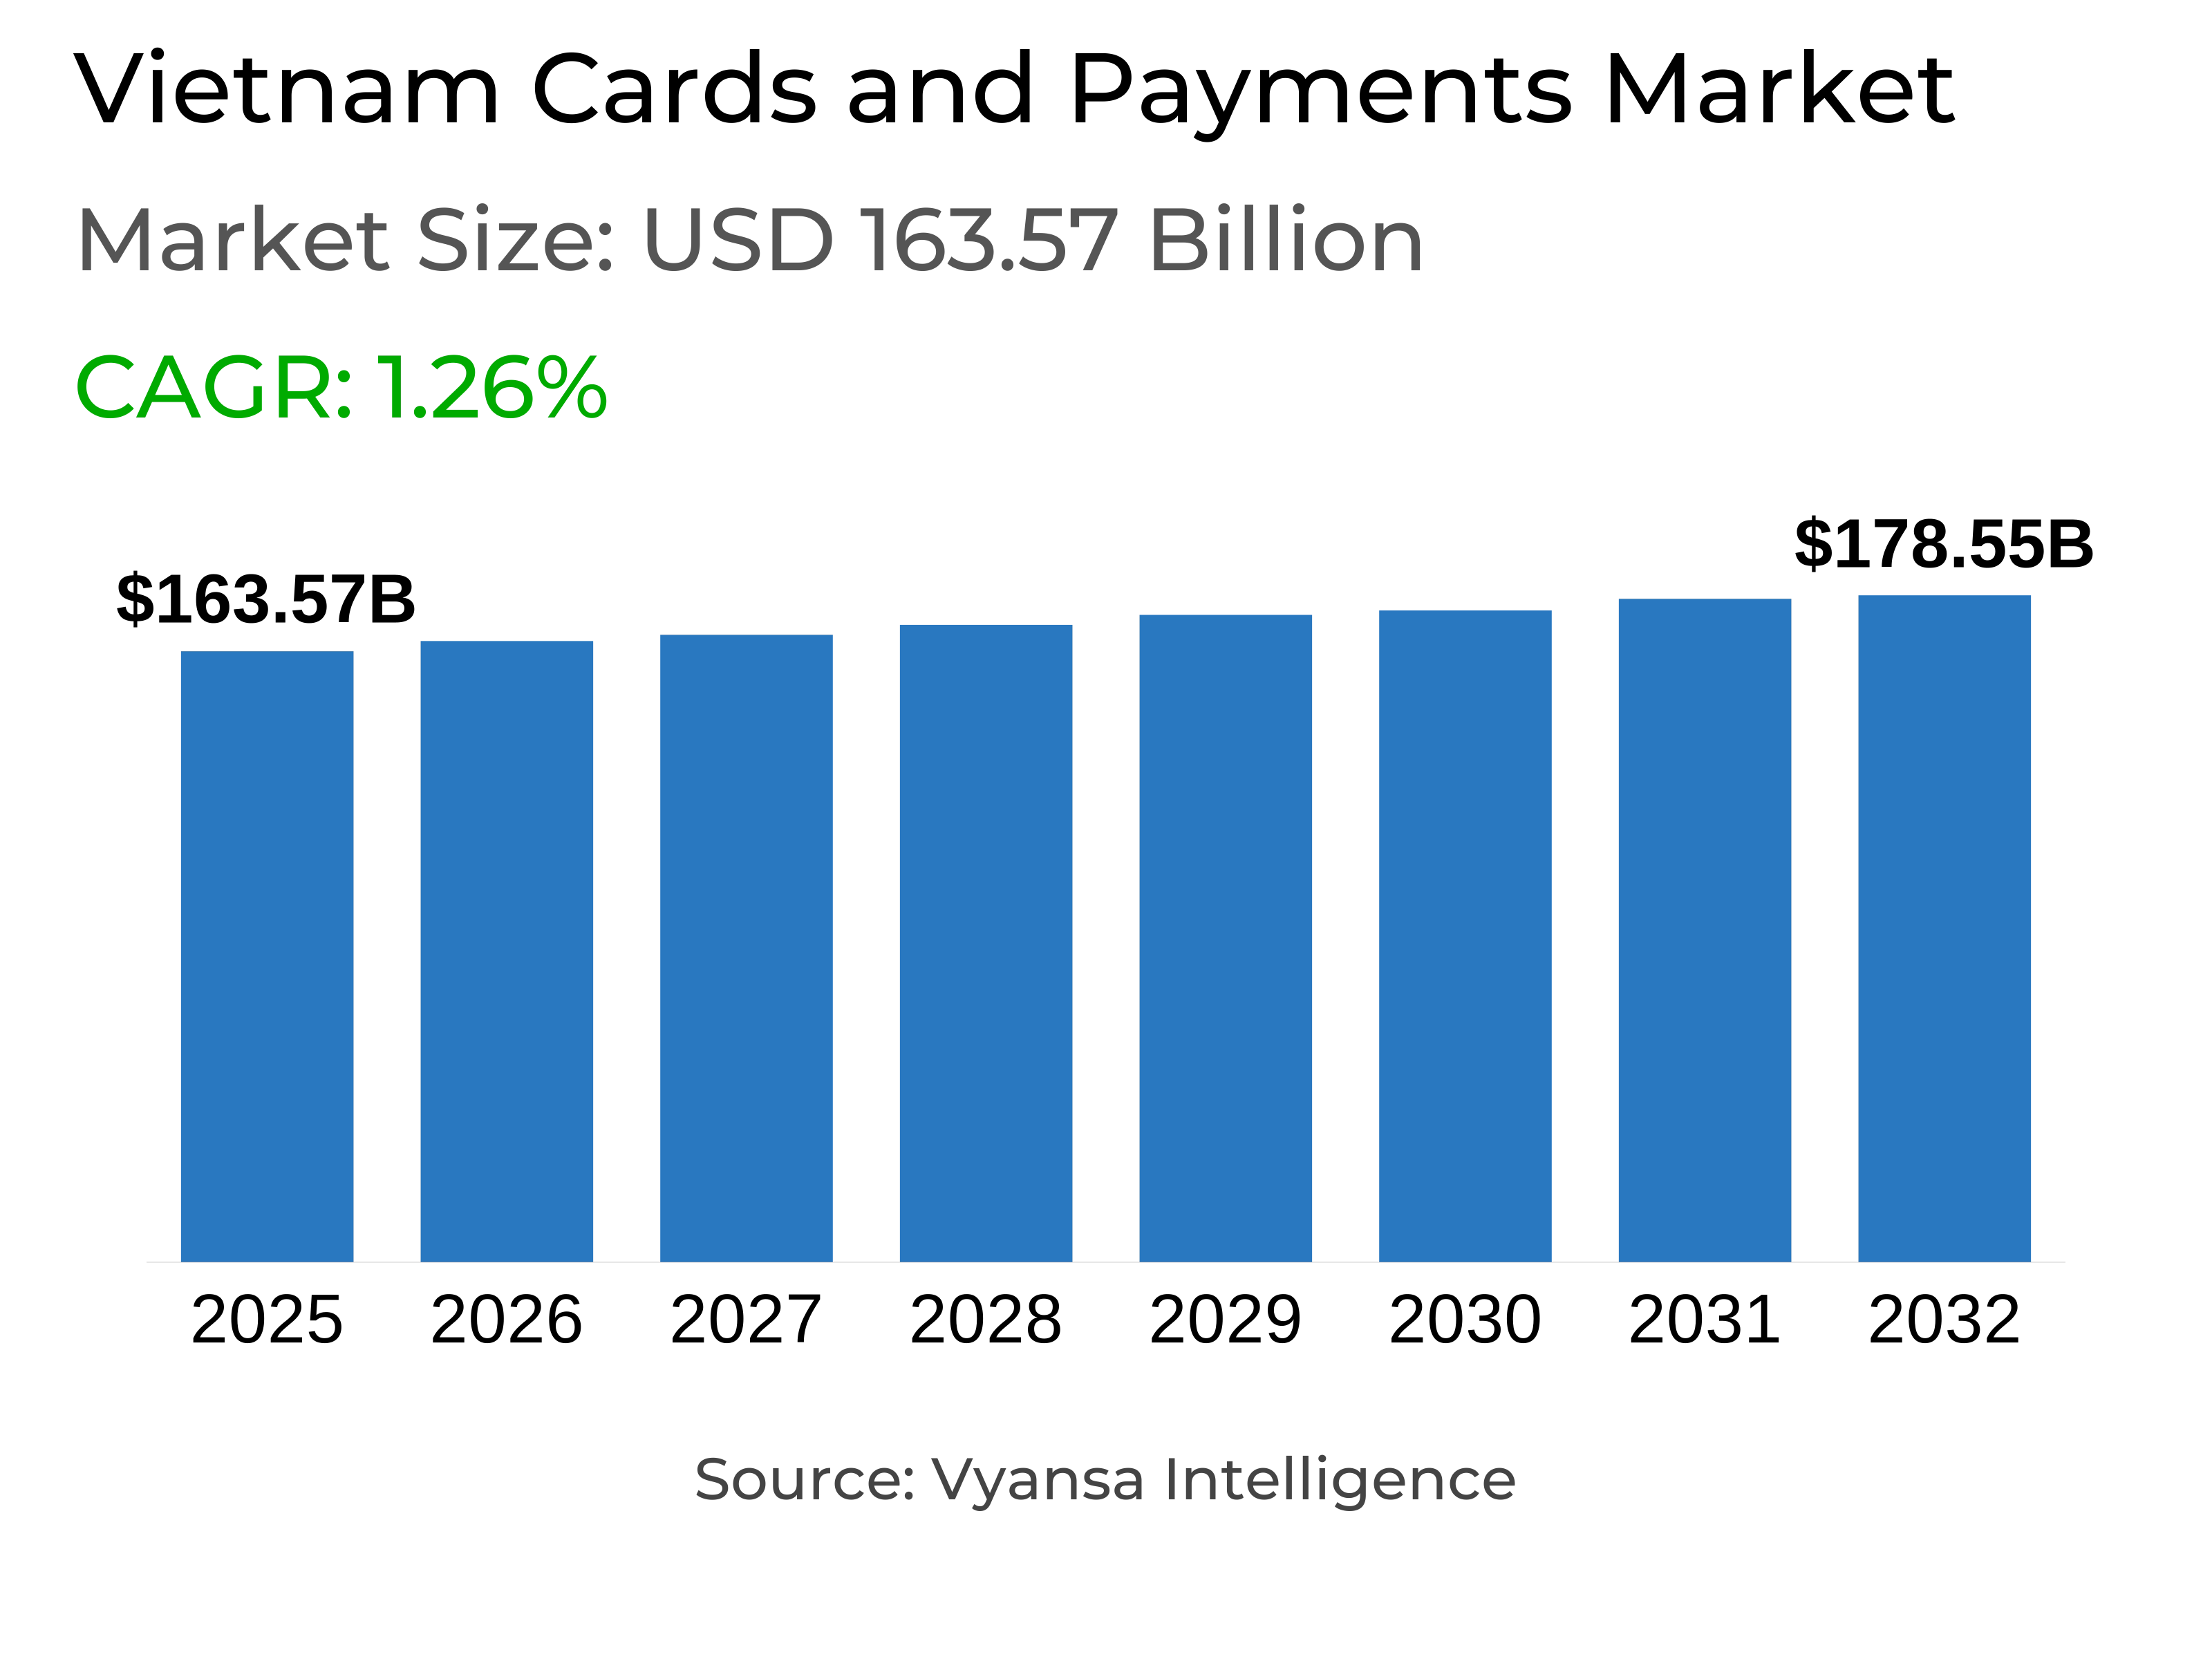
- Cards and Payments in Vietnam is estimated at $ 163.57 Billion.
- The market size is expected to grow to $ 178.55 Billion by 2032.
- Market to register a CAGR of around 1.26% during 2026-32.
- Instrument Type Shares
- Cards grabbed market share of 90%.
- Cards to witness a volume CAGR of around 2.09%.
- Competition
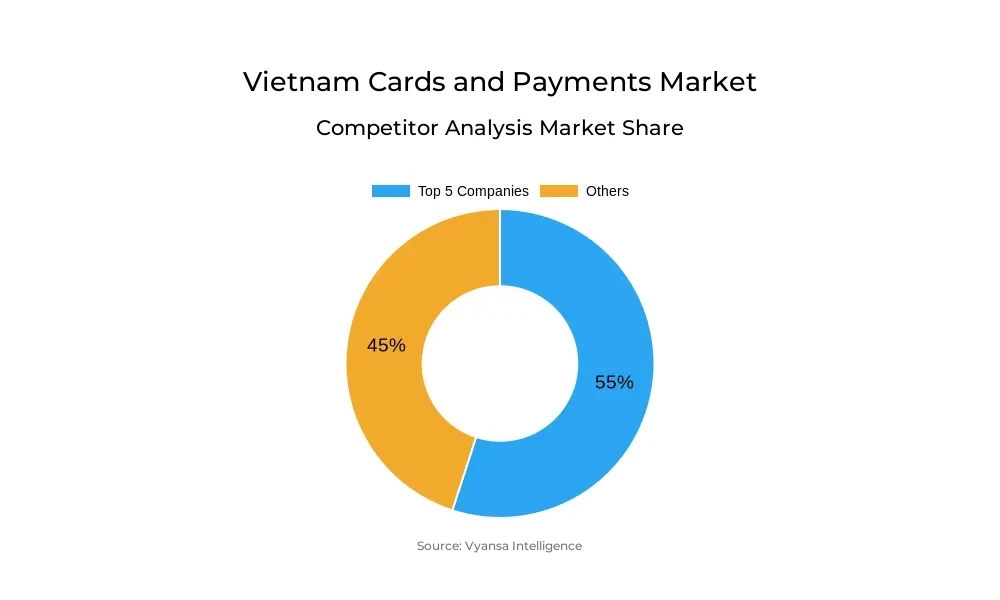
- More than 20 companies are actively engaged in producing Cards and Payments in Vietnam.
- Top 5 companies acquired 55% of the market share.
- Asia Commercial JSB, Bank for Investment & Development of Vietnam (BIDV), Saigon Thuong Tin Commercial JSB, Vietnam Technological & Commercial Bank, JSC Bank for Foreign Trade of Vietnam (Vietcombank) etc., are few of the top companies.
- Card Type
- Contact Smart Card grabbed 55% of the market.
Vietnam Cards and Payments Market Outlook
The Vietnam cards and payments market is poised for stable growth, with the market forecasted at USD 163.57 billion and anticipated to reach USD 178.55 billion by 2032. The expansion occurs on a volume CAGR of approximately 2.09%, owing to the continued uptake of cashless transactions and the government's effort towards promoting financial inclusion. Increasing adoption of the advantages of digital payments, including ease of use, safety, and improved money management, will keep driving card and e-payment adoption.
Credit cards will continue to see robust growth in issue, led by the growth of POS networks and demand from e-commerce. Debit cards, on the other hand, will keep expanding their appeal among new banking patrons, such as young end users and students, who increasingly opt for e-wallets for food delivery, gaming, and subscriptions. Contact smart cards, currently market leaders with a 55% share, will continue to dominate since banks shift away from magnetic cards to enhance security and standardsize.
The regulatory environment established by the government, including Decree No. 52/2024/ND-CP, will control the next growth phase of the market. Biometric verification, transaction limits per day, and safe eKYC processes will enhance security and gain customer confidence in electronic transactions. In contrast, transactions made through QR codes and solutions like VNPAY SoftPOS are likely to penetrate both urban and rural regions more extensively, driving deeper financial inclusion.
Ahead, mobile-based payments, QR transactions, and AI-powered innovations will hasten the digital push in Vietnam's financial market. Although cash is still key in rural areas, the overall move toward cashless systems will characterize the market, positioning Vietnam as a competitor in the regional digital payment economy by 2032.
Vietnam Cards and Payments Market Growth Driver
Regulatory Push Enhancing Security and Efficiency
The government has rolled out several significant regulations that aim to improve security and efficiency in the banking and payments market. They consist of new regulations on cashless payments, 24/7 complaints services for payment problems, and tighter agent and cardholder transaction limits. Possibly the most significant one is the requirement for biometric authentication on higher-value transactions to ensure increased end user safety.
As a counter measure, issuers and operators invest in sophisticated technologies to enhance their products and mobile apps. Electronic Know Your Customer (eKYC) procedures are enhanced with biometric scanning such as facial recognition and fingerprint authentication, while Near-Field Communication (NFC) on smartphones facilitates easy ID card scanning. Although these changes bring initial adjustments for end users, they create long-term benefits such as stronger fraud prevention, faster verification, and an overall safer financial environment, driving greater trust and adoption of digital payments.
Vietnam Cards and Payments Market Trend
Rising Digitalisation in Banking Services
Turkish banks are stepping up their digital banking strategies to enhance customer convenience and reduce complexity. Payment intermediaries and credit institutions are embracing cutting-edge technologies to create better business processes and a general customer experience. Several traditional services like deposits, account management, card issuing, e-wallets, and transfers are now completely digitised through collaborations with partners from various industries. This development is in line with the increased role of digitalisation as a major trend in the payments landscape.
For instance, major banks launch innovations like chip-based ID cards to provide secure identification and contactless cash withdrawal from ATMs without using physical banking cards or mobile phones. Multi-channel corporate client platforms, secure payment hubs, and the implementation of Open API services enhance integration throughout financial systems. Meanwhile, the migration from magnetic to chip cards enhances security and complies with international practices, enhancing customer confidence in digital banking products.
Unlock Market Intelligence
Explore the market potential with our data-driven report
Vietnam Cards and Payments Market Opportunity
Increasing Trend Towards Digital-First Payments
The future of Turkey financial cards is being defined by the growth of mobile-based payment options, particularly with increasing use of QR codes and mobile transactions. With the wider use of smartphones and electronic payment systems, financial cards undergo ongoing change. Physical card use traditionally is slowly giving way to digital payments and e-wallets as they become increasingly convenient. The government and financial institutions are actively encouraging this change, making it easier for end users to adopt digital payment methods.
QR payments have already been implemented in neighboring nations, and within the next few years, local operators are likely to extend their reach to other regions, establishing seamless cross-border payment systems. Parallelly, smartphone payments are becoming more popular because of ease, less likelihood of card loss, and more security measures. Parallel to this, banks are increasingly resorting to artificial intelligence (AI) to enhance customer experience, enhance security, and simplify transactions
Unlock Market Intelligence
Explore the market potential with our data-driven report
Vietnam Cards and Payments Market Segmentation Analysis

By Instrument Type
- Cards
- Mobile Wallets
- Cheques
- Others
The highest market share segment under the Instrument Type is Cards, representing close to 90% of the Vietnam cards and payments market. Cards remain at the heart of financial transactions, with stimuli such as cashback rewards, discounts, and easy record-keeping. Values of debit and credit card transactions have grown steadily, with credit cards dominating new issuances. This growth is principally fueled by the broader POS network throughout Vietnam, facilitating card-based payments to be more accessible.
In the future, cards are anticipated to register a volume CAGR of approximately 2.09%, attributing to continued demand in spite of increasing mobile and QR-based payment preference. As ATM withdrawals are falling, the government initiative to increase financial inclusion and banks' initiative to increase card security with chip technology technologies guarantee that cards continue to be a healthy instrument type over the forecasting period.
By Card Type
- Contact Smart Card
- Contactless Smart Card
- Non-Smart Card
The Contact Smart Card segment had the largest market share under Card Type, taking around 55% of the market. The cards are increasingly popular due to their improved security features and compatibility with electronic payment infrastructure. Banks like Agribank, ACB, and Eximbank switching over from magnetic to chip-based cards have further increased this segment, following international standards and providing end users with safer and more dependable payment solutions.
The superiority of contact smart cards also has to do with the growth of cashless transactions and state-sponsored efforts to digitalize financial operations. end users are able to enjoy the convenience of contactless payments, especially in urban areas where POS machines and QR systems are ubiquitous. This puts contact smart cards at the forefront of their category in the market, making them maintain relevance even as digital wallets and mobile payments become increasingly dominant.
Top Companies in Vietnam Cards and Payments Market
The top companies operating in the market include Asia Commercial JSB, Bank for Investment & Development of Vietnam (BIDV), Saigon Thuong Tin Commercial JSB, Vietnam Technological & Commercial Bank, JSC Bank for Foreign Trade of Vietnam (Vietcombank), Vietnam Prosperity Commercial JCB, Vietnam JSC Bank for Industry & Trade (Vietinbank), Vietnam International Commercial JSB, Tien Phong Commercial JSB, Vietnam Bank for Agriculture & Rural Development (Agribank), etc., are the top players operating in the Vietnam Cards and Payments Market.
Frequently Asked Questions
Related Report
1. Market Segmentation
1.1. Research Scope
1.2. Research Methodology
1.3. Definitions and Assumptions
2. Executive Summary
3. Vietnam Cards and Payments Market Policies, Regulations, and Standards
4. Vietnam Cards and Payments Market Dynamics
4.1. Growth Factors
4.2. Challenges
4.3. Trends
4.4. Opportunities
5. Vietnam Cards and Payments Market Statistics, 2022-2032F
5.1. Market Size & Growth Outlook
5.1.1. By Revenues in US$ Million
5.2. Market Segmentation & Growth Outlook
5.2.1. By Instrument Type
5.2.1.1. Cards- Market Insights and Forecast 2022-2032, USD Million
5.2.1.1.1. Debit Card- Market Insights and Forecast 2022-2032, USD Million
5.2.1.1.2. Charge Card- Market Insights and Forecast 2022-2032, USD Million
5.2.1.1.3. ATM Card- Market Insights and Forecast 2022-2032, USD Million
5.2.1.1.4. Pre-Paid Card- Market Insights and Forecast 2022-2032, USD Million
5.2.1.1.5. Credit Card- Market Insights and Forecast 2022-2032, USD Million
5.2.1.1.6. Store Card- Market Insights and Forecast 2022-2032, USD Million
5.2.1.2. Mobile Wallets- Market Insights and Forecast 2022-2032, USD Million
5.2.1.3. Cheques- Market Insights and Forecast 2022-2032, USD Million
5.2.1.4. Others- Market Insights and Forecast 2022-2032, USD Million
5.2.2. By Card Type
5.2.2.1. Contact Smart Card- Market Insights and Forecast 2022-2032, USD Million
5.2.2.2. Contactless Smart Card- Market Insights and Forecast 2022-2032, USD Million
5.2.2.3. Non-Smart Card- Market Insights and Forecast 2022-2032, USD Million
5.2.3. By Type of Payments
5.2.3.1. B2B- Market Insights and Forecast 2022-2032, USD Million
5.2.3.2. B2C- Market Insights and Forecast 2022-2032, USD Million
5.2.3.3. C2C- Market Insights and Forecast 2022-2032, USD Million
5.2.3.4. C2B- Market Insights and Forecast 2022-2032, USD Million
5.2.3.4.1. E-commerce Shopping- Market Insights and Forecast 2022-2032, USD Million
5.2.3.4.2. Payment at POS Terminals- Market Insights and Forecast 2022-2032, USD Million
5.2.4. By Transaction Type
5.2.4.1. Domestic- Market Insights and Forecast 2022-2032, USD Million
5.2.4.2. Foreign- Market Insights and Forecast 2022-2032, USD Million
5.2.5. By Application
5.2.5.1. Food & Groceries- Market Insights and Forecast 2022-2032, USD Million
5.2.5.2. Health & Pharmacies- Market Insights and Forecast 2022-2032, USD Million
5.2.5.3. Travel & Tourism- Market Insights and Forecast 2022-2032, USD Million
5.2.5.4. Hospitality- Market Insights and Forecast 2022-2032, USD Million
5.2.5.5. Others (Media & Entertainment)- Market Insights and Forecast 2022-2032, USD Million
5.2.6. By Competitors
5.2.6.1. Competition Characteristics
5.2.6.2. Market Share & Analysis
6. Vietnam Cards Market Statistics, 2022-2032F
6.1. Market Size & Growth Outlook
6.1.1. By Revenues in US$ Million
6.2. Market Segmentation & Growth Outlook
6.2.1. By Card Type- Market Insights and Forecast 2022-2032, USD Million
6.2.2. By Type of Payments- Market Insights and Forecast 2022-2032, USD Million
6.2.3. By Transaction Type- Market Insights and Forecast 2022-2032, USD Million
6.2.4. By Application- Market Insights and Forecast 2022-2032, USD Million
7. Vietnam Mobile Wallets Market Statistics, 2022-2032F
7.1. Market Size & Growth Outlook
7.1.1. By Revenues in US$ Million
7.2. Market Segmentation & Growth Outlook
7.2.1. By Type of Payments- Market Insights and Forecast 2022-2032, USD Million
7.2.2. By Transaction Type- Market Insights and Forecast 2022-2032, USD Million
7.2.3. By Application- Market Insights and Forecast 2022-2032, USD Million
8. Vietnam Cheques Market Statistics, 2022-2032F
8.1. Market Size & Growth Outlook
8.1.1. By Revenues in US$ Million
8.2. Market Segmentation & Growth Outlook
8.2.1. By Type of Payments- Market Insights and Forecast 2022-2032, USD Million
8.2.2. By Transaction Type- Market Insights and Forecast 2022-2032, USD Million
8.2.3. By Application- Market Insights and Forecast 2022-2032, USD Million
9. Competitive Outlook
9.1. Company Profiles
9.1.1. Bank for Foreign Trade of Vietnam (Vietcombank)
9.1.1.1. Business Description
9.1.1.2. Product Portfolio
9.1.1.3. Collaborations & Alliances
9.1.1.4. Recent Developments
9.1.1.5. Financial Details
9.1.1.6. Others
9.1.2. Vietnam Prosperity Commercial JCB
9.1.2.1. Business Description
9.1.2.2. Product Portfolio
9.1.2.3. Collaborations & Alliances
9.1.2.4. Recent Developments
9.1.2.5. Financial Details
9.1.2.6. Others
9.1.3. Vietnam Technological & Commercial Bank JSC
9.1.3.1. Business Description
9.1.3.2. Product Portfolio
9.1.3.3. Collaborations & Alliances
9.1.3.4. Recent Developments
9.1.3.5. Financial Details
9.1.3.6. Others
9.1.4. Vietnam JSC Bank for Industry & Trade (Vietinbank)
9.1.4.1. Business Description
9.1.4.2. Product Portfolio
9.1.4.3. Collaborations & Alliances
9.1.4.4. Recent Developments
9.1.4.5. Financial Details
9.1.4.6. Others
9.1.5. Bank for Investment & Development of Vietnam (BIDV)
9.1.5.1. Business Description
9.1.5.2. Product Portfolio
9.1.5.3. Collaborations & Alliances
9.1.5.4. Recent Developments
9.1.5.5. Financial Details
9.1.5.6. Others
9.1.6. Saigon Thuong Tin Commercial JSB
9.1.6.1. Business Description
9.1.6.2. Product Portfolio
9.1.6.3. Collaborations & Alliances
9.1.6.4. Recent Developments
9.1.6.5. Financial Details
9.1.6.6. Others
9.1.7. Asia Commercial JSB
9.1.7.1. Business Description
9.1.7.2. Product Portfolio
9.1.7.3. Collaborations & Alliances
9.1.7.4. Recent Developments
9.1.7.5. Financial Details
9.1.7.6. Others
9.1.8. Vietnam International Commercial JSB
9.1.8.1. Business Description
9.1.8.2. Product Portfolio
9.1.8.3. Collaborations & Alliances
9.1.8.4. Recent Developments
9.1.8.5. Financial Details
9.1.8.6. Others
9.1.9. Vietnam Bank for Agriculture & Rural Development (Agribank)
9.1.9.1. Business Description
9.1.9.2. Product Portfolio
9.1.9.3. Collaborations & Alliances
9.1.9.4. Recent Developments
9.1.9.5. Financial Details
9.1.9.6. Others
9.1.10. Tien Phong Commercial JSB
9.1.10.1. Business Description
9.1.10.2. Product Portfolio
9.1.10.3. Collaborations & Alliances
9.1.10.4. Recent Developments
9.1.10.5. Financial Details
9.1.10.6. Others
10. Disclaimer
| Segment | Sub-Segment |
|---|---|
| By Instrument Type |
|
| By Card Type |
|
| By Type of Payments |
|
| By Transaction Type |
|
| By Application |
|
Research Methodology
This study followed a structured approach comprising four key phases to assess the size and scope of the electro-oxidation market. The process began with thorough secondary research to collect data on the target market, related markets, and broader industry context. These findings, along with preliminary assumptions and estimates, were then validated through extensive primary research involving industry experts from across the value chain. To calculate the overall market size, both top-down and bottom-up methodologies were employed. Finally, market segmentation and data triangulation techniques were applied to refine and validate segment-level estimations.
Secondary Research
The secondary research phase involved gathering data from a wide range of credible and published sources. This step helped in identifying industry trends, defining market segmentation, and understanding the market landscape and value chain.
Sources consulted during this phase included:
- Company annual reports, investor presentations, and press releases
- Industry white papers and certified publications
- Trade directories and market-recognized databases
- Articles from authoritative authors and reputable journals
- Gold and silver standard websites
Secondary research was critical in mapping out the industry's value chain and monetary flow, identifying key market segments, understanding regional variations, and tracking significant industry developments.
Other key sources:
- Financial disclosures
- Industry associations and trade bodies
- News outlets and business magazines
- Academic journals and research studies
- Paid industry databases
Primary Research
To validate secondary data and gain deeper market insights, primary research was conducted with key stakeholders across both the supply and demand sides of the market.
On the demand side, participants included decision-makers and influencers from end-user industries—such as CIOs, CTOs, and CSOs—who provided first-hand perspectives on market needs, product usage, and future expectations.
On the supply side, interviews were conducted with manufacturers, industry associations, and institutional participants to gather insights into current offerings, product pipelines, and market challenges.
Primary interviews provided critical inputs such as:
- Market size and revenue data
- Product and service breakdowns
- Market forecasts
- Regional and application-specific trends
Stakeholders consulted included:
- Leading OEM and solution providers
- Channel and distribution partners
- End users across various applications
- Independent consultants and industry specialists
Market Size Estimation and Data Triangulation
- Identifying Key Market Participants (Secondary Research)
- Goal: To identify the major players or companies in the target market. This typically involves using publicly available data sources such as industry reports, market research publications, and financial statements of companies.
- Tools: Reports from firms like Gartner, Forrester, Euromonitor, Statista, IBISWorld, and others. Public financial statements, news articles, and press releases from top market players.
- Extracting Earnings of Key Market Participants
- Goal: To estimate the earnings generated from the product or service being analyzed. This step helps in understanding the revenue potential of each market player in a specific geography.
- Methods: Earnings data can be gathered from:
- Publicly available financial reports (for listed companies).
- Interviews and primary data sources from professionals, such as Directors, VPs, SVPs, etc. This is especially useful for understanding more nuanced, internal data that isn't publicly disclosed.
- Annual reports and investor presentations of key players.
- Data Collation and Development of a Relevant Data Model
- Goal: To collate inputs from both primary and secondary sources into a structured, data-driven model for market estimation. This model will incorporate key market KPIs and any independent variables relevant to the market.
- Key KPIs: These could include:
- Market size, growth rate, and demand drivers.
- Industry-specific metrics like market share, average revenue per customer (ARPC), or average deal size.
- External variables, such as economic growth rates, inflation rates, or commodity prices, that could affect the market.
- Data Modeling: Based on this data, the market forecasts are developed for the next 5 years. A combination of trend analysis, scenario modeling, and statistical regression might be used to generate projections.
- Scenario Analysis
- Goal: To test different assumptions and validate how sensitive the market is to changes in key variables (e.g., market demand, regulatory changes, technological disruptions).
- Types of Scenarios:
- Base Case: Based on current assumptions and historical data.
- Best-Case Scenario: Assuming favorable market conditions, regulatory environments, and technological advancements.
- Worst-Case Scenario: Accounting for adverse factors, such as economic downturns, stricter regulations, or unexpected disruptions.


