Australia Consumer Lending Market Report: Trends, Growth and Forecast (2026-2032)
By Category (Outstanding Balance, Gross Lending), By Loan Type (Personal Loans, Unsecured Personal Loans, Secured Personal Loans, Auto Loans, Mortgages / Home Loans, Credit Card Loans, Student Loans), By Interest Rate Type (Fixed Interest Rate Loans, Floating / Variable Interest Rate Loans), By Payment Method (Direct Deposit (Salary Transfers, Government Benefits, Tax Refunds), Debit Card, Credit Card, Mobile Wallet / UPI, Cheque), By Borrower Type (Individual Borrowers, Joint Borrowers), By Distribution Channel (Bank Branches, Online / Digital Lending Platforms, Non-Banking Financial Institutions (NBFCs)), By Collateral Type (Secured Loans (Vehicle Collateral, Property Collateral), Unsecured Loans), By Age Group (Youth (up to 24 years), Young Adults (25-34 years), Adults (35-54 years), Pre-Retirement (55-64 years), Seniors (65+ years)) ... Read more
|
Major Players
|
Australia Consumer Lending Market Statistics and Insights, 2026
- Market Size Statistics
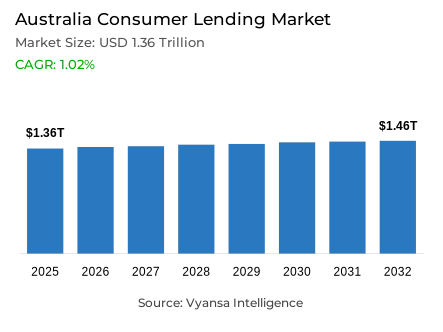
- Consumer lending in Australia outstanding balance is estimated at USD 1.36 trillion and gross lending is estimated at USD 782.94 billion in 2025.
- An outstanding balance market size is expected to grow to USD 1.46 trillion and gross lending USD 839.86 billion by 2032.
- Market to register an outstanding balance cagr of around 1.02% and gross lending cagr of around 1.01% during 2026-32.
- Loan Type Shares
- Personal loans grabbed market share of 65%.
- Competition
- Consumer lending in Australia is currently being catered to by more than 5 companies.
- Top 5 companies acquired the maximum share of the market.
- People’s Choice; National Australia Bank Group; Westpac; Commonwealth Bank of Australia; ANZ Banking Group etc., are few of the top companies.
- Distribution Channel
- Bank branches grabbed 70% of the market.
Australia Consumer Lending Market Outlook
The Australia Consumer Lending Market will continue to progress steadily through 2026-2032, supported by easing inflation, repayment stability, and expectations of interest rate cuts after 2025. In 2025, the market’s outstanding balance is estimated at USD 1.36 trillion, while gross lending stands at USD 782.94 billion. Stable cash rates during 2024 helped households manage repayments more effectively, especially in mortgages and credit cards, which had previously faced pressure from rising rates. By 2032, the outstanding balance is projected to reach USD 1.46 trillion and gross lending USD 839.86 billion, reflecting a moderate CAGR of around 1.01% for both indicators.
Shifts within loan products will shape the market pathway. Mortgages/housing will gradually recover as expected rate cuts in 2025 encourage borrowing and refinancing. Meanwhile, personal loans hold the largest share at 65%, driven by continued demand for flexible financing options. Credit card lending will benefit from stable interest conditions, offering much-needed relief to high-interest borrowers.
Policy actions are also influencing lending behaviour. Student debt reforms—such as increasing the repayment threshold and adopting marginal repayment systems—are expected to support financial stability for young earners, indirectly improving borrowing capacity over the forecast period. Non-major lenders lowering their home loan rates, despite unchanged cash rates, will intensify competition and attract refinancing activity.
Across distribution channels, bank branches hold a dominant 50% share, supported by trust, advisory needs, and strong customer relationships. Overall, with debt levels still high, the outlook suggests steady lending growth while borrowers gradually regain control of their finances, aided by stabilising economic conditions and expected monetary easing.

Australia Consumer Lending Market Growth Driver
Stable Cash Rate Supporting Borrowing Activity
The cash rate in Australia remains steady through most of 2024, with the Reserve Bank of Australia keeping it at 4.35%, giving borrowers predictability and protecting them from sudden repayment increases. Early in 2025, the rate reduces to 3.60%, reflecting easing inflation and changing economic conditions. This stability supports stronger confidence among home and personal borrowers, encouraging borrowing activity throughout the year. The environment helps households maintain their repayment commitments, especially during a period of softer inflation, recorded at 3.4% in Q1 2024.
Credit card users continue to face high rates, with averages between 17.74% and 18.67%, and rewards cards reaching 20.83%. In this context, the absence of additional rate hikes becomes meaningful for borrowers managing expensive credit. With manageable inflation and steady policy settings, repayment risk remains moderate, and lending activity stays healthy across key segments.
Australia Consumer Lending Market Challenge
High Household Debt Levels
Australia household debt remains among the highest in advanced economies, with a debt-to-GDP ratio of about 116.6% in 2023, creating a major structural challenge for lending growth. High existing debt limits the ability of households to take on new loans and increases their sensitivity to any economic shifts. Mortgage holders, in particular, face financial pressure as even minor changes in income or expenses influence their capacity to manage repayments. This restricts the speed at which the lending market can expand.
Lenders respond by strengthening serviceability checks to manage rising repayment burdens. Although some claims about household interest payments reaching specific levels, such as 9.7%, are not publicly confirmed, official updates still show rising pressure. The challenge persists because elevated debt reduces affordability for both new and existing borrowers, making households more vulnerable to shocks and slowing lending momentum.
Unlock Market Intelligence
Explore the market potential with our data-driven report
Australia Consumer Lending Market Trend
Increasing Shift Toward Non-Major Bank Home Loan Providers
Borrowers in Australia increasingly turn toward non-major lenders for home loans, seeking better pricing options and more flexible loan structures. While some unofficial reports indicate these lenders hold up to 38% of new housing loan flows, publicly verified data confirms that non-bank providers capture about 11% of the market in 2024. This shift reflects the appeal of faster rate adjustments offered by non-majors, especially during fluctuating interest conditions. Many borrowers explore these alternatives to secure lower long-term loan costs.
Major banks maintain standard pricing aligned with broader monetary policy, while some non-majors move more quickly, such as reducing fixed rates from 6.14% to 5.74%. This flexibility attracts home buyers and refinancers looking for competitive deals. As this trend continues, the lending landscape becomes more diversified, with growing competition encouraging borrowers to look beyond traditional institutions.
Australia Consumer Lending Market Opportunity
Expected Rate Cuts to Boost Borrowing Capacity
Monetary easing is expected to create significant growth opportunities for Australia’s lending market as inflation approaches the 2–3% target band by late 2025 or 2026, according to the IMF and the Reserve Bank of Australia. With the latest cash rate now at 3.60%, continued reductions will make borrowing more affordable for households, encouraging first-time buyers and refinancers to re-enter the market. Lower repayment burdens will support stronger loan demand across housing and personal credit segments.
As servicing costs fall, households will gain greater flexibility in managing repayments, enabling faster debt reduction and improving borrowing capacity. This improved affordability environment will strengthen loan origination volumes and open space for more active participation from financially constrained borrowers. With inflation moderating and policy easing underway, Australia end users lending sector will experience stronger growth and broader market engagement.
Unlock Market Intelligence
Explore the market potential with our data-driven report
Australia Consumer Lending Market Segmentation Analysis
By Loan Type
- Personal Loans
- Unsecured Personal Loans
- Secured Personal Loans
- Auto Loans
- Mortgages / Home Loans
- Credit Card Loans
- Student Loans
The segment has the highest share around the Loan Type under the end users Lending Market, with Mortgages/Home Loans capturing 65% of the market. This strong position is supported by the large volume of borrowing tied to property purchases, where end users rely heavily on long-term financing. In 2024, the Reserve Bank of Australia kept the cash rate stable, allowing borrowers to manage repayments more comfortably compared to 2023. This stability helped mortgage holders avoid repayment shocks, contributing to consistent demand for home loans.
Although the outstanding balance for mortgages has recently declined, it reflects improved repayment behaviour rather than weaker borrowing interest. Fixed and variable home loans remain attractive as some non-major lenders have reduced rates even without a cash rate cut. With expectations of interest rate reductions in 2025, home loan activity is likely to stay strong as more first-time buyers and existing borrowers explore refinancing opportunities.

By Distribution Channel
- Bank Branches
- Online / Digital Lending Platforms
- Non-Banking Financial Institutions (NBFCs)
The segment with highest market share under distribution channel is bank branches, accounting for around 70% of the australia consumer lending market. Bank branches continue to play a vital role in loan origination, particularly for mortgages, refinancing, and other high-value credit products. End users often prefer in-person interactions for complex lending decisions, as branches provide personalised financial advice, clarity on repayment structures, and reassurance during the approval process. Long-standing relationships with major banks further support the dominance of this channel.
Bank branches are expected to retain their leading position as consumers prioritise financial stability and cautious borrowing. Lending activity through branches is supported by refinancing demand, first-home buyer consultations, and debt management discussions. While digital channels and non-bank lenders are gaining visibility, physical branches remain central to trust-based lending decisions, especially in a regulated environment where end users value transparency, guidance, and direct engagement with financial institutions.
List of Companies Covered in Australia Consumer Lending Market
The companies associated with the Australia consumer lending market are outlined below.
- People’s Choice
- National Australia Bank Group
- Westpac
- Commonwealth Bank of Australia
- ANZ Banking Group
- Credit Union SA
Competitive Landscape
Major Australian banks and non-major lenders shaped a competitive consumer lending landscape in 2025, each responding differently to stable cash rates and changing borrower needs. Non-major lenders such as Credit Union SA and People’s Choice intensified competition by cutting fixed and variable home loan rates despite no movement in the RBA cash rate, attracting both new borrowers and refinancing customers. Major banks including Commonwealth Bank of Australia, ANZ Banking Group, National Australia Bank (NAB), and Westpac remained central players, with some-particularly ANZ and NAB-advocating for lending rule reforms to ease first-home-buyer access. Meanwhile, industry bodies like the Australian Banking Association and regulators such as APRA continued influencing competitive dynamics through their stance on borrower protection and loan accessibility.
Frequently Asked Questions
Related Report
1. Market Segmentation
1.1. Research Scope
1.2. Research Methodology
1.3. Definitions and Assumptions
2. Executive Summary
3. Australia Consumer Lending Market Policies, Regulations, and Standards
4. Australia Consumer Lending Market Dynamics
4.1. Growth Factors
4.2. Challenges
4.3. Trends
4.4. Opportunities
5. Australia Consumer Lending Market Statistics, 2022-2032F
5.1. Market Size & Growth Outlook
5.1.1.By Revenues in USD Million
5.2. Market Segmentation & Growth Outlook
5.2.1.By Category
5.2.1.1. Outstanding Balance- Market Insights and Forecast 2022-2032, USD Million
5.2.1.2. Gross Lending- Market Insights and Forecast 2022-2032, USD Million
5.2.2.By Loan Type
5.2.2.1. Personal Loans- Market Insights and Forecast 2022-2032, USD Million
5.2.2.2. Unsecured Personal Loans- Market Insights and Forecast 2022-2032, USD Million
5.2.2.3. Secured Personal Loans- Market Insights and Forecast 2022-2032, USD Million
5.2.2.4. Auto Loans- Market Insights and Forecast 2022-2032, USD Million
5.2.2.5. Mortgages / Home Loans- Market Insights and Forecast 2022-2032, USD Million
5.2.2.6. Credit Card Loans- Market Insights and Forecast 2022-2032, USD Million
5.2.2.7. Student Loans- Market Insights and Forecast 2022-2032, USD Million
5.2.3.By Interest Rate Type
5.2.3.1. Fixed Interest Rate Loans- Market Insights and Forecast 2022-2032, USD Million
5.2.3.2. Floating / Variable Interest Rate Loans- Market Insights and Forecast 2022-2032, USD Million
5.2.4.By Payment Method
5.2.4.1. Direct Deposit- Market Insights and Forecast 2022-2032, USD Million
5.2.4.1.1. Salary Transfers- Market Insights and Forecast 2022-2032, USD Million
5.2.4.1.2. Government Benefits- Market Insights and Forecast 2022-2032, USD Million
5.2.4.1.3. Tax Refunds- Market Insights and Forecast 2022-2032, USD Million
5.2.4.2. Debit Card- Market Insights and Forecast 2022-2032, USD Million
5.2.4.3. Credit Card- Market Insights and Forecast 2022-2032, USD Million
5.2.4.4. Mobile Wallet / UPI- Market Insights and Forecast 2022-2032, USD Million
5.2.4.5. Cheque- Market Insights and Forecast 2022-2032, USD Million
5.2.5.By Borrower Type
5.2.5.1. Individual Borrowers- Market Insights and Forecast 2022-2032, USD Million
5.2.5.2. Joint Borrowers- Market Insights and Forecast 2022-2032, USD Million
5.2.6.By Distribution Channel
5.2.6.1. Bank Branches- Market Insights and Forecast 2022-2032, USD Million
5.2.6.2. Online / Digital Lending Platforms- Market Insights and Forecast 2022-2032, USD Million
5.2.6.3. Non-Banking Financial Institutions (NBFCs)- Market Insights and Forecast 2022-2032, USD Million
5.2.7.By Collateral Type
5.2.7.1. Secured Loans- Market Insights and Forecast 2022-2032, USD Million
5.2.7.1.1. Vehicle Collateral- Market Insights and Forecast 2022-2032, USD Million
5.2.7.1.2. Property Collateral- Market Insights and Forecast 2022-2032, USD Million
5.2.7.2. Unsecured Loans- Market Insights and Forecast 2022-2032, USD Million
5.2.8.By Age Group
5.2.8.1. Youth (up to 24 years)- Market Insights and Forecast 2022-2032, USD Million
5.2.8.2. Young Adults (25-34 years)- Market Insights and Forecast 2022-2032, USD Million
5.2.8.3. Adults (35-54 years)- Market Insights and Forecast 2022-2032, USD Million
5.2.8.4. Pre-Retirement (55-64 years)- Market Insights and Forecast 2022-2032, USD Million
5.2.8.5. Seniors (65+ years)- Market Insights and Forecast 2022-2032, USD Million
5.2.9.By Competitors
5.2.9.1. Competition Characteristics
5.2.9.2. Market Share & Analysis
6. Australia Outstanding Balance Market Statistics, 2022-2032
6.1. Market Size & Growth Outlook
6.1.1.By Revenues in USD Million
6.2. Market Segmentation & Growth Outlook
6.2.1.By Loan Type- Market Insights and Forecast 2022-2032, USD Million
6.2.2.By Interest Rate Type- Market Insights and Forecast 2022-2032, USD Million
6.2.3.By Payment Method- Market Insights and Forecast 2022-2032, USD Million
6.2.4.By Borrower Type- Market Insights and Forecast 2022-2032, USD Million
6.2.5.By Distribution Channel- Market Insights and Forecast 2022-2032, USD Million
6.2.6.By Collateral Type- Market Insights and Forecast 2022-2032, USD Million
6.2.7.By Age Group- Market Insights and Forecast 2022-2032, USD Million
7. Australia Gross Lending Market Statistics, 2022-2032
7.1. Market Size & Growth Outlook
7.1.1.By Revenues in USD Million
7.2. Market Segmentation & Growth Outlook
7.2.1.By Loan Type- Market Insights and Forecast 2022-2032, USD Million
7.2.2.By Interest Rate Type- Market Insights and Forecast 2022-2032, USD Million
7.2.3.By Payment Method- Market Insights and Forecast 2022-2032, USD Million
7.2.4.By Borrower Type- Market Insights and Forecast 2022-2032, USD Million
7.2.5.By Distribution Channel- Market Insights and Forecast 2022-2032, USD Million
7.2.6.By Collateral Type- Market Insights and Forecast 2022-2032, USD Million
7.2.7.By Age Group- Market Insights and Forecast 2022-2032, USD Million
8. Competitive Outlook
8.1. Company Profiles
8.1.1.Commonwealth Bank of Australia (CBA)
8.1.1.1. Business Description
8.1.1.2. Product Portfolio
8.1.1.3. Collaborations & Alliances
8.1.1.4. Recent Developments
8.1.1.5. Financial Details
8.1.1.6. Others
8.1.2.ANZ Banking Group
8.1.2.1. Business Description
8.1.2.2. Product Portfolio
8.1.2.3. Collaborations & Alliances
8.1.2.4. Recent Developments
8.1.2.5. Financial Details
8.1.2.6. Others
8.1.3.National Australia Bank (NAB)
8.1.3.1. Business Description
8.1.3.2. Product Portfolio
8.1.3.3. Collaborations & Alliances
8.1.3.4. Recent Developments
8.1.3.5. Financial Details
8.1.3.6. Others
8.1.4.Westpac Banking Corp
8.1.4.1. Business Description
8.1.4.2. Product Portfolio
8.1.4.3. Collaborations & Alliances
8.1.4.4. Recent Developments
8.1.4.5. Financial Details
8.1.4.6. Others
8.1.5.HSBC Bank Australia Ltd
8.1.5.1. Business Description
8.1.5.2. Product Portfolio
8.1.5.3. Collaborations & Alliances
8.1.5.4. Recent Developments
8.1.5.5. Financial Details
8.1.5.6. Others
8.1.6.ING Bank (Australia) Ltd
8.1.6.1. Business Description
8.1.6.2. Product Portfolio
8.1.6.3. Collaborations & Alliances
8.1.6.4. Recent Developments
8.1.6.5. Financial Details
8.1.6.6. Others
8.1.7.Heritage Bank Ltd
8.1.7.1. Business Description
8.1.7.2. Product Portfolio
8.1.7.3. Collaborations & Alliances
8.1.7.4. Recent Developments
8.1.7.5. Financial Details
8.1.7.6. Others
8.1.8.Credit Union SA
8.1.8.1. Business Description
8.1.8.2. Product Portfolio
8.1.8.3. Collaborations & Alliances
8.1.8.4. Recent Developments
8.1.8.5. Financial Details
8.1.8.6. Others
8.1.9.People’s Choice
8.1.9.1. Business Description
8.1.9.2. Product Portfolio
8.1.9.3. Collaborations & Alliances
8.1.9.4. Recent Developments
8.1.9.5. Financial Details
8.1.9.6. Others
8.1.10. Diners Club Pty Ltd
8.1.10.1. Business Description
8.1.10.2. Product Portfolio
8.1.10.3. Collaborations & Alliances
8.1.10.4. Recent Developments
8.1.10.5. Financial Details
8.1.10.6. Others
9. Disclaimer
| Segment | Sub-Segment |
|---|---|
| By Category |
|
| By Loan Type |
|
| By Interest Rate Type |
|
| By Payment Method |
|
| By Borrower Type |
|
| By Distribution Channel |
|
| By Collateral Type |
|
| By Age Group |
|
Research Methodology
This study followed a structured approach comprising four key phases to assess the size and scope of the electro-oxidation market. The process began with thorough secondary research to collect data on the target market, related markets, and broader industry context. These findings, along with preliminary assumptions and estimates, were then validated through extensive primary research involving industry experts from across the value chain. To calculate the overall market size, both top-down and bottom-up methodologies were employed. Finally, market segmentation and data triangulation techniques were applied to refine and validate segment-level estimations.
Secondary Research
The secondary research phase involved gathering data from a wide range of credible and published sources. This step helped in identifying industry trends, defining market segmentation, and understanding the market landscape and value chain.
Sources consulted during this phase included:
- Company annual reports, investor presentations, and press releases
- Industry white papers and certified publications
- Trade directories and market-recognized databases
- Articles from authoritative authors and reputable journals
- Gold and silver standard websites
Secondary research was critical in mapping out the industry's value chain and monetary flow, identifying key market segments, understanding regional variations, and tracking significant industry developments.
Other key sources:
- Financial disclosures
- Industry associations and trade bodies
- News outlets and business magazines
- Academic journals and research studies
- Paid industry databases
Primary Research
To validate secondary data and gain deeper market insights, primary research was conducted with key stakeholders across both the supply and demand sides of the market.
On the demand side, participants included decision-makers and influencers from end-user industries—such as CIOs, CTOs, and CSOs—who provided first-hand perspectives on market needs, product usage, and future expectations.
On the supply side, interviews were conducted with manufacturers, industry associations, and institutional participants to gather insights into current offerings, product pipelines, and market challenges.
Primary interviews provided critical inputs such as:
- Market size and revenue data
- Product and service breakdowns
- Market forecasts
- Regional and application-specific trends
Stakeholders consulted included:
- Leading OEM and solution providers
- Channel and distribution partners
- End users across various applications
- Independent consultants and industry specialists
Market Size Estimation and Data Triangulation
- Identifying Key Market Participants (Secondary Research)
- Goal: To identify the major players or companies in the target market. This typically involves using publicly available data sources such as industry reports, market research publications, and financial statements of companies.
- Tools: Reports from firms like Gartner, Forrester, Euromonitor, Statista, IBISWorld, and others. Public financial statements, news articles, and press releases from top market players.
- Extracting Earnings of Key Market Participants
- Goal: To estimate the earnings generated from the product or service being analyzed. This step helps in understanding the revenue potential of each market player in a specific geography.
- Methods: Earnings data can be gathered from:
- Publicly available financial reports (for listed companies).
- Interviews and primary data sources from professionals, such as Directors, VPs, SVPs, etc. This is especially useful for understanding more nuanced, internal data that isn't publicly disclosed.
- Annual reports and investor presentations of key players.
- Data Collation and Development of a Relevant Data Model
- Goal: To collate inputs from both primary and secondary sources into a structured, data-driven model for market estimation. This model will incorporate key market KPIs and any independent variables relevant to the market.
- Key KPIs: These could include:
- Market size, growth rate, and demand drivers.
- Industry-specific metrics like market share, average revenue per customer (ARPC), or average deal size.
- External variables, such as economic growth rates, inflation rates, or commodity prices, that could affect the market.
- Data Modeling: Based on this data, the market forecasts are developed for the next 5 years. A combination of trend analysis, scenario modeling, and statistical regression might be used to generate projections.
- Scenario Analysis
- Goal: To test different assumptions and validate how sensitive the market is to changes in key variables (e.g., market demand, regulatory changes, technological disruptions).
- Types of Scenarios:
- Base Case: Based on current assumptions and historical data.
- Best-Case Scenario: Assuming favorable market conditions, regulatory environments, and technological advancements.
- Worst-Case Scenario: Accounting for adverse factors, such as economic downturns, stricter regulations, or unexpected disruptions.


