Vietnam Beer Market Report: Trends, Growth and Forecast (2026-2032)
By Product Type (Dark Beer (Ale, Sorghum Beer, Weissbier/Weizen/Wheat Beer), Lager (Flavoured/Mixed Lager, Standard Lager (Premium Lager (Domestic Premium Lager, Imported Premium Lager), Mid-Priced Lager (Domestic Mid-Priced Lager, Imported Mid-Priced Lager), Economy Lager (Domestic Economy Lager, Imported Economy Lager))), Non/Low Alcohol Beer (Low Alcohol Beer, Non Alcoholic Beer), Stout, Others (Porter, Malt etc.)), By Production (Macro Brewery, Micro Brewery, Craft Brewery), By Packaging Type (Bottles, Cans, Others), By Sales Channel (On-Trade, Off-Trade) ... Read more
|
Major Players
|
Vietnam Beer Market Statistics and Insights, 2026
- Market Size Statistics
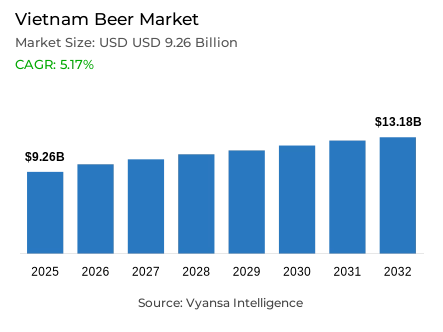
- Beer in Vietnam is estimated at USD 9.26 billion in 2025.
- The market size is expected to grow to USD 13.18 billion by 2032.
- Market to register a cagr of around 5.17% during 2026-32.
- Product Type Shares
- Lager grabbed market share of 95%.
- Competition
- More than 10 companies are actively engaged in producing beer in Vietnam.
- Top 5 companies acquired around 90% of the market share.
- Hanoi Thanh Hoa Beer JSC; San Miguel Brewery Vietnam Ltd; Anheuser-Busch Inbev Vietnam Brewery Co Ltd; Heineken Vietnam Brewery Co Ltd; Saigon Alcohol Beer & Beverages Corp (Sabeco) etc., are few of the top companies.
- Sales Channel
- Off-trade grabbed 52% of the market.
Vietnam Beer Market Outlook
The Vietnam beer market is estimated to be USD 9.26 billion in 2025 and is expected to be USD 13.18 billion in 2032, which is a compound annual growth rate of about 5.17% in 2026–2032. This recovery-based growth perspective is an indication of better macroeconomic conditions, stabilising end user sentiment, and a slow normalisation of socialising and on-trade consumption following a difficult 2024.
During the forecast period, the demand of beer will be boosted due to the improvement of the economic conditions and the restoration of confidence among the end users to spend on discretionary goods. On-trade recovery will be supported by increased domestic travel, the rise in foreign tourists, and an active nightlife culture, whereas brand visibility will be maintained by the further investment in marketing by the major players. At the same time, Vietnam drinkers are likely to resume social drinking events in greater numbers, which will boost the volume of domestic premium and mid-priced lagers.
Innovation of products will remain on the high-end and middle-end beer, with brands striving to enhance taste, packaging, and brand image to satisfy more advanced end user tastes. Non- and low-alcohol beer will become the most vibrant niche, which will be backed by the increased enforcement of the drink-driving laws and the growth of health consciousness. These options allow end users to socialise and adhere to rules and lifestyle preferences.
Structurally, lager controls the market with an estimated 95% market share, which indicates a high level of end user familiarity and affordability across income levels. Off-trade represents about 52% of the sales, which are backed by neighbourhood grocers, supermarkets and hypermarkets, and on-trade will still enjoy the growth of tourism despite the regulatory pressures. In general, the market is likely to grow by 2032 due to the stable economic recovery and diversification of the portfolio.

Vietnam Beer Market Growth Driver
Recovery in tourism and social activity sustaining on-trade consumption
The sustained growth of tourism and social activities in Vietnam serves as a fundamental driver of baseline beer consumption, particularly across hospitality and social environments. The Vietnam National Authority of Tourism reported that in 2023, international tourist arrivals were 12.6 million, which is over three times higher than in 2022, and domestic tourism has been strong. The increased use of restaurants, bars and entertainment places strengthens the demand of beer that is linked to social events, and not daily domestic use.
At the same time, domestic mobility strengthens social drinking opportunities. According to the General Statistics Office of Vietnam, the output of the service-sector grew by 6.8% in 2023, which indicates the growth of the food-service and accommodation industries. This recovery supports beer drinking related to eating and entertainment, despite the overall end user spending being cautious
Vietnam Beer Market Challenge
Regulatory pressure and cost inflation constraining consumption growth
Regulatory restrictions are a long-term structural issue to beer drinking in Vietnam. The World Health Organization confirms that the zero-tolerance policy of drink-driving that has been enforced in Vietnam through Decree 100 is still one of the strictest in the region, and thus still deterring alcohol use outside the home. Despite the observable behavioral adaptation, the regulation still limits the frequency of on-trade drinking.
The industry is also under pressure due to cost. The Ministry of Industry and Trade of Vietnam states that the volatility of global inputs still impacts the costs of malt and packaging in 2024, and new environmental compliance requirements raise the costs of operations. All these pressures limit the flexibility of pricing and burden both the producers and the end-user demand.
Unlock Market Intelligence
Explore the market potential with our data-driven report
Vietnam Beer Market Trend
Shift toward moderation and low-alcohol alternatives
Vietnam drinking patterns are becoming more moderate and health conscious. According to the World Health Organization, in its 2024 update, per-capita alcohol consumption in Vietnam has decreased compared to the situation before the pandemic, and this decrease is facilitated by more stringent regulation and increased awareness of the health risks of alcohol. This change of behaviour affects the patterns of beer consumption, particularly in cities.
At the same time, this trend is strengthened by road-safety enforcement. According to the statistics of the National Traffic Safety Committee in Vietnam, the number of alcohol-related traffic accidents has been decreasing since 2023 to 2024, which is a positive sign of the adherence to the rules of drink-driving. This climate promotes the need to consume low- and non-alcoholic beer products in social events.
Vietnam Beer Market Opportunity
Premiumisation and product innovation supporting value growth
The innovation of products creates opportunities because the end-user preferences are slowly shifting towards quality and differentiation. The Ministry of Finance reports that the average monthly income grew by 6.9% in 2023, which boosts the purchasing power of urban end users. This tendency promotes the desire to experience high quality, although the general consumption is selective.
Parallel to this, branding and packaging innovation gain significance. The Ministry of Culture, Sports and Tourism emphasizes the growing importance of experiential marketing and event-based consumption in urban nightlife and tourism centers. These dynamics favor the prospects of premium and mid-priced beer that are placed on taste differentiation and lifestyle appeal.
Unlock Market Intelligence
Explore the market potential with our data-driven report
Vietnam Beer Market Segmentation Analysis
By Product Type
- Dark Beer
- Ale
- Sorghum Beer
- Weissbier/Weizen/Wheat Beer
- Lager
- Flavoured/Mixed Lager
- Standard Lager
- Premium Lager
- Domestic Premium Lager
- Imported Premium Lager
- Mid-Priced Lager
- Domestic Mid-Priced Lager
- Imported Mid-Priced Lager
- Economy Lager
- Domestic Economy Lager
- Imported Economy Lager
- Premium Lager
- Non/Low Alcohol Beer
- Low Alcohol Beer
- Non Alcoholic Beer
- Stout
- Others (Porter, Malt etc.)
The segment with highest market share under Product Type is Lager, accounting for approximately 95% of the Vietnam beer market value. Lager's dominance is rooted in its broad affordability, widespread availability, and strong cultural acceptance across both urban and rural areas. Domestic mid-priced lager remains particularly popular, as its quality is perceived to be comparable to premium offerings while remaining accessible to a wide end user base.
Over the forecast period, lager is expected to maintain its leadership, supported by continuous brand investment and innovation within premium and mid-priced tiers. Producers are focusing on refining taste profiles, lighter variants, and modern packaging to appeal to younger end users and more health-conscious drinkers. While non- and low-alcohol beer will grow faster from a small base, lager will continue to anchor overall market performance due to its entrenched consumption habits and relevance across on-trade and off-trade occasions.

By Sales Channel
- On-Trade
- Off-Trade
Off-trade channels constitute the dominant segment under sales channel classification, capturing approximately 52% of total beer sales. Off-trade strength is driven by the extensive presence of small local grocers, supermarkets, and hypermarkets across Vietnam, offering stable pricing and convenience for everyday consumption and festive purchases such as Lunar New Year.
During the forecast period, off-trade is expected to remain the primary channel as end users continue to drink more frequently at home, partly influenced by drink-driving regulations and cost considerations. Retail online channels will support incremental growth through promotions and wider digital adoption, but from a relatively small base. While on-trade will benefit from tourism and nightlife recovery, off-trade's accessibility, price transparency, and lower risk of counterfeit products will ensure its continued dominance in the Vietnam beer market.
List of Companies Covered in Vietnam Beer Market
The companies listed below are highly influential in the Vietnam beer market, with a significant market share and a strong impact on industry developments.
- Hanoi Thanh Hoa Beer JSC
- San Miguel Brewery Vietnam Ltd
- Anheuser-Busch Inbev Vietnam Brewery Co Ltd
- Heineken Vietnam Brewery Co Ltd
- Saigon Alcohol Beer & Beverages Corp (Sabeco)
- Carlsberg Vietnam Trading Co Ltd
- Hanoi Alcohol Beer & Beverages Corp (Habeco)
- Sapporo Vietnam Co Ltd
- Dong Xuan Liquor Co Ltd
- Bitburger Braugruppe GmbH
Frequently Asked Questions
Related Report
1. Market Segmentation
1.1. Research Scope
1.2. Research Methodology
1.3. Definitions and Assumptions
2. Executive Summary
3. Vietnam Beer Market Policies, Regulations, and Standards
4. Vietnam Beer Market Dynamics
4.1. Growth Factors
4.2. Challenges
4.3. Trends
4.4. Opportunities
5. Vietnam Beer Market Statistics, 2022-2032F
5.1. Market Size & Growth Outlook
5.1.1.By Revenues in US$ Million
5.1.2.By Quantity Sold in Million Litres
5.2. Market Segmentation & Growth Outlook
5.2.1.By Product Type
5.2.1.1. Dark Beer- Market Insights and Forecast 2022-2032, USD Million
5.2.1.1.1. Ale- Market Insights and Forecast 2022-2032, USD Million
5.2.1.1.2. Sorghum Beer- Market Insights and Forecast 2022-2032, USD Million
5.2.1.1.3. Weissbier/Weizen/Wheat Beer- Market Insights and Forecast 2022-2032, USD Million
5.2.1.2. Lager- Market Insights and Forecast 2022-2032, USD Million
5.2.1.2.1. Flavoured/Mixed Lager- Market Insights and Forecast 2022-2032, USD Million
5.2.1.2.2. Standard Lager- Market Insights and Forecast 2022-2032, USD Million
5.2.1.2.2.1. Premium Lager- Market Insights and Forecast 2022-2032, USD Million
5.2.1.2.2.1.1. Domestic Premium Lager- Market Insights and Forecast 2022-2032, USD Million
5.2.1.2.2.1.2. Imported Premium Lager- Market Insights and Forecast 2022-2032, USD Million
5.2.1.2.2.2. Mid-Priced Lager- Market Insights and Forecast 2022-2032, USD Million
5.2.1.2.2.2.1. Domestic Mid-Priced Lager- Market Insights and Forecast 2022-2032, USD Million
5.2.1.2.2.2.2. Imported Mid-Priced Lager- Market Insights and Forecast 2022-2032, USD Million
5.2.1.2.2.3. Economy Lager- Market Insights and Forecast 2022-2032, USD Million
5.2.1.2.2.3.1. Domestic Economy Lager- Market Insights and Forecast 2022-2032, USD Million
5.2.1.2.2.3.2. Imported Economy Lager- Market Insights and Forecast 2022-2032, USD Million
5.2.1.3. Non/Low Alcohol Beer- Market Insights and Forecast 2022-2032, USD Million
5.2.1.3.1. Low Alcohol Beer- Market Insights and Forecast 2022-2032, USD Million
5.2.1.3.2. Non Alcoholic Beer- Market Insights and Forecast 2022-2032, USD Million
5.2.1.4. Stout- Market Insights and Forecast 2022-2032, USD Million
5.2.1.5. Others (Porter, Malt etc.) - Market Insights and Forecast 2022-2032, USD Million
5.2.2.By Production
5.2.2.1. Macro Brewery- Market Insights and Forecast 2022-2032, USD Million
5.2.2.2. Micro Brewery- Market Insights and Forecast 2022-2032, USD Million
5.2.2.3. Craft Brewery- Market Insights and Forecast 2022-2032, USD Million
5.2.3.By Packaging Type
5.2.3.1. Bottles- Market Insights and Forecast 2022-2032, USD Million
5.2.3.2. Cans- Market Insights and Forecast 2022-2032, USD Million
5.2.3.3. Others- Market Insights and Forecast 2022-2032, USD Million
5.2.4.By Sales Channel
5.2.4.1. On-Trade- Market Insights and Forecast 2022-2032, USD Million
5.2.4.2. Off-Trade- Market Insights and Forecast 2022-2032, USD Million
5.2.5.By Competitors
5.2.5.1. Competition Characteristics
5.2.5.2. Market Share & Analysis
6. Vietnam Dark Beer Market Statistics, 2022-2032F
6.1. Market Size & Growth Outlook
6.1.1.By Revenues in US$ Million
6.1.2.By Quantity Sold in Million Litres
6.2. Market Segmentation & Growth Outlook
6.2.1.By Product Type- Market Insights and Forecast 2022-2032, USD Million
6.2.2.By Production- Market Insights and Forecast 2022-2032, USD Million
6.2.3.By Packaging Type- Market Insights and Forecast 2022-2032, USD Million
6.2.4.By Sales Channel- Market Insights and Forecast 2022-2032, USD Million
7. Vietnam Lager Beer Market Statistics, 2022-2032F
7.1. Market Size & Growth Outlook
7.1.1.By Revenues in US$ Million
7.1.2.By Quantity Sold in Million Litres
7.2. Market Segmentation & Growth Outlook
7.2.1.By Product Type- Market Insights and Forecast 2022-2032, USD Million
7.2.2.By Production- Market Insights and Forecast 2022-2032, USD Million
7.2.3.By Packaging Type- Market Insights and Forecast 2022-2032, USD Million
7.2.4.By Sales Channel- Market Insights and Forecast 2022-2032, USD Million
8. Vietnam Non/Low Alcohol Beer Market Statistics, 2022-2032F
8.1. Market Size & Growth Outlook
8.1.1.By Revenues in US$ Million
8.1.2.By Quantity Sold in Million Litres
8.2. Market Segmentation & Growth Outlook
8.2.1.By Production- Market Insights and Forecast 2022-2032, USD Million
8.2.2.By Packaging Type- Market Insights and Forecast 2022-2032, USD Million
8.2.3.By Sales Channel- Market Insights and Forecast 2022-2032, USD Million
9. Vietnam Stout Beer Market Statistics, 2022-2032F
9.1. Market Size & Growth Outlook
9.1.1.By Revenues in US$ Million
9.1.2.By Quantity Sold in Million Litres
9.2. Market Segmentation & Growth Outlook
9.2.1.By Production- Market Insights and Forecast 2022-2032, USD Million
9.2.2.By Packaging Type- Market Insights and Forecast 2022-2032, USD Million
9.2.3.By Sales Channel- Market Insights and Forecast 2022-2032, USD Million
10. Competitive Outlook
10.1. Company Profiles
10.1.1. Heineken Vietnam Brewery Co Ltd
10.1.1.1. Business Description
10.1.1.2. Product Portfolio
10.1.1.3. Collaborations & Alliances
10.1.1.4. Recent Developments
10.1.1.5. Financial Details
10.1.1.6. Others
10.1.2. Saigon Alcohol Beer & Beverages Corp (Sabeco)
10.1.2.1. Business Description
10.1.2.2. Product Portfolio
10.1.2.3. Collaborations & Alliances
10.1.2.4. Recent Developments
10.1.2.5. Financial Details
10.1.2.6. Others
10.1.3. Carlsberg Vietnam Trading Co Ltd
10.1.3.1. Business Description
10.1.3.2. Product Portfolio
10.1.3.3. Collaborations & Alliances
10.1.3.4. Recent Developments
10.1.3.5. Financial Details
10.1.3.6. Others
10.1.4. Hanoi Alcohol Beer & Beverages Corp (Habeco)
10.1.4.1. Business Description
10.1.4.2. Product Portfolio
10.1.4.3. Collaborations & Alliances
10.1.4.4. Recent Developments
10.1.4.5. Financial Details
10.1.4.6. Others
10.1.5. Sapporo Vietnam Co Ltd
10.1.5.1. Business Description
10.1.5.2. Product Portfolio
10.1.5.3. Collaborations & Alliances
10.1.5.4. Recent Developments
10.1.5.5. Financial Details
10.1.5.6. Others
10.1.6. Hanoi Thanh Hoa Beer JSC
10.1.6.1. Business Description
10.1.6.2. Product Portfolio
10.1.6.3. Collaborations & Alliances
10.1.6.4. Recent Developments
10.1.6.5. Financial Details
10.1.6.6. Others
10.1.7. San Miguel Brewery Vietnam Ltd
10.1.7.1. Business Description
10.1.7.2. Product Portfolio
10.1.7.3. Collaborations & Alliances
10.1.7.4. Recent Developments
10.1.7.5. Financial Details
10.1.7.6. Others
10.1.8. Anheuser-Busch Inbev Vietnam Brewery Co Ltd
10.1.8.1. Business Description
10.1.8.2. Product Portfolio
10.1.8.3. Collaborations & Alliances
10.1.8.4. Recent Developments
10.1.8.5. Financial Details
10.1.8.6. Others
10.1.9. Dong Xuan Liquor Co Ltd
10.1.9.1. Business Description
10.1.9.2. Product Portfolio
10.1.9.3. Collaborations & Alliances
10.1.9.4. Recent Developments
10.1.9.5. Financial Details
10.1.9.6. Others
10.1.10. Bitburger Braugruppe GmbH
10.1.10.1.Business Description
10.1.10.2.Product Portfolio
10.1.10.3.Collaborations & Alliances
10.1.10.4.Recent Developments
10.1.10.5.Financial Details
10.1.10.6.Others
11. Disclaimer
| Segment | Sub-Segment |
|---|---|
| By Product Type |
|
| By Production |
|
| By Packaging Type |
|
| By Sales Channel |
|
Research Methodology
This study followed a structured approach comprising four key phases to assess the size and scope of the electro-oxidation market. The process began with thorough secondary research to collect data on the target market, related markets, and broader industry context. These findings, along with preliminary assumptions and estimates, were then validated through extensive primary research involving industry experts from across the value chain. To calculate the overall market size, both top-down and bottom-up methodologies were employed. Finally, market segmentation and data triangulation techniques were applied to refine and validate segment-level estimations.
Secondary Research
The secondary research phase involved gathering data from a wide range of credible and published sources. This step helped in identifying industry trends, defining market segmentation, and understanding the market landscape and value chain.
Sources consulted during this phase included:
- Company annual reports, investor presentations, and press releases
- Industry white papers and certified publications
- Trade directories and market-recognized databases
- Articles from authoritative authors and reputable journals
- Gold and silver standard websites
Secondary research was critical in mapping out the industry's value chain and monetary flow, identifying key market segments, understanding regional variations, and tracking significant industry developments.
Other key sources:
- Financial disclosures
- Industry associations and trade bodies
- News outlets and business magazines
- Academic journals and research studies
- Paid industry databases
Primary Research
To validate secondary data and gain deeper market insights, primary research was conducted with key stakeholders across both the supply and demand sides of the market.
On the demand side, participants included decision-makers and influencers from end-user industries—such as CIOs, CTOs, and CSOs—who provided first-hand perspectives on market needs, product usage, and future expectations.
On the supply side, interviews were conducted with manufacturers, industry associations, and institutional participants to gather insights into current offerings, product pipelines, and market challenges.
Primary interviews provided critical inputs such as:
- Market size and revenue data
- Product and service breakdowns
- Market forecasts
- Regional and application-specific trends
Stakeholders consulted included:
- Leading OEM and solution providers
- Channel and distribution partners
- End users across various applications
- Independent consultants and industry specialists
Market Size Estimation and Data Triangulation
- Identifying Key Market Participants (Secondary Research)
- Goal: To identify the major players or companies in the target market. This typically involves using publicly available data sources such as industry reports, market research publications, and financial statements of companies.
- Tools: Reports from firms like Gartner, Forrester, Euromonitor, Statista, IBISWorld, and others. Public financial statements, news articles, and press releases from top market players.
- Extracting Earnings of Key Market Participants
- Goal: To estimate the earnings generated from the product or service being analyzed. This step helps in understanding the revenue potential of each market player in a specific geography.
- Methods: Earnings data can be gathered from:
- Publicly available financial reports (for listed companies).
- Interviews and primary data sources from professionals, such as Directors, VPs, SVPs, etc. This is especially useful for understanding more nuanced, internal data that isn't publicly disclosed.
- Annual reports and investor presentations of key players.
- Data Collation and Development of a Relevant Data Model
- Goal: To collate inputs from both primary and secondary sources into a structured, data-driven model for market estimation. This model will incorporate key market KPIs and any independent variables relevant to the market.
- Key KPIs: These could include:
- Market size, growth rate, and demand drivers.
- Industry-specific metrics like market share, average revenue per customer (ARPC), or average deal size.
- External variables, such as economic growth rates, inflation rates, or commodity prices, that could affect the market.
- Data Modeling: Based on this data, the market forecasts are developed for the next 5 years. A combination of trend analysis, scenario modeling, and statistical regression might be used to generate projections.
- Scenario Analysis
- Goal: To test different assumptions and validate how sensitive the market is to changes in key variables (e.g., market demand, regulatory changes, technological disruptions).
- Types of Scenarios:
- Base Case: Based on current assumptions and historical data.
- Best-Case Scenario: Assuming favorable market conditions, regulatory environments, and technological advancements.
- Worst-Case Scenario: Accounting for adverse factors, such as economic downturns, stricter regulations, or unexpected disruptions.


