Netherlands Sports Nutrition Market Report: Trends, Growth and Forecast (2026-2032)
By Product Type (Sports Protein Products (Protein/Energy Bars, Sports Protein Powder, Sports Protein RTD), Sports Non-Protein Products), By Sales Channel (Retail Offline, Retail Online), By Ingredients (Vitamins and Minerals, Proteins and Amino Acids, Carbohydrates, Probiotics, Botanicals/Herbals, Others), By Functionality (Energy, Muscle growth, Hydration, Weight Management, Others), By End User (Bodybuilders, Athletes, Lifestyle Users) ... Read more
|
Major Players
|
Netherlands Sports Nutrition Market Statistics and Insights, 2026
- Market Size Statistics
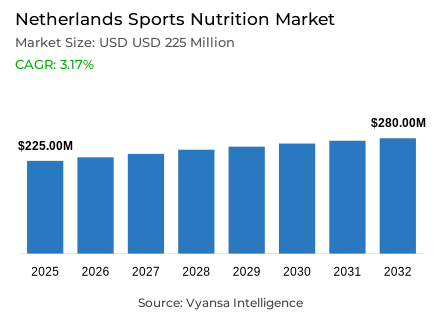
- Sports nutrition in Netherlands is estimated at USD 225 million in 2025.
- The market size is expected to grow to USD 280 million by 2032.
- Market to register a cagr of around 3.17% during 2026-32.
- Product Type Shares
- Sports protein products grabbed market share of 80%.
- Competition
- More than 20 companies are actively engaged in producing sports nutrition in Netherlands.
- Top 5 companies acquired around 55% of the market share.
- Mondelez Nederland BV; Active Nutrition International GmbH; The Hut.com Ltd; Body & Fit Sportsnutrition BV; XXL Group BV etc., are few of the top companies.
- Sales Channel
- Retail offline grabbed 75% of the market.
Netherlands Sports Nutrition Market Outlook
The Netherlands sports nutrition market is valued around USD 225 million in 2025 and is projected to reach USD 280 million by 2032, growing at a CAGR of around 3.17% during 2026–32. This steady expansion reflects the country’s strong sports culture and rising focus on healthy, active lifestyles. Sports nutrition has moved beyond a niche category and is now widely adopted by end users seeking both performance enhancement and overall wellbeing.
Sports nutrition continues to flourish as awareness around nutrition and fitness increases. All major product types are recording healthy growth, supported by wider distribution and continuous product innovation by manufacturers. Dutch end users are increasingly integrating sports nutrition into daily routines, not only for athletic purposes but also as part of a balanced and health-oriented lifestyle.
Protein powder remains the backbone of the market, extending its appeal beyond core sports enthusiasts to a broader end user base. Its association with general health, prevention, and everyday nutrition has strengthened, supported by the wider promotion of protein in packaged foods. Social media influencer campaigns, particularly on platforms such as Instagram and TikTok, have played a major role in engaging younger end users and reinforcing product visibility.
Looking ahead, growth will be sustained by convenience-driven formats such as protein/energy bars and ready-to-drink protein products. While protein powder remains dominant, its relative maturity will allow faster growth in portable, on-the-go formats. Busy lifestyles, combined with continued participation in sports and fitness, will underpin stable market growth through 2032.

Netherlands Sports Nutrition Market Growth Driver
High participation in physical activity sustaining demand for sports nutrition
The Netherlands, high levels of sports and physical activity remain to support the demand of sports nutrition products. Statistics Netherlands (CBS) reported that in 2023, 58percent of the Dutch population aged 12 and older had adhered to national physical-activity guidelines, indicating a widespread culture of exercising regularly. This high level of engagement facilitates regular use of sports nutrition products not just as a performance-enhancing tool but also as a health and wellbeing tool.
Simultaneously, the National Institute of Public Health and the Environment confirms that the promotion of physical-activity is a public-health priority in 2024, which supports the awareness of end users regarding nutrition and recovery. This atmosphere promotes the regular integration of sports nutrition into everyday life as opposed to the intermittent use patterns.
Netherlands Sports Nutrition Market Challenge
Rising cost sensitivity amid food price inflation
Sports nutrition consumption continues to face constraints due to heightened price sensitivity among end users, despite the presence of well-established health and fitness lifestyles. According to Statistics Netherlands, the prices of food and non-alcoholic beverages increased by 7.1% in 2023, and the high price levels are still present in 2024. This inflationary pressure influences discretionary health products, especially premium sports nutrition products, as households review spending priorities.
At the same time, the European Central Bank reports that real household purchasing power in the euro area is under pressure at the beginning of 2024, which strengthens the cautious spending behaviour. As a result, the purchases of sports nutrition are more value-oriented, which restricts the frequency of purchases and promotes the selectivity of products.
Unlock Market Intelligence
Explore the market potential with our data-driven report
Netherlands Sports Nutrition Market Trend
Expansion of protein consumption beyond athletic users
The consumption of protein is becoming more widespread than the conventional sports end users in the Netherlands. According to the RIVM (2024), the awareness of proteins has increased significantly due to the association with muscle maintenance, healthy ageing, and active lifestyles. This expanded knowledge justifies the use of protein-based sports nutrition by non-athletes who want to gain the overall wellness advantages.
This behavioural pattern is supported by social media. Eurostat reports that in 2024, 89% of the population in the Netherlands is using the internet every day, which makes it easier to be exposed to nutrition-related information and education led by influencers. This online platform hastens the mainstream adoption of sports nutrition products.
Netherlands Sports Nutrition Market Opportunity
Convenience-oriented formats aligned with busy lifestyles
The convenience-based nutrition is a significant opportunity in the Netherlands. According to Statistics Netherlands, more than 70% of the working population is employed in full-time or in longer part-time positions in 2024, which supports the need to have portable and time-saving nutrition options. This pattern of lifestyle promotes sports nutrition formats that do not need much preparation.
Moreover, Eurostat also verifies that the penetration of e-commerce among Dutch end users is over 90% in 2024, which makes it easy to access nutrition products. With end users becoming more and more health-focused and time-conscious, sports nutrition products that are framed in terms of portability and ease of use become more relevant to the market.
Unlock Market Intelligence
Explore the market potential with our data-driven report
Netherlands Sports Nutrition Market Segmentation Analysis
By Product Type
- Sports Protein Products
- Protein/Energy Bars
- Sports Protein Powder
- Sports Protein RTD
- Sports Non-Protein Products
The segment with the highest share under product type is sports protein products, accounting for around 80% of the market. This dominance is driven by the widespread use of protein powders, protein bars, and RTD protein drinks among both athletes and non-athletes. Protein products are increasingly viewed as essential for muscle recovery, performance support, and daily nutritional balance.
Beyond traditional sports usage, protein products have gained traction as meal supplements or convenient nutrition solutions for busy end users. Strong product awareness, frequent innovation, and expanding flavour and format options have reinforced their appeal. Over the forecast period, sports protein products will continue to lead the market, supported by rising adoption across wider age groups and lifestyle segments.

By Sales Channel
- Retail Offline
- Retail Online
The segment with the highest share under the sales channel is retail offline, holding around 75% of the market. Physical retail outlets, including drugstores, variety stores, and specialist health retailers, remain important for product discovery and impulse purchases, especially as sports nutrition becomes more mainstream.
Offline channels are also benefiting from expanded shelf space, private label offerings, and promotional activity, making sports nutrition more accessible to everyday end users. While e-commerce remains a key purchase channel due to convenience and bulk buying, retail offline continues to play a vital role in driving visibility, trust, and sustained category growth in the Netherlands.
List of Companies Covered in Netherlands Sports Nutrition Market
The companies listed below are highly influential in the Netherlands sports nutrition market, with a significant market share and a strong impact on industry developments.
- Mondelez Nederland BV
- Active Nutrition International GmbH
- The Hut.com Ltd
- Body & Fit Sportsnutrition BV
- XXL Group BV
- Glanbia Plc
- D-Drinks BV
- AS Watson (Health & Beauty Benelux)
- Camps Food BV
- NutriSense BV
Competitive Landscape
The competitive landscape of sports nutrition in the Netherlands is characterised by strong brand activity, high innovation intensity, and the dominance of e-commerce. Manufacturers continue to invest heavily in new product development across protein powders, bars, and Ready-to-Drink formats, ensuring sustained category momentum. Protein powder remains central to competition, with brands expanding appeal beyond sports enthusiasts through lifestyle positioning and social media influencer campaigns targeting younger demographics. Digital platforms play a critical role, offering broad assortments, competitive pricing, and bulk purchasing options that strengthen brand visibility and loyalty. At the same time, smaller niche channels, including variety stores and drugstores, are gaining relevance by expanding private label and entry-level offerings. This combination of digital strength, influencer-led marketing, and widening channel presence is intensifying competition and supporting category expansion.
Frequently Asked Questions
Related Report
1. Market Segmentation
1.1. Research Scope
1.2. Research Methodology
1.3. Definitions and Assumptions
2. Executive Summary
3. Netherlands Sports Nutrition Market Policies, Regulations, and Standards
4. Netherlands Sports Nutrition Market Dynamics
4.1. Growth Factors
4.2. Challenges
4.3. Trends
4.4. Opportunities
5. Netherlands Sports Nutrition Market Statistics, 2022-2032F
5.1. Market Size & Growth Outlook
5.1.1.By Revenues in USD Million
5.2. Market Segmentation & Growth Outlook
5.2.1.By Product Type
5.2.1.1. Sports Protein Products- Market Insights and Forecast 2022-2032, USD Million
5.2.1.1.1. Protein/Energy Bars- Market Insights and Forecast 2022-2032, USD Million
5.2.1.1.2. Sports Protein Powder- Market Insights and Forecast 2022-2032, USD Million
5.2.1.1.3. Sports Protein RTD- Market Insights and Forecast 2022-2032, USD Million
5.2.1.2. Sports Non-Protein Products- Market Insights and Forecast 2022-2032, USD Million
5.2.2.By Sales Channel
5.2.2.1. Retail Offline- Market Insights and Forecast 2022-2032, USD Million
5.2.2.2. Retail Online- Market Insights and Forecast 2022-2032, USD Million
5.2.3.By Ingredients
5.2.3.1. Vitamins and Minerals- Market Insights and Forecast 2022-2032, USD Million
5.2.3.2. Proteins and Amino Acids- Market Insights and Forecast 2022-2032, USD Million
5.2.3.3. Carbohydrates- Market Insights and Forecast 2022-2032, USD Million
5.2.3.4. Probiotics- Market Insights and Forecast 2022-2032, USD Million
5.2.3.5. Botanicals/Herbals- Market Insights and Forecast 2022-2032, USD Million
5.2.3.6. Others- Market Insights and Forecast 2022-2032, USD Million
5.2.4.By Functionality
5.2.4.1. Energy- Market Insights and Forecast 2022-2032, USD Million
5.2.4.2. Muscle growth- Market Insights and Forecast 2022-2032, USD Million
5.2.4.3. Hydration- Market Insights and Forecast 2022-2032, USD Million
5.2.4.4. Weight Management- Market Insights and Forecast 2022-2032, USD Million
5.2.4.5. Others- Market Insights and Forecast 2022-2032, USD Million
5.2.5.By End User
5.2.5.1. Bodybuilders- Market Insights and Forecast 2022-2032, USD Million
5.2.5.2. Athletes- Market Insights and Forecast 2022-2032, USD Million
5.2.5.3. Lifestyle Users- Market Insights and Forecast 2022-2032, USD Million
5.2.6.By Competitors
5.2.6.1. Competition Characteristics
5.2.6.2. Market Share & Analysis
6. Netherlands Protein Products Sports Nutrition Market Statistics, 2022-2032F
6.1. Market Size & Growth Outlook
6.1.1.By Revenues in USD Million
6.2. Market Segmentation & Growth Outlook
6.2.1.By Sales Channel- Market Insights and Forecast 2022-2032, USD Million
6.2.2.By Ingredients- Market Insights and Forecast 2022-2032, USD Million
6.2.3.By Functionality- Market Insights and Forecast 2022-2032, USD Million
6.2.4.By End User- Market Insights and Forecast 2022-2032, USD Million
7. Netherlands Non-Protein Products Sports Nutrition Market Statistics, 2022-2032F
7.1. Market Size & Growth Outlook
7.1.1.By Revenues in USD Million
7.2. Market Segmentation & Growth Outlook
7.2.1.By Sales Channel- Market Insights and Forecast 2022-2032, USD Million
7.2.2.By Ingredients- Market Insights and Forecast 2022-2032, USD Million
7.2.3.By Functionality- Market Insights and Forecast 2022-2032, USD Million
7.2.4.By End User- Market Insights and Forecast 2022-2032, USD Million
8. Competitive Outlook
8.1. Company Profiles
8.1.1.Body & Fit Sportsnutrition BV
8.1.1.1. Business Description
8.1.1.2. Product Portfolio
8.1.1.3. Collaborations & Alliances
8.1.1.4. Recent Developments
8.1.1.5. Financial Details
8.1.1.6. Others
8.1.2.XXL Group BV
8.1.2.1. Business Description
8.1.2.2. Product Portfolio
8.1.2.3. Collaborations & Alliances
8.1.2.4. Recent Developments
8.1.2.5. Financial Details
8.1.2.6. Others
8.1.3.Glanbia Plc
8.1.3.1. Business Description
8.1.3.2. Product Portfolio
8.1.3.3. Collaborations & Alliances
8.1.3.4. Recent Developments
8.1.3.5. Financial Details
8.1.3.6. Others
8.1.4.D-Drinks BV
8.1.4.1. Business Description
8.1.4.2. Product Portfolio
8.1.4.3. Collaborations & Alliances
8.1.4.4. Recent Developments
8.1.4.5. Financial Details
8.1.4.6. Others
8.1.5.AS Watson (Health & Beauty Benelux)
8.1.5.1. Business Description
8.1.5.2. Product Portfolio
8.1.5.3. Collaborations & Alliances
8.1.5.4. Recent Developments
8.1.5.5. Financial Details
8.1.5.6. Others
8.1.6.Mondelez Nederland BV
8.1.6.1. Business Description
8.1.6.2. Product Portfolio
8.1.6.3. Collaborations & Alliances
8.1.6.4. Recent Developments
8.1.6.5. Financial Details
8.1.6.6. Others
8.1.7.Active Nutrition International GmbH
8.1.7.1. Business Description
8.1.7.2. Product Portfolio
8.1.7.3. Collaborations & Alliances
8.1.7.4. Recent Developments
8.1.7.5. Financial Details
8.1.7.6. Others
8.1.8.Hut.com Ltd, The
8.1.8.1. Business Description
8.1.8.2. Product Portfolio
8.1.8.3. Collaborations & Alliances
8.1.8.4. Recent Developments
8.1.8.5. Financial Details
8.1.8.6. Others
8.1.9.Camps Food BV
8.1.9.1. Business Description
8.1.9.2. Product Portfolio
8.1.9.3. Collaborations & Alliances
8.1.9.4. Recent Developments
8.1.9.5. Financial Details
8.1.9.6. Others
8.1.10. NutriSense BV
8.1.10.1. Business Description
8.1.10.2. Product Portfolio
8.1.10.3. Collaborations & Alliances
8.1.10.4. Recent Developments
8.1.10.5. Financial Details
8.1.10.6. Others
9. Disclaimer
| Segment | Sub-Segment |
|---|---|
| By Product Type |
|
| By Sales Channel |
|
| By Ingredients |
|
| By Functionality |
|
| By End User |
|
Research Methodology
This study followed a structured approach comprising four key phases to assess the size and scope of the electro-oxidation market. The process began with thorough secondary research to collect data on the target market, related markets, and broader industry context. These findings, along with preliminary assumptions and estimates, were then validated through extensive primary research involving industry experts from across the value chain. To calculate the overall market size, both top-down and bottom-up methodologies were employed. Finally, market segmentation and data triangulation techniques were applied to refine and validate segment-level estimations.
Secondary Research
The secondary research phase involved gathering data from a wide range of credible and published sources. This step helped in identifying industry trends, defining market segmentation, and understanding the market landscape and value chain.
Sources consulted during this phase included:
- Company annual reports, investor presentations, and press releases
- Industry white papers and certified publications
- Trade directories and market-recognized databases
- Articles from authoritative authors and reputable journals
- Gold and silver standard websites
Secondary research was critical in mapping out the industry's value chain and monetary flow, identifying key market segments, understanding regional variations, and tracking significant industry developments.
Other key sources:
- Financial disclosures
- Industry associations and trade bodies
- News outlets and business magazines
- Academic journals and research studies
- Paid industry databases
Primary Research
To validate secondary data and gain deeper market insights, primary research was conducted with key stakeholders across both the supply and demand sides of the market.
On the demand side, participants included decision-makers and influencers from end-user industries—such as CIOs, CTOs, and CSOs—who provided first-hand perspectives on market needs, product usage, and future expectations.
On the supply side, interviews were conducted with manufacturers, industry associations, and institutional participants to gather insights into current offerings, product pipelines, and market challenges.
Primary interviews provided critical inputs such as:
- Market size and revenue data
- Product and service breakdowns
- Market forecasts
- Regional and application-specific trends
Stakeholders consulted included:
- Leading OEM and solution providers
- Channel and distribution partners
- End users across various applications
- Independent consultants and industry specialists
Market Size Estimation and Data Triangulation
- Identifying Key Market Participants (Secondary Research)
- Goal: To identify the major players or companies in the target market. This typically involves using publicly available data sources such as industry reports, market research publications, and financial statements of companies.
- Tools: Reports from firms like Gartner, Forrester, Euromonitor, Statista, IBISWorld, and others. Public financial statements, news articles, and press releases from top market players.
- Extracting Earnings of Key Market Participants
- Goal: To estimate the earnings generated from the product or service being analyzed. This step helps in understanding the revenue potential of each market player in a specific geography.
- Methods: Earnings data can be gathered from:
- Publicly available financial reports (for listed companies).
- Interviews and primary data sources from professionals, such as Directors, VPs, SVPs, etc. This is especially useful for understanding more nuanced, internal data that isn't publicly disclosed.
- Annual reports and investor presentations of key players.
- Data Collation and Development of a Relevant Data Model
- Goal: To collate inputs from both primary and secondary sources into a structured, data-driven model for market estimation. This model will incorporate key market KPIs and any independent variables relevant to the market.
- Key KPIs: These could include:
- Market size, growth rate, and demand drivers.
- Industry-specific metrics like market share, average revenue per customer (ARPC), or average deal size.
- External variables, such as economic growth rates, inflation rates, or commodity prices, that could affect the market.
- Data Modeling: Based on this data, the market forecasts are developed for the next 5 years. A combination of trend analysis, scenario modeling, and statistical regression might be used to generate projections.
- Scenario Analysis
- Goal: To test different assumptions and validate how sensitive the market is to changes in key variables (e.g., market demand, regulatory changes, technological disruptions).
- Types of Scenarios:
- Base Case: Based on current assumptions and historical data.
- Best-Case Scenario: Assuming favorable market conditions, regulatory environments, and technological advancements.
- Worst-Case Scenario: Accounting for adverse factors, such as economic downturns, stricter regulations, or unexpected disruptions.


