US Wearable Medical Devices Market Report: Trends, Growth and Forecast (2026-2032)
Product Type (Diagnostic & Monitoring Devices (Vital Sign Monitoring Devices (Heart Rate Monitors, Activity Monitors, Electrocardiographs, Pulse Oximeters, Spirometers, Blood Pressure Monitors), Sleep Monitoring Devices (Sleep trackers, Wrist Actigraphs, Polysomnographs), Electrocardiographs Fetal and Obstetric Devices, Neuromonitoring Devices), Therapeutic Devices (Rehabilitation Devices, Respiratory Therapy Devices, Pain Management Devices, Hearing Aids, Insulin/Glucose Monitoring Devices)), Application (Remote Patient Monitoring, Home Healthcare, Sports & Fitness), Grade (Consumer Grade, Clinical Grade), Site (Handheld, Headband, Strap/Clip/Bracelet, Shoe Sensors, Others), Sales Channel (Retail Online, Retail Offline (Pharmacies, Hypermarkets, Others)) ... Read more
|
Major Players
|
US Wearable Medical Devices Market Statistics and Insights, 2026
- Market Size Statistics
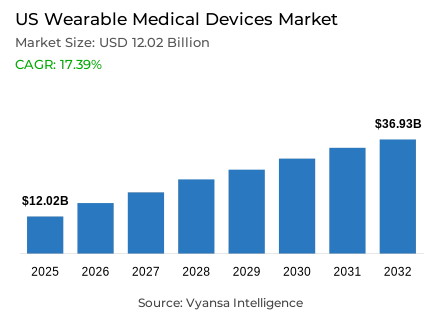
- Wearable medical devices in US is estimated at USD 12.02 billion in 2025.
- The market size is expected to grow to USD 36.93 billion by 2032.
- Market to register a cagr of around 17.39% during 2026-32.
- Product Type Shares
- Diagnostic & monitoring devices grabbed market share of 70%.
- Competition
- More than 15 companies are actively engaged in producing wearable medical devices in US.
- Top 5 companies acquired around 50% of the market share.
- Medtronic; Omron Corp.; Withings; Koninklijke Philips N.V.; Apple Inc. etc., are few of the top companies.
- Sales Channel
- Retail online grabbed 60% of the market.
US Wearable Medical Devices Market Outlook
US wearable medical devices market is also showing a quick growth due to the growing cases of chronic diseases and the shift towards real-time monitoring of health. In 2025, the market size was approximately USD 12.02 billion and is expected to grow up to USD 36.93 billion by 2032 at a CAGR of around 17.39% from 2026-2032. The increasing incidence of obesity, hypertension, and diabetes among more than 190 million adults has fueled the need for technologies that allow ongoing monitoring and early diagnosis of anomalies in health, facilitating better control over disease and fewer hospitalizations.
Supportive government policies and payment incentives by the Centers for Medicare and Medicaid Services (CMS) have further elevated the adoption of wearable technology in healthcare. New Remote Physiological and Therapeutic Monitoring reimbursement codes are motivating hospitals and physicians to adopt wearables into patient treatment. At the same time, expanding telehealth usage, which represented 12.6% of all Medicare visits by late 2023, continues to fuel the need for connected, data-driven medical solutions.
Product-wise, diagnostic and monitoring equipment have the top 70% market share. This encompasses continuous monitors for vital parameters like glucose, ECG, and oxygen saturation, aided by FDA clearances for a number of AI-driven systems for improved accuracy and ease of use. The availability of over-the-counter wearables such as Dexcom's Stelo Glucose Biosensor has also enhanced convenience, enabling users to treat chronic illness autonomously outside mainstream clinical settings.
Distribution-wise, Retail Online is the leader with approximately 60% market share, aided by robust e-commerce infrastructure, digital convenience, and same-day delivery. High-end brands like Apple and Fitbit have taken advantage of this by scaling up their direct-to-consumer platforms, providing authenticity-verified purchases, hassle-free returns, and user support programs promising increased inclusiveness and market penetration across broad age groups.

US Wearable Medical Devices Market Growth DriverRising Chronic Disease Prevalence Accelerating Demand for Continuous Monitoring
The increasing incidence of chronic diseases in the U.S. is accelerating adoption of wearable medical technology over time for continuous health monitoring. As of 2023, 76.4% of adults report having one or more chronic conditions, amounting to approximately 194 million adults, with approximately 51% of this subset reporting two or more chronic conditions. Increasing rates of obesity (32.7%), hypertension (34.5%), and diabetes (12.1%) have been particularly strong drivers of demand for diagnostic and monitoring interventions. Wearables provide for real-time anomaly detection and the provision of earlier health insights, thereby allowing end users to better self-manage conditions such as cardiovascular disease and diabetes, and the overall care practice can help reduce hospital visits. The integration of advanced biosensors and biosensor analytics is another component to improve chronic disease management in clinical and community settings.
Further growth in the marketplace is also being driven by payment incentives from the federal Centers for Medicare and Medicaid Services (CMS) with new coding incentives for Remote Physiological Monitoring and Remote Therapeutic Monitoring services and reimbursement. The incorporation of such reimbursement improves the integration of wearables into care delivery options for healthcare practitioners. In addition, the incidence of telehealth visits increased dramatically to 12.6% of all Medicare visits by late 2023, resulting in increased incentives for practitioners in the regulatory and technological setting for high-volume and widespread practice across diverse cohorts of patients, offering ongoing growth of wearables across patient populations as consumers of care.
US Wearable Medical Devices Market ChallengeComplex Compliance and Cybersecurity Standards Restrict Market Expansion
Stringent data privacy and security regulations continue to challenge the expansion of the US wearable medical devices market. Equipment that harvests electronic protected health information is subject to compliance with the Health Insurance Portability and Accountability Act (HIPAA), which demands strong encryption, access controls, and audit mechanisms in order to avoid unauthorized disclosure of data. At the same time, the FDA enforces compliance with cybersecurity requirements for Software as a Medical Device (SaMD), forcing manufacturers to perform extensive risk analyses and adopt multilayered cyber defenses. These twin requirements pose significant administrative and technical challenges for market players, especially small and medium-sized producers.
Continued integration into electronic health records and cloud infrastructure adds further cybersecurity risks. HIPAA non-compliance can incur fines of up to $1.5 million per incident, mounting both financial and reputational risk. Sustained investments in personnel training, risk audits, and documentation procedures are needed to ensure continued compliance with concurrent regulatory requirements. This sophisticated regulatory landscape prolongs product development cycles and increases operational expenses, limiting innovation cycles and postponing the introduction of new wearable solutions in the healthcare ecosystem.
Unlock Market Intelligence
Explore the market potential with our data-driven report
US Wearable Medical Devices Market TrendRising Traction Towards Over-the-Counter and Consumer-Grade Wearables Driving Market Expansion
The increased visibility of over-the-counter (OTC) and consumer-level wearables is transforming accessibility in the US wearable medical devices market. The 2024 FDA clearance of Dexcom's Stelo Glucose Biosensor-the first OTC continuous glucose monitor-is a major milestone toward direct-to-user health technologies. These non-prescription devices extend healthcare interaction beyond the clinician's office and enable end users to manage health conditions independently. Today, consumer-focused wearables control 62.1% of market share, which mirrors broad appeal due to smartphone compatibility, sensor miniaturization, and application-based interfaces that ease ongoing monitoring of vital parameters.
E-commerce platforms have become the key facilitators of market growth, providing end users seamless access to wearable devices as well as clear product information and reputable reviews that reinforce buying confidence. With 44% of Americans possessing wearable health trackers, uptake is growing very fast among Millennials and Gen Z end users, who increasingly perceive wearables as part of regular wellness. Improvements in AI-powered features and cloud analytics continue to obscure lines between lifestyle and medical-grade devices, guaranteeing consistent market growth through user-oriented innovation and affordability.
US Wearable Medical Devices Market OpportunityGrowing Market Potential Among Elderly and Rural End Users
The older population represents vast unrealized opportunities for wearables based on medical devices because they have high rates of chronic disease and are growing older. Adaptation among 55-65-year-olds is about 30%, and usage among over-65s is 19-25%. As the population of seniors is likely to hit 98 million by 2060, the demand for ongoing monitoring devices will increase. Products like atrial fibrillation-detecting smartwatches and hear-assist AirPods are solutions to age-related issues. Partnering among device makers, healthcare systems, and senior organizations will increase reach and sell wearables as necessary health friends instead of fashion items.
Rural areas are a further significant growth opportunity, where connectivity constraints have held back adoption in the past. Approximately 22% of rural Americans remain without broadband access; however, developments in satellite-capable and low-battery-using devices are reducing these barriers. Federally qualified health centers and rural hospitals are increasingly adding wearable monitoring programs under CMS-reimbursable models. This convergence of population demand, technological innovation, and policy encouragement sets both rural and elderly populations up as strategic targets for future wearable device market penetration.
Unlock Market Intelligence
Explore the market potential with our data-driven report
US Wearable Medical Devices Market Segmentation Analysis
By Product Type
- Diagnostic & Monitoring Devices
- Therapeutic Devices
Diagnostic and monitoring devices have the largest share, around 70% of the wearable product category. This segment encompasses continuous monitors for vital signs like heart rate, blood pressure, oxygen saturation, ECG, and glucose monitoring-of utmost importance for controlling chronic conditions. Advances in sensors, connectivity, and AI enhance device accuracy, user experience, and clinical usefulness. Most noteworthy is that 17 AI/ML-based wearables have been cleared by the FDA for cardiovascular and anesthesiology monitoring since 2022, highlighting pace of innovation.
Continual glucose monitoring (CGM) devices are one example of rapid growth, with FDA approval for OTC systems opening consumer access. Real-world experience confirms CGM capability in enhancing glycemic control over conventional approaches. Hospitals and clinics increasingly incorporate diagnostic wearables into electronic health records, facilitating remote monitoring and clinical decision-making, thereby reinforcing this segment's market leadership.

By Sales Channel
- Retail Online
- Retail Offline
Retail Online is the dominant channel in the US market for wearable medical devices and controls around 60% of total sales. Online marketplaces such as Amazon, Best Buy, and specialty health stores provide full product availability, clear comparisons, and customer service-a rich shopping experience for various end users. Intense internet penetration and smartphone use have promoted online activity, while better logistics now enable same-day delivery throughout metropolitan areas. The transition to contactless buying and digital convenience, further accelerated throughout and following the pandemic, continues to make online platforms the desired distribution medium.
High-end producers such as Apple and Fitbit/Google are leveraging this trend by running owned e-commerce sites that facilitate direct involvement and increased profit margins. To meet possible concerns of product genuineness and returns, Internet stores are investing in high-strength verification systems, open warranty policies, and user support programs. Collaborations with healthcare professionals to develop easy online registration for older or technologically unsavvy end users are increasing inclusiveness. Together, these advancements guarantee that online selling is the leading and most effective sales channel for wearable medical devices in the United States.
List of Companies Covered in US Wearable Medical Devices Market
The companies listed below are highly influential in the US wearable medical devices market, with a significant market share and a strong impact on industry developments.
- Medtronic
- Omron Corp.
- Withings
- Koninklijke Philips N.V.
- Apple Inc.
- Fitbit
- Basis Science
- Garmin
- Vital Connect
- Polar Electro
Frequently Asked Questions
Related Report
1. Market Segmentation
1.1. Research Scope
1.2. Research Methodology
1.3. Definitions and Assumptions
2. Executive Summary
3. US Wearable Medical Devices Market Policies, Regulations, and Standards
4. US Wearable Medical Devices Market Dynamics
4.1. Growth Factors
4.2. Challenges
4.3. Trends
4.4. Opportunities
5. US Wearable Medical Devices Market Statistics, 2022-2032F
5.1. Market Size & Growth Outlook
5.1.1.By Revenues in US$ Million
5.2. Market Segmentation & Growth Outlook
5.2.1.By Product Type
5.2.1.1. Diagnostic & Monitoring Devices- Market Insights and Forecast 2022-2032, USD Million
5.2.1.1.1. Vital Sign Monitoring Devices- Market Insights and Forecast 2022-2032, USD Million
5.2.1.1.1.1. Heart Rate Monitors- Market Insights and Forecast 2022-2032, USD Million
5.2.1.1.1.2. Activity Monitors- Market Insights and Forecast 2022-2032, USD Million
5.2.1.1.1.3. Electrocardiographs- Market Insights and Forecast 2022-2032, USD Million
5.2.1.1.1.4. Pulse Oximeters- Market Insights and Forecast 2022-2032, USD Million
5.2.1.1.1.5. Spirometers- Market Insights and Forecast 2022-2032, USD Million
5.2.1.1.1.6. Blood Pressure Monitors- Market Insights and Forecast 2022-2032, USD Million
5.2.1.1.2. Sleep Monitoring Devices- Market Insights and Forecast 2022-2032, USD Million
5.2.1.1.2.1. Sleep trackers- Market Insights and Forecast 2022-2032, USD Million
5.2.1.1.2.2. Wrist Actigraphs- Market Insights and Forecast 2022-2032, USD Million
5.2.1.1.2.3. Polysomnographs- Market Insights and Forecast 2022-2032, USD Million
5.2.1.1.3. Electrocardiographs Fetal and Obstetric Devices- Market Insights and Forecast 2022-2032, USD Million
5.2.1.1.4. Neuromonitoring Devices - Market Insights and Forecast 2022-2032, USD Million
5.2.1.2. Therapeutic Devices- Market Insights and Forecast 2022-2032, USD Million
5.2.1.2.1. Rehabilitation Devices- Market Insights and Forecast 2022-2032, USD Million
5.2.1.2.2. Respiratory Therapy Devices- Market Insights and Forecast 2022-2032, USD Million
5.2.1.2.3. Pain Management Devices- Market Insights and Forecast 2022-2032, USD Million
5.2.1.2.4. Hearing Aids- Market Insights and Forecast 2022-2032, USD Million
5.2.1.2.5. Insulin/Glucose Monitoring Devices- Market Insights and Forecast 2022-2032, USD Million
5.2.2.By Application
5.2.2.1. Remote Patient Monitoring- Market Insights and Forecast 2022-2032, USD Million
5.2.2.2. Home Healthcare- Market Insights and Forecast 2022-2032, USD Million
5.2.2.3. Sports & Fitness- Market Insights and Forecast 2022-2032, USD Million
5.2.3.By Grade
5.2.3.1. Consumer Grade- Market Insights and Forecast 2022-2032, USD Million
5.2.3.2. Clinical Grade- Market Insights and Forecast 2022-2032, USD Million
5.2.4.By Site
5.2.4.1. Handheld- Market Insights and Forecast 2022-2032, USD Million
5.2.4.2. Headband- Market Insights and Forecast 2022-2032, USD Million
5.2.4.3. Strap/Clip/Bracelet- Market Insights and Forecast 2022-2032, USD Million
5.2.4.4. Shoe Sensors- Market Insights and Forecast 2022-2032, USD Million
5.2.4.5. Others- Market Insights and Forecast 2022-2032, USD Million
5.2.5.By Sales Channel
5.2.5.1. Retail Online- Market Insights and Forecast 2022-2032, USD Million
5.2.5.2. Retail Offline- Market Insights and Forecast 2022-2032, USD Million
5.2.5.2.1. Pharmacies- Market Insights and Forecast 2022-2032, USD Million
5.2.5.2.2. Hypermarkets- Market Insights and Forecast 2022-2032, USD Million
5.2.5.2.3. Others- Market Insights and Forecast 2022-2032, USD Million
5.2.6.By Competitors
5.2.6.1. Competition Characteristics
5.2.6.2. Market Share & Analysis
6. US Diagnostic & Monitoring Devices Wearable Medical Devices Market Statistics, 2022-2032F
6.1. Market Size & Growth Outlook
6.1.1.By Revenues in US$ Million
6.2. Market Segmentation & Growth Outlook
6.2.1.By Product Type- Market Insights and Forecast 2022-2032, USD Million
6.2.2.By Application- Market Insights and Forecast 2022-2032, USD Million
6.2.3.By Grade- Market Insights and Forecast 2022-2032, USD Million
6.2.4.By Site- Market Insights and Forecast 2022-2032, USD Million
6.2.5.By Sales Channel- Market Insights and Forecast 2022-2032, USD Million
7. US Therapeutic Devices Wearable Medical Devices Market Statistics, 2022-2032F
7.1. Market Size & Growth Outlook
7.1.1.By Revenues in US$ Million
7.2. Market Segmentation & Growth Outlook
7.2.1.By Product Type- Market Insights and Forecast 2022-2032, USD Million
7.2.2.By Application- Market Insights and Forecast 2022-2032, USD Million
7.2.3.By Grade- Market Insights and Forecast 2022-2032, USD Million
7.2.4.By Site- Market Insights and Forecast 2022-2032, USD Million
7.2.5.By Sales Channel- Market Insights and Forecast 2022-2032, USD Million
8. Competitive Outlook
8.1. Company Profiles
8.1.1.Koninklijke Philips N.V.
8.1.1.1. Business Description
8.1.1.2. Product Portfolio
8.1.1.3. Collaborations & Alliances
8.1.1.4. Recent Developments
8.1.1.5. Financial Details
8.1.1.6. Others
8.1.2.Apple Inc.
8.1.2.1. Business Description
8.1.2.2. Product Portfolio
8.1.2.3. Collaborations & Alliances
8.1.2.4. Recent Developments
8.1.2.5. Financial Details
8.1.2.6. Others
8.1.3.Fitbit
8.1.3.1. Business Description
8.1.3.2. Product Portfolio
8.1.3.3. Collaborations & Alliances
8.1.3.4. Recent Developments
8.1.3.5. Financial Details
8.1.3.6. Others
8.1.4.Basis Science
8.1.4.1. Business Description
8.1.4.2. Product Portfolio
8.1.4.3. Collaborations & Alliances
8.1.4.4. Recent Developments
8.1.4.5. Financial Details
8.1.4.6. Others
8.1.5.Garmin
8.1.5.1. Business Description
8.1.5.2. Product Portfolio
8.1.5.3. Collaborations & Alliances
8.1.5.4. Recent Developments
8.1.5.5. Financial Details
8.1.5.6. Others
8.1.6.Medtronic
8.1.6.1. Business Description
8.1.6.2. Product Portfolio
8.1.6.3. Collaborations & Alliances
8.1.6.4. Recent Developments
8.1.6.5. Financial Details
8.1.6.6. Others
8.1.7.Omron Corp.
8.1.7.1. Business Description
8.1.7.2. Product Portfolio
8.1.7.3. Collaborations & Alliances
8.1.7.4. Recent Developments
8.1.7.5. Financial Details
8.1.7.6. Others
8.1.8.Withings
8.1.8.1. Business Description
8.1.8.2. Product Portfolio
8.1.8.3. Collaborations & Alliances
8.1.8.4. Recent Developments
8.1.8.5. Financial Details
8.1.8.6. Others
8.1.9.Vital Connect
8.1.9.1. Business Description
8.1.9.2. Product Portfolio
8.1.9.3. Collaborations & Alliances
8.1.9.4. Recent Developments
8.1.9.5. Financial Details
8.1.9.6. Others
8.1.10. Polar Electro
8.1.10.1. Business Description
8.1.10.2. Product Portfolio
8.1.10.3. Collaborations & Alliances
8.1.10.4. Recent Developments
8.1.10.5. Financial Details
8.1.10.6. Others
9. Disclaimer
| Segment | Sub-Segment |
|---|---|
| By Product Type |
|
| By Application |
|
| By Grade |
|
| By Site |
|
| By Sales Channel |
|
Research Methodology
This study followed a structured approach comprising four key phases to assess the size and scope of the electro-oxidation market. The process began with thorough secondary research to collect data on the target market, related markets, and broader industry context. These findings, along with preliminary assumptions and estimates, were then validated through extensive primary research involving industry experts from across the value chain. To calculate the overall market size, both top-down and bottom-up methodologies were employed. Finally, market segmentation and data triangulation techniques were applied to refine and validate segment-level estimations.
Secondary Research
The secondary research phase involved gathering data from a wide range of credible and published sources. This step helped in identifying industry trends, defining market segmentation, and understanding the market landscape and value chain.
Sources consulted during this phase included:
- Company annual reports, investor presentations, and press releases
- Industry white papers and certified publications
- Trade directories and market-recognized databases
- Articles from authoritative authors and reputable journals
- Gold and silver standard websites
Secondary research was critical in mapping out the industry's value chain and monetary flow, identifying key market segments, understanding regional variations, and tracking significant industry developments.
Other key sources:
- Financial disclosures
- Industry associations and trade bodies
- News outlets and business magazines
- Academic journals and research studies
- Paid industry databases
Primary Research
To validate secondary data and gain deeper market insights, primary research was conducted with key stakeholders across both the supply and demand sides of the market.
On the demand side, participants included decision-makers and influencers from end-user industries—such as CIOs, CTOs, and CSOs—who provided first-hand perspectives on market needs, product usage, and future expectations.
On the supply side, interviews were conducted with manufacturers, industry associations, and institutional participants to gather insights into current offerings, product pipelines, and market challenges.
Primary interviews provided critical inputs such as:
- Market size and revenue data
- Product and service breakdowns
- Market forecasts
- Regional and application-specific trends
Stakeholders consulted included:
- Leading OEM and solution providers
- Channel and distribution partners
- End users across various applications
- Independent consultants and industry specialists
Market Size Estimation and Data Triangulation
- Identifying Key Market Participants (Secondary Research)
- Goal: To identify the major players or companies in the target market. This typically involves using publicly available data sources such as industry reports, market research publications, and financial statements of companies.
- Tools: Reports from firms like Gartner, Forrester, Euromonitor, Statista, IBISWorld, and others. Public financial statements, news articles, and press releases from top market players.
- Extracting Earnings of Key Market Participants
- Goal: To estimate the earnings generated from the product or service being analyzed. This step helps in understanding the revenue potential of each market player in a specific geography.
- Methods: Earnings data can be gathered from:
- Publicly available financial reports (for listed companies).
- Interviews and primary data sources from professionals, such as Directors, VPs, SVPs, etc. This is especially useful for understanding more nuanced, internal data that isn't publicly disclosed.
- Annual reports and investor presentations of key players.
- Data Collation and Development of a Relevant Data Model
- Goal: To collate inputs from both primary and secondary sources into a structured, data-driven model for market estimation. This model will incorporate key market KPIs and any independent variables relevant to the market.
- Key KPIs: These could include:
- Market size, growth rate, and demand drivers.
- Industry-specific metrics like market share, average revenue per customer (ARPC), or average deal size.
- External variables, such as economic growth rates, inflation rates, or commodity prices, that could affect the market.
- Data Modeling: Based on this data, the market forecasts are developed for the next 5 years. A combination of trend analysis, scenario modeling, and statistical regression might be used to generate projections.
- Scenario Analysis
- Goal: To test different assumptions and validate how sensitive the market is to changes in key variables (e.g., market demand, regulatory changes, technological disruptions).
- Types of Scenarios:
- Base Case: Based on current assumptions and historical data.
- Best-Case Scenario: Assuming favorable market conditions, regulatory environments, and technological advancements.
- Worst-Case Scenario: Accounting for adverse factors, such as economic downturns, stricter regulations, or unexpected disruptions.


