Kenya Dermatologicals Market Report: Trends, Growth and Forecast (2026-2032)
By Category (Medicated Shampoos, Topical Antifungals, Vaginal Antifungals, Hair Loss Treatments, Nappy (Diaper) Rash Treatments, Antiparasitics/Lice (Head and Body) Treatments, Antipruritics, Cold Sore Treatments, Haemorrhoid Treatments, Paediatric Dermatologicals, Topical Allergy Remedies/Antihistamines, Topical Germicidals/Antiseptics), By Dispensing Status (Prescription-based Drugs, Over-the-counter Drugs), By Route of Administration (Topical Administration, Oral Administration, Parenteral Administration), By Drug Type (Branded, Generics), By Skin Condition (Acne, Dermatitis, Psoriasis, Skin Cancer, Rosacea, Alopecia, Fungal Infections, Others), By End User (Hospitals, Cosmetic Centers, Dermatology Clinics, Homecare, Others), By Sales Channel (Retail Offline, Retail Online) ... Read more
|
Major Players
|
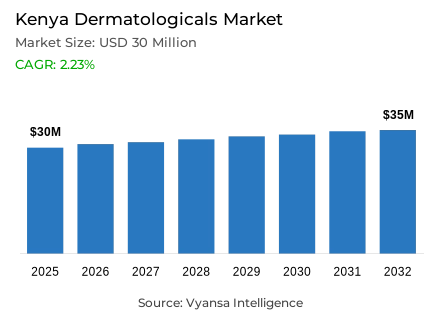
Kenya Dermatologicals Market Statistics and Insights, 2026
- Market Size Statistics
- Dermatologicals in Kenya is estimated at USD 30 million in 2025.
- The market size is expected to grow to USD 35 million by 2032.
- Market to register a cagr of around 2.23% during 2026-32.
- Category Shares
- Antiparasitics/lice (head and body) treatments grabbed market share of 30%.
- Competition
- More than 20 companies are actively engaged in producing dermatologicals in Kenya.
- Top 5 companies acquired around 35% of the market share.
- Bayer East Africa Ltd; Meditech International (Pvt) Ltd; LEO Pharma LAMEA; Glenmark Pharmaceuticals (K) Ltd; Regal Pharmaceuticals Ltd etc., are few of the top companies.
- Sales Channel
- Retail offline grabbed 95% of the market.
Kenya Dermatologicals Market Outlook
The growth of the Kenya Dermatologicals Market is expected to remain sustained across the forecast period, supported by rising end-user awareness about skin care and a clear shift toward self-care behaviours. By 2025, the market value is projected to reach USD 30 million, increasing to USD 35 million by 2032 at a 2.23% CAGR. The growing demand for natural and herbal products, such as African black soap and shea butter, will continue to challenge traditional chemical-based formulations as end users increasingly prioritise gentle, long-lasting alternatives for managing skin concerns.
Retail offline channels accounted for 95% of the market in 2025, a dominance expected to continue due to strong end-user trust and widespread accessibility of pharmacies and beauty supply stores. At the same time, the rapid growth of the beauty and personal care sector is reinforcing demand for dermatologicals. More end users are seeking treatments for acne, hyperpigmentation, eczema and related conditions, while self-treatment practices are rising. As a result, OTC products containing active ingredients like benzoyl peroxide and salicylic acid are gaining broader acceptance, supporting continued sales growth as more individuals manage skin issues independently.
Topical antifungals are forecast to achieve strong ongoing growth, driven by rising cases of ringworm and athlete's foot and the increasing preference for convenient OTC remedies. Conversely, cold sore treatments are likely to record minimal growth given the low prevalence of herpes simplex and limited innovation in this segment. Paediatric dermatologicals-particularly nappy rash treatments-are expected to grow significantly as childhood skin issues become more common and affordable baby care products improve household access.
Overall, the Kenya Dermatologicals Market is set to continue expanding despite macroeconomic pressures, supported by greater uptake of natural products, rising awareness of skin health, and a strengthening culture of end-user self-care.

Kenya Dermatologicals Market Growth Driver
Growth of Beauty & Personal Care Expands Dermatological Demand
The rapid expansion of the Beauty and Personal Care market is increasing end-user focus on skin quality, texture, and overall skin health. As more individuals adopt structured beauty routines to address concerns such as acne, hyperpigmentation, eczema, and dryness, demand for targeted dermatological products continues to rise. The Urban population in Kenya was approximately 28 % of the total population in 2021, which is expected to continue in the future as Urbanisation continues to increase, as a result of the increasing levels of pollution and stress as well as cosmetic product usage all lead to increased issues concerned with dermatological health.
The growing awareness of the aesthetic and wellness aspects of both therapy and beauty product benefits have driven the ever increasing demand for the growing range of dermatological products offering both therapeutic and beauty enhancing benefits. As a result, the majority of endusers are viewing caring for their skin as an extension of their beauty regimen, and incorporating over-the-counter products into their daily routine. Therefore, the increase in awareness of the many dermatological health issues are driving up the consumption of Derm Creams, Antifungals, Paediatric Products, and Anti-Acne Products within this expanding Beauty and Personal Care Market. As the Beauty and Personal Care Culture in Kenya continues to grow, so will the Dermatological Products available to endusers.
Kenya Dermatologicals Market Challenge
High Prevalence of Skin Diseases Outpaces Access to Professional Care
The Kenyan dermatological market faces a major challenge. As a result of the high prevalence of dermatological disease, the Kenyan market limited access to dermatology professionals forces its endusers to use very inconsistent / incomplete treatment options. The overwhelming number of skin ailments in Kenya includes several common fungal infections and numerous pediatric rashes. All of these skin problems are also significant drivers of sales for non-prescription (OTC) skin treatments. Yet, many endusers do not have a physician licensed to prescribe them before they purchase these OTC products due to lack of access to licensed dermatologists. Therefore, their use of OTC skin treatments has an increased potential for incompetently using these products or being delayed in their ability to see a qualified dermatologist for appropriate treatment based on their dermatopathological diagnosis. There is a disconnect to this degree because there are not enough qualified dermatologists to meet the demand for dermatological care, when most of the population has had limited access to this kind of care.
According to the WHO, dermatopathological disabilities are some of the top ten causes of disability in the world, mostly affecting millions of people in developing nations, as is the case in Kenya. Kenya also has a very small population of dermatologists, as the public health system cannot provide timely access to specialist services for its 55 million+ citizens, who will continue to self-medicate and rely on the use of OTC products in lieu of receiving a proper dermatopathological diagnosis, treatment adherence, and long-term care.
Unlock Market Intelligence
Explore the market potential with our data-driven report
Kenya Dermatologicals Market Trend
Self-Care & OTC Dermatologicals Gain Momentum
The increasing digital accessibility and growing health literacy has led to a boom in the self-care movement and a surge in the use of OTC dermatological treatments in Kenya, as more and more people are choosing to take care of their own skin problems instead of relying on a doctor. This recent trend toward treating yourself at home is in large part due to the wide availability of active pharmaceutical ingredients such as benzoyl peroxide and salicylic acid. With these ingredients being so easily available, people have started to take matters into their own hands when dealing with acne, rashes, and hyperpigmentation issues.This cultural shift is a reflection of global trends in digital behaviour, which has seen dramatic increases in the amount of time spent online. There has been an explosion in the number of people connected to the internet in Kenya as of 2022-2023 approximately 34.2% of the population was using the internet. This means Kenya is experiencing a rapidly increasing amount of connectivity, and is one of the highest-level connected countries within Sub-Saharan Africa.
The rise in the number of Kenyans who are using the internet as their primary source of information has led to increased credibility for OTC products, as well as patterns of frequent use. Additionally, there is now a growing expectation of convenience and access to effective and lower-cost medications for treating chronic conditions, such as acne or fungal infections. This cultural shift toward empowerment and self-care will continue to be a strong beneficial demand for OTC dermatological solutions moving forward, and subsequently, will create additional pressure for brands to develop enduser education-based communication strategies and design products that are user-friendly and accessible.
Kenya Dermatologicals Market Opportunity
Growing Male Awareness Expands Men's Dermatologicals Segment
Rising skincare awareness among men in Kenya creates an opportunity for a previously untapped segment of the market that can be developed. Men are now looking to address issues such as acne, ingrown hairs, hyperpigmentation, and dry and aging skin by purchasing products that were formerly marketed to women. The rise of this segment of the population is supported by the demographics of Kenya. The Kenya National Bureau of Statistics states that approximately 46% of the population is below the age of 18 therefore, younger generations are more susceptible to global grooming trends and exposure through social media.
The combination of a younger demographic, increasing exposure to global grooming trends, and growing disposable income among urban, young males puts men's dermatological products in a very viable category for local and international brands. As more men invest in their appearance and overall wellness, there will be a growing demand for specific skincare solutions such as men's acne treatments, moisturisers, and anti-ageing creams. Brands that educate endusers about the benefits of using skincare products for men, break the stigma of men's skincare routines, and provide easy access to innovative skincare products for men will experience greater growth and gain a larger share of value within this emerging, rapidly-growing market for men's skincare.
Unlock Market Intelligence
Explore the market potential with our data-driven report
Kenya Dermatologicals Market Segmentation Analysis
By Category
- Medicated Shampoos
- Topical Antifungals
- Vaginal Antifungals
- Hair Loss Treatments
- Nappy (Diaper) Rash Treatments
- Antiparasitics/Lice (Head and Body) Treatments
- Antipruritics
- Cold Sore Treatments
- Haemorrhoid Treatments
- Paediatric Dermatologicals
- Topical Allergy Remedies/Antihistamines
- Topical Germicidals/Antiseptics
The segment with highest market share under Category isAntiparasitics/Lice (Head and Body) Treatments, which represents about 30% of the share. Due to the high levels of lice infestation in school-aged children and densely populated urban areas, the demand for these items continues to be extremely high. With more people being made aware of the importance of personal hygiene and the availability of inexpensive OTC antiparasitic treatments, the purchase of the products has increased over time. Those products have become trusted by many as effective and fast-acting remedies for lice, thus making them very desirable items for families to have at home.
Antiparasitic products will continue to dominate the Category, as parents are very concerned about preventing lice outbreaks. The rising trend of self-care will increase the need for self-care dermatologicals and promote the use of OTC products, allowing endusers to use the products without having to see a medical professional

By Sales Channel
- Retail Offline
- Retail Online
The segment with highest market share under sales Channel is retail offline with around 95% share of the distribution of dermatologicals in Kenya. Retail outlets such as pharmacies, beauty shops and general retailers dominate due to their ease of access and a strong sense of enduser trust. These outlets provide a large variety of over-the-counter products, including antiparasitic medications, antifungal medicines and children's skin care products, thereby establishing themselves as the first source of products for skin related problems.
In addition to this, the extremely informal nature of retailing in Kenya contributes to continued dominance of offline retailers because many endusers depend on trusted local shops and pharmacies for their day-to-day needs. The %age of endusers buying products online is steadily increasing, however, the limited penetration of digital devices and the continued desire by endusers to check the product in person keeps offline retailing as the primary retailing channel. Therefore, as endusers become more aware of the importance of skin health, retailing will retain its dominant position for distributing dermatologicals
List of Companies Covered in Kenya Dermatologicals Market
The companies listed below are highly influential in the Kenya dermatologicals market, with a significant market share and a strong impact on industry developments.
- Bayer East Africa Ltd
- Meditech International (Pvt) Ltd
- LEO Pharma LAMEA
- Glenmark Pharmaceuticals (K) Ltd
- Regal Pharmaceuticals Ltd
- Bulk Medicals Ltd
- Pharmaceutical Mfg Co Kenya
- Cosmos Ltd
- Thornton & Ross Ltd
- Elys Chemicals Ltd
Competitive Landscape
Kenya's dermatologicals market in 2024 is experiencing intensifying competition as natural and herbal brands challenge long-established chemical-based products. Local market participants including Earthy Skin Essentials are gaining market visibility by leveraging indigenous ingredients including African black soap and shea butter, appealing to endusers seeking safer, gentler alternatives. Traditional brands including Sudocrem now confront intensified competitive pressure as affordability considerations and natural product positioning shape purchasing decisions. Concurrently, over-the-counter-focused international brands including Neutrogena and acne treatment systems are expanding market presence, supported by rising self-care trends and widespread utilisation of active ingredients including benzoyl peroxide and salicylic acid. This combination of growing local herbal brands and robust multinational over-the-counter players is reshaping competitive dynamics, advancing the market toward more accessible, natural, and self-medication-oriented solutions.
Frequently Asked Questions
Related Report
1. Market Segmentation
1.1. Research Scope
1.2. Research Methodology
1.3. Definitions and Assumptions
2. Executive Summary
3. Kenya Dermatologicals Market Policies, Regulations, and Standards
4. Kenya Dermatologicals Market Dynamics
4.1. Growth Factors
4.2. Challenges
4.3. Trends
4.4. Opportunities
5. Kenya Dermatologicals Market Statistics, 2022-2032F
5.1. Market Size & Growth Outlook
5.1.1.By Revenues in USD Million
5.2. Market Segmentation & Growth Outlook
5.2.1.By Category
5.2.1.1. Medicated Shampoos- Market Insights and Forecast 2022-2032, USD Million
5.2.1.2. Topical Antifungals- Market Insights and Forecast 2022-2032, USD Million
5.2.1.3. Vaginal Antifungals- Market Insights and Forecast 2022-2032, USD Million
5.2.1.4. Hair Loss Treatments- Market Insights and Forecast 2022-2032, USD Million
5.2.1.5. Nappy (Diaper) Rash Treatments- Market Insights and Forecast 2022-2032, USD Million
5.2.1.6. Antiparasitics/Lice (Head and Body) Treatments- Market Insights and Forecast 2022-2032, USD Million
5.2.1.7. Antipruritics- Market Insights and Forecast 2022-2032, USD Million
5.2.1.8. Cold Sore Treatments- Market Insights and Forecast 2022-2032, USD Million
5.2.1.9. Haemorrhoid Treatments- Market Insights and Forecast 2022-2032, USD Million
5.2.1.10. Paediatric Dermatologicals- Market Insights and Forecast 2022-2032, USD Million
5.2.1.11. Topical Allergy Remedies/Antihistamines- Market Insights and Forecast 2022-2032, USD Million
5.2.1.12. Topical Germicidals/Antiseptics- Market Insights and Forecast 2022-2032, USD Million
5.2.2.By Dispensing Status
5.2.2.1. Prescription-based Drugs- Market Insights and Forecast 2022-2032, USD Million
5.2.2.2. Over-the-counter Drugs- Market Insights and Forecast 2022-2032, USD Million
5.2.3.By Route of Administration
5.2.3.1. Topical Administration- Market Insights and Forecast 2022-2032, USD Million
5.2.3.2. Oral Administration- Market Insights and Forecast 2022-2032, USD Million
5.2.3.3. Parenteral Administration- Market Insights and Forecast 2022-2032, USD Million
5.2.4.By Drug Type
5.2.4.1. Branded- Market Insights and Forecast 2022-2032, USD Million
5.2.4.2. Generics- Market Insights and Forecast 2022-2032, USD Million
5.2.5.By Skin Condition
5.2.5.1. Acne- Market Insights and Forecast 2022-2032, USD Million
5.2.5.2. Dermatitis- Market Insights and Forecast 2022-2032, USD Million
5.2.5.3. Psoriasis- Market Insights and Forecast 2022-2032, USD Million
5.2.5.4. Skin Cancer- Market Insights and Forecast 2022-2032, USD Million
5.2.5.5. Rosacea- Market Insights and Forecast 2022-2032, USD Million
5.2.5.6. Alopecia- Market Insights and Forecast 2022-2032, USD Million
5.2.5.7. Fungal Infections- Market Insights and Forecast 2022-2032, USD Million
5.2.5.8. Others- Market Insights and Forecast 2022-2032, USD Million
5.2.6.By End User
5.2.6.1. Hospitals- Market Insights and Forecast 2022-2032, USD Million
5.2.6.2. Cosmetic Centers- Market Insights and Forecast 2022-2032, USD Million
5.2.6.3. Dermatology Clinics- Market Insights and Forecast 2022-2032, USD Million
5.2.6.4. Homecare- Market Insights and Forecast 2022-2032, USD Million
5.2.6.5. Others- Market Insights and Forecast 2022-2032, USD Million
5.2.7.By Sales Channel
5.2.7.1. Retail Offline- Market Insights and Forecast 2022-2032, USD Million
5.2.7.2. Retail Online- Market Insights and Forecast 2022-2032, USD Million
5.2.8.By Competitors
5.2.8.1. Competition Characteristics
5.2.8.2. Market Share & Analysis
6. Kenya Medicated Shampoos Market Statistics, 2022-2032
6.1. Market Size & Growth Outlook
6.1.1.By Revenues in USD Million
6.2. Market Segmentation & Growth Outlook
6.2.1.By Dispensing Status- Market Insights and Forecast 2022-2032, USD Million
6.2.2.By Route of Administration- Market Insights and Forecast 2022-2032, USD Million
6.2.3.By Drug Type- Market Insights and Forecast 2022-2032, USD Million
6.2.4.By Skin Condition- Market Insights and Forecast 2022-2032, USD Million
6.2.5.By End User- Market Insights and Forecast 2022-2032, USD Million
6.2.6.By Sales Channel- Market Insights and Forecast 2022-2032, USD Million
7. Kenya Topical Antifungals Market Statistics, 2022-2032
7.1. Market Size & Growth Outlook
7.1.1.By Revenues in USD Million
7.2. Market Segmentation & Growth Outlook
7.2.1.By Dispensing Status- Market Insights and Forecast 2022-2032, USD Million
7.2.2.By Route of Administration- Market Insights and Forecast 2022-2032, USD Million
7.2.3.By Drug Type- Market Insights and Forecast 2022-2032, USD Million
7.2.4.By Skin Condition- Market Insights and Forecast 2022-2032, USD Million
7.2.5.By End User- Market Insights and Forecast 2022-2032, USD Million
7.2.6.By Sales Channel- Market Insights and Forecast 2022-2032, USD Million
8. Kenya Vaginal Antifungals Market Statistics, 2022-2032
8.1. Market Size & Growth Outlook
8.1.1.By Revenues in USD Million
8.2. Market Segmentation & Growth Outlook
8.2.1.By Dispensing Status- Market Insights and Forecast 2022-2032, USD Million
8.2.2.By Route of Administration- Market Insights and Forecast 2022-2032, USD Million
8.2.3.By Drug Type- Market Insights and Forecast 2022-2032, USD Million
8.2.4.By Skin Condition- Market Insights and Forecast 2022-2032, USD Million
8.2.5.By End User- Market Insights and Forecast 2022-2032, USD Million
8.2.6.By Sales Channel- Market Insights and Forecast 2022-2032, USD Million
9. Kenya Hair Loss Treatments Market Statistics, 2022-2032
9.1. Market Size & Growth Outlook
9.1.1.By Revenues in USD Million
9.2. Market Segmentation & Growth Outlook
9.2.1.By Dispensing Status- Market Insights and Forecast 2022-2032, USD Million
9.2.2.By Route of Administration- Market Insights and Forecast 2022-2032, USD Million
9.2.3.By Drug Type- Market Insights and Forecast 2022-2032, USD Million
9.2.4.By Skin Condition- Market Insights and Forecast 2022-2032, USD Million
9.2.5.By End User- Market Insights and Forecast 2022-2032, USD Million
9.2.6.By Sales Channel- Market Insights and Forecast 2022-2032, USD Million
10. Kenya Nappy (Diaper) Rash Treatments Market Statistics, 2022-2032
10.1. Market Size & Growth Outlook
10.1.1. By Revenues in USD Million
10.2. Market Segmentation & Growth Outlook
10.2.1. By Dispensing Status- Market Insights and Forecast 2022-2032, USD Million
10.2.2. By Route of Administration- Market Insights and Forecast 2022-2032, USD Million
10.2.3. By Drug Type- Market Insights and Forecast 2022-2032, USD Million
10.2.4. By Skin Condition- Market Insights and Forecast 2022-2032, USD Million
10.2.5. By End User- Market Insights and Forecast 2022-2032, USD Million
10.2.6. By Sales Channel- Market Insights and Forecast 2022-2032, USD Million
11. Kenya Antiparasitics/Lice (Head and Body) Treatments Market Statistics, 2022-2032
11.1. Market Size & Growth Outlook
11.1.1. By Revenues in USD Million
11.2. Market Segmentation & Growth Outlook
11.2.1. By Dispensing Status- Market Insights and Forecast 2022-2032, USD Million
11.2.2. By Route of Administration- Market Insights and Forecast 2022-2032, USD Million
11.2.3. By Drug Type- Market Insights and Forecast 2022-2032, USD Million
11.2.4. By Skin Condition- Market Insights and Forecast 2022-2032, USD Million
11.2.5. By End User- Market Insights and Forecast 2022-2032, USD Million
11.2.6. By Sales Channel- Market Insights and Forecast 2022-2032, USD Million
12. Kenya Antipruritics Market Statistics, 2022-2032
12.1. Market Size & Growth Outlook
12.1.1. By Revenues in USD Million
12.2. Market Segmentation & Growth Outlook
12.2.1. By Dispensing Status- Market Insights and Forecast 2022-2032, USD Million
12.2.2. By Route of Administration- Market Insights and Forecast 2022-2032, USD Million
12.2.3. By Drug Type- Market Insights and Forecast 2022-2032, USD Million
12.2.4. By Skin Condition- Market Insights and Forecast 2022-2032, USD Million
12.2.5. By End User- Market Insights and Forecast 2022-2032, USD Million
12.2.6. By Sales Channel- Market Insights and Forecast 2022-2032, USD Million
13. Kenya Cold Sore Treatments Market Statistics, 2022-2032
13.1. Market Size & Growth Outlook
13.1.1. By Revenues in USD Million
13.2. Market Segmentation & Growth Outlook
13.2.1. By Dispensing Status- Market Insights and Forecast 2022-2032, USD Million
13.2.2. By Route of Administration- Market Insights and Forecast 2022-2032, USD Million
13.2.3. By Drug Type- Market Insights and Forecast 2022-2032, USD Million
13.2.4. By Skin Condition- Market Insights and Forecast 2022-2032, USD Million
13.2.5. By End User- Market Insights and Forecast 2022-2032, USD Million
13.2.6. By Sales Channel- Market Insights and Forecast 2022-2032, USD Million
14. Kenya Haemorrhoid Treatments Market Statistics, 2022-2032
14.1. Market Size & Growth Outlook
14.1.1. By Revenues in USD Million
14.2. Market Segmentation & Growth Outlook
14.2.1. By Dispensing Status- Market Insights and Forecast 2022-2032, USD Million
14.2.2. By Route of Administration- Market Insights and Forecast 2022-2032, USD Million
14.2.3. By Drug Type- Market Insights and Forecast 2022-2032, USD Million
14.2.4. By Skin Condition- Market Insights and Forecast 2022-2032, USD Million
14.2.5. By End User- Market Insights and Forecast 2022-2032, USD Million
14.2.6. By Sales Channel- Market Insights and Forecast 2022-2032, USD Million
15. Kenya Paediatric Dermatologicals Market Statistics, 2022-2032
15.1. Market Size & Growth Outlook
15.1.1. By Revenues in USD Million
15.2. Market Segmentation & Growth Outlook
15.2.1. By Dispensing Status- Market Insights and Forecast 2022-2032, USD Million
15.2.2. By Route of Administration- Market Insights and Forecast 2022-2032, USD Million
15.2.3. By Drug Type- Market Insights and Forecast 2022-2032, USD Million
15.2.4. By Skin Condition- Market Insights and Forecast 2022-2032, USD Million
15.2.5. By End User- Market Insights and Forecast 2022-2032, USD Million
15.2.6. By Sales Channel- Market Insights and Forecast 2022-2032, USD Million
16. Kenya Topical Allergy Remedies/Antihistamines Market Statistics, 2022-2032
16.1. Market Size & Growth Outlook
16.1.1. By Revenues in USD Million
16.2. Market Segmentation & Growth Outlook
16.2.1. By Dispensing Status- Market Insights and Forecast 2022-2032, USD Million
16.2.2. By Route of Administration- Market Insights and Forecast 2022-2032, USD Million
16.2.3. By Drug Type- Market Insights and Forecast 2022-2032, USD Million
16.2.4. By Skin Condition- Market Insights and Forecast 2022-2032, USD Million
16.2.5. By End User- Market Insights and Forecast 2022-2032, USD Million
16.2.6. By Sales Channel- Market Insights and Forecast 2022-2032, USD Million
17. Kenya Topical Germicidals/Antiseptics Market Statistics, 2022-2032
17.1. Market Size & Growth Outlook
17.1.1. By Revenues in USD Million
17.2. Market Segmentation & Growth Outlook
17.2.1. By Dispensing Status- Market Insights and Forecast 2022-2032, USD Million
17.2.2. By Route of Administration- Market Insights and Forecast 2022-2032, USD Million
17.2.3. By Drug Type- Market Insights and Forecast 2022-2032, USD Million
17.2.4. By Skin Condition- Market Insights and Forecast 2022-2032, USD Million
17.2.5. By End User- Market Insights and Forecast 2022-2032, USD Million
17.2.6. By Sales Channel- Market Insights and Forecast 2022-2032, USD Million
18. Competitive Outlook
18.1. Company Profiles
18.1.1. Glenmark Pharmaceuticals (K) Ltd
18.1.1.1. Business Description
18.1.1.2. Product Portfolio
18.1.1.3. Collaborations & Alliances
18.1.1.4. Recent Developments
18.1.1.5. Financial Details
18.1.1.6. Others
18.1.2. Regal Pharmaceuticals Ltd
18.1.2.1. Business Description
18.1.2.2. Product Portfolio
18.1.2.3. Collaborations & Alliances
18.1.2.4. Recent Developments
18.1.2.5. Financial Details
18.1.2.6. Others
18.1.3. Bulk Medicals Ltd
18.1.3.1. Business Description
18.1.3.2. Product Portfolio
18.1.3.3. Collaborations & Alliances
18.1.3.4. Recent Developments
18.1.3.5. Financial Details
18.1.3.6. Others
18.1.4. Pharmaceutical Mfg Co Kenya
18.1.4.1. Business Description
18.1.4.2. Product Portfolio
18.1.4.3. Collaborations & Alliances
18.1.4.4. Recent Developments
18.1.4.5. Financial Details
18.1.4.6. Others
18.1.5. Cosmos Ltd
18.1.5.1. Business Description
18.1.5.2. Product Portfolio
18.1.5.3. Collaborations & Alliances
18.1.5.4. Recent Developments
18.1.5.5. Financial Details
18.1.5.6. Others
18.1.6. Bayer East Africa Ltd
18.1.6.1. Business Description
18.1.6.2. Product Portfolio
18.1.6.3. Collaborations & Alliances
18.1.6.4. Recent Developments
18.1.6.5. Financial Details
18.1.6.6. Others
18.1.7. Meditech International (Pvt) Ltd
18.1.7.1. Business Description
18.1.7.2. Product Portfolio
18.1.7.3. Collaborations & Alliances
18.1.7.4. Recent Developments
18.1.7.5. Financial Details
18.1.7.6. Others
18.1.8. LEO Pharma LAMEA
18.1.8.1. Business Description
18.1.8.2. Product Portfolio
18.1.8.3. Collaborations & Alliances
18.1.8.4. Recent Developments
18.1.8.5. Financial Details
18.1.8.6. Others
18.1.9. Thornton & Ross Ltd
18.1.9.1. Business Description
18.1.9.2. Product Portfolio
18.1.9.3. Collaborations & Alliances
18.1.9.4. Recent Developments
18.1.9.5. Financial Details
18.1.9.6. Others
18.1.10. Elys Chemicals Ltd
18.1.10.1.Business Description
18.1.10.2.Product Portfolio
18.1.10.3.Collaborations & Alliances
18.1.10.4.Recent Developments
18.1.10.5.Financial Details
18.1.10.6.Others
19. Disclaimer
| Segment | Sub-Segment |
|---|---|
| By Category |
|
| By Dispensing Status |
|
| By Route of Administration |
|
| By Drug Type |
|
| By Skin Condition |
|
| By End User |
|
| By Sales Channel |
|
Research Methodology
This study followed a structured approach comprising four key phases to assess the size and scope of the electro-oxidation market. The process began with thorough secondary research to collect data on the target market, related markets, and broader industry context. These findings, along with preliminary assumptions and estimates, were then validated through extensive primary research involving industry experts from across the value chain. To calculate the overall market size, both top-down and bottom-up methodologies were employed. Finally, market segmentation and data triangulation techniques were applied to refine and validate segment-level estimations.
Secondary Research
The secondary research phase involved gathering data from a wide range of credible and published sources. This step helped in identifying industry trends, defining market segmentation, and understanding the market landscape and value chain.
Sources consulted during this phase included:
- Company annual reports, investor presentations, and press releases
- Industry white papers and certified publications
- Trade directories and market-recognized databases
- Articles from authoritative authors and reputable journals
- Gold and silver standard websites
Secondary research was critical in mapping out the industry's value chain and monetary flow, identifying key market segments, understanding regional variations, and tracking significant industry developments.
Other key sources:
- Financial disclosures
- Industry associations and trade bodies
- News outlets and business magazines
- Academic journals and research studies
- Paid industry databases
Primary Research
To validate secondary data and gain deeper market insights, primary research was conducted with key stakeholders across both the supply and demand sides of the market.
On the demand side, participants included decision-makers and influencers from end-user industries—such as CIOs, CTOs, and CSOs—who provided first-hand perspectives on market needs, product usage, and future expectations.
On the supply side, interviews were conducted with manufacturers, industry associations, and institutional participants to gather insights into current offerings, product pipelines, and market challenges.
Primary interviews provided critical inputs such as:
- Market size and revenue data
- Product and service breakdowns
- Market forecasts
- Regional and application-specific trends
Stakeholders consulted included:
- Leading OEM and solution providers
- Channel and distribution partners
- End users across various applications
- Independent consultants and industry specialists
Market Size Estimation and Data Triangulation
- Identifying Key Market Participants (Secondary Research)
- Goal: To identify the major players or companies in the target market. This typically involves using publicly available data sources such as industry reports, market research publications, and financial statements of companies.
- Tools: Reports from firms like Gartner, Forrester, Euromonitor, Statista, IBISWorld, and others. Public financial statements, news articles, and press releases from top market players.
- Extracting Earnings of Key Market Participants
- Goal: To estimate the earnings generated from the product or service being analyzed. This step helps in understanding the revenue potential of each market player in a specific geography.
- Methods: Earnings data can be gathered from:
- Publicly available financial reports (for listed companies).
- Interviews and primary data sources from professionals, such as Directors, VPs, SVPs, etc. This is especially useful for understanding more nuanced, internal data that isn't publicly disclosed.
- Annual reports and investor presentations of key players.
- Data Collation and Development of a Relevant Data Model
- Goal: To collate inputs from both primary and secondary sources into a structured, data-driven model for market estimation. This model will incorporate key market KPIs and any independent variables relevant to the market.
- Key KPIs: These could include:
- Market size, growth rate, and demand drivers.
- Industry-specific metrics like market share, average revenue per customer (ARPC), or average deal size.
- External variables, such as economic growth rates, inflation rates, or commodity prices, that could affect the market.
- Data Modeling: Based on this data, the market forecasts are developed for the next 5 years. A combination of trend analysis, scenario modeling, and statistical regression might be used to generate projections.
- Scenario Analysis
- Goal: To test different assumptions and validate how sensitive the market is to changes in key variables (e.g., market demand, regulatory changes, technological disruptions).
- Types of Scenarios:
- Base Case: Based on current assumptions and historical data.
- Best-Case Scenario: Assuming favorable market conditions, regulatory environments, and technological advancements.
- Worst-Case Scenario: Accounting for adverse factors, such as economic downturns, stricter regulations, or unexpected disruptions.


