US Water Pump Market Report: Trends, Growth and Forecast (2026-2032)
By Pump Type (Centrifugal Pumps, Positive Displacement Pump), By End User (Oil & Gas, Power, Residential, Agriculture & Irrigation, Commercial Building, HVAC, Chemical, Water & Wastewater, Food & Beverage, Others) ... Read more
|
Major Players
|
US Water Pump Market Statistics and Insights, 2026
- Market Size Statistics
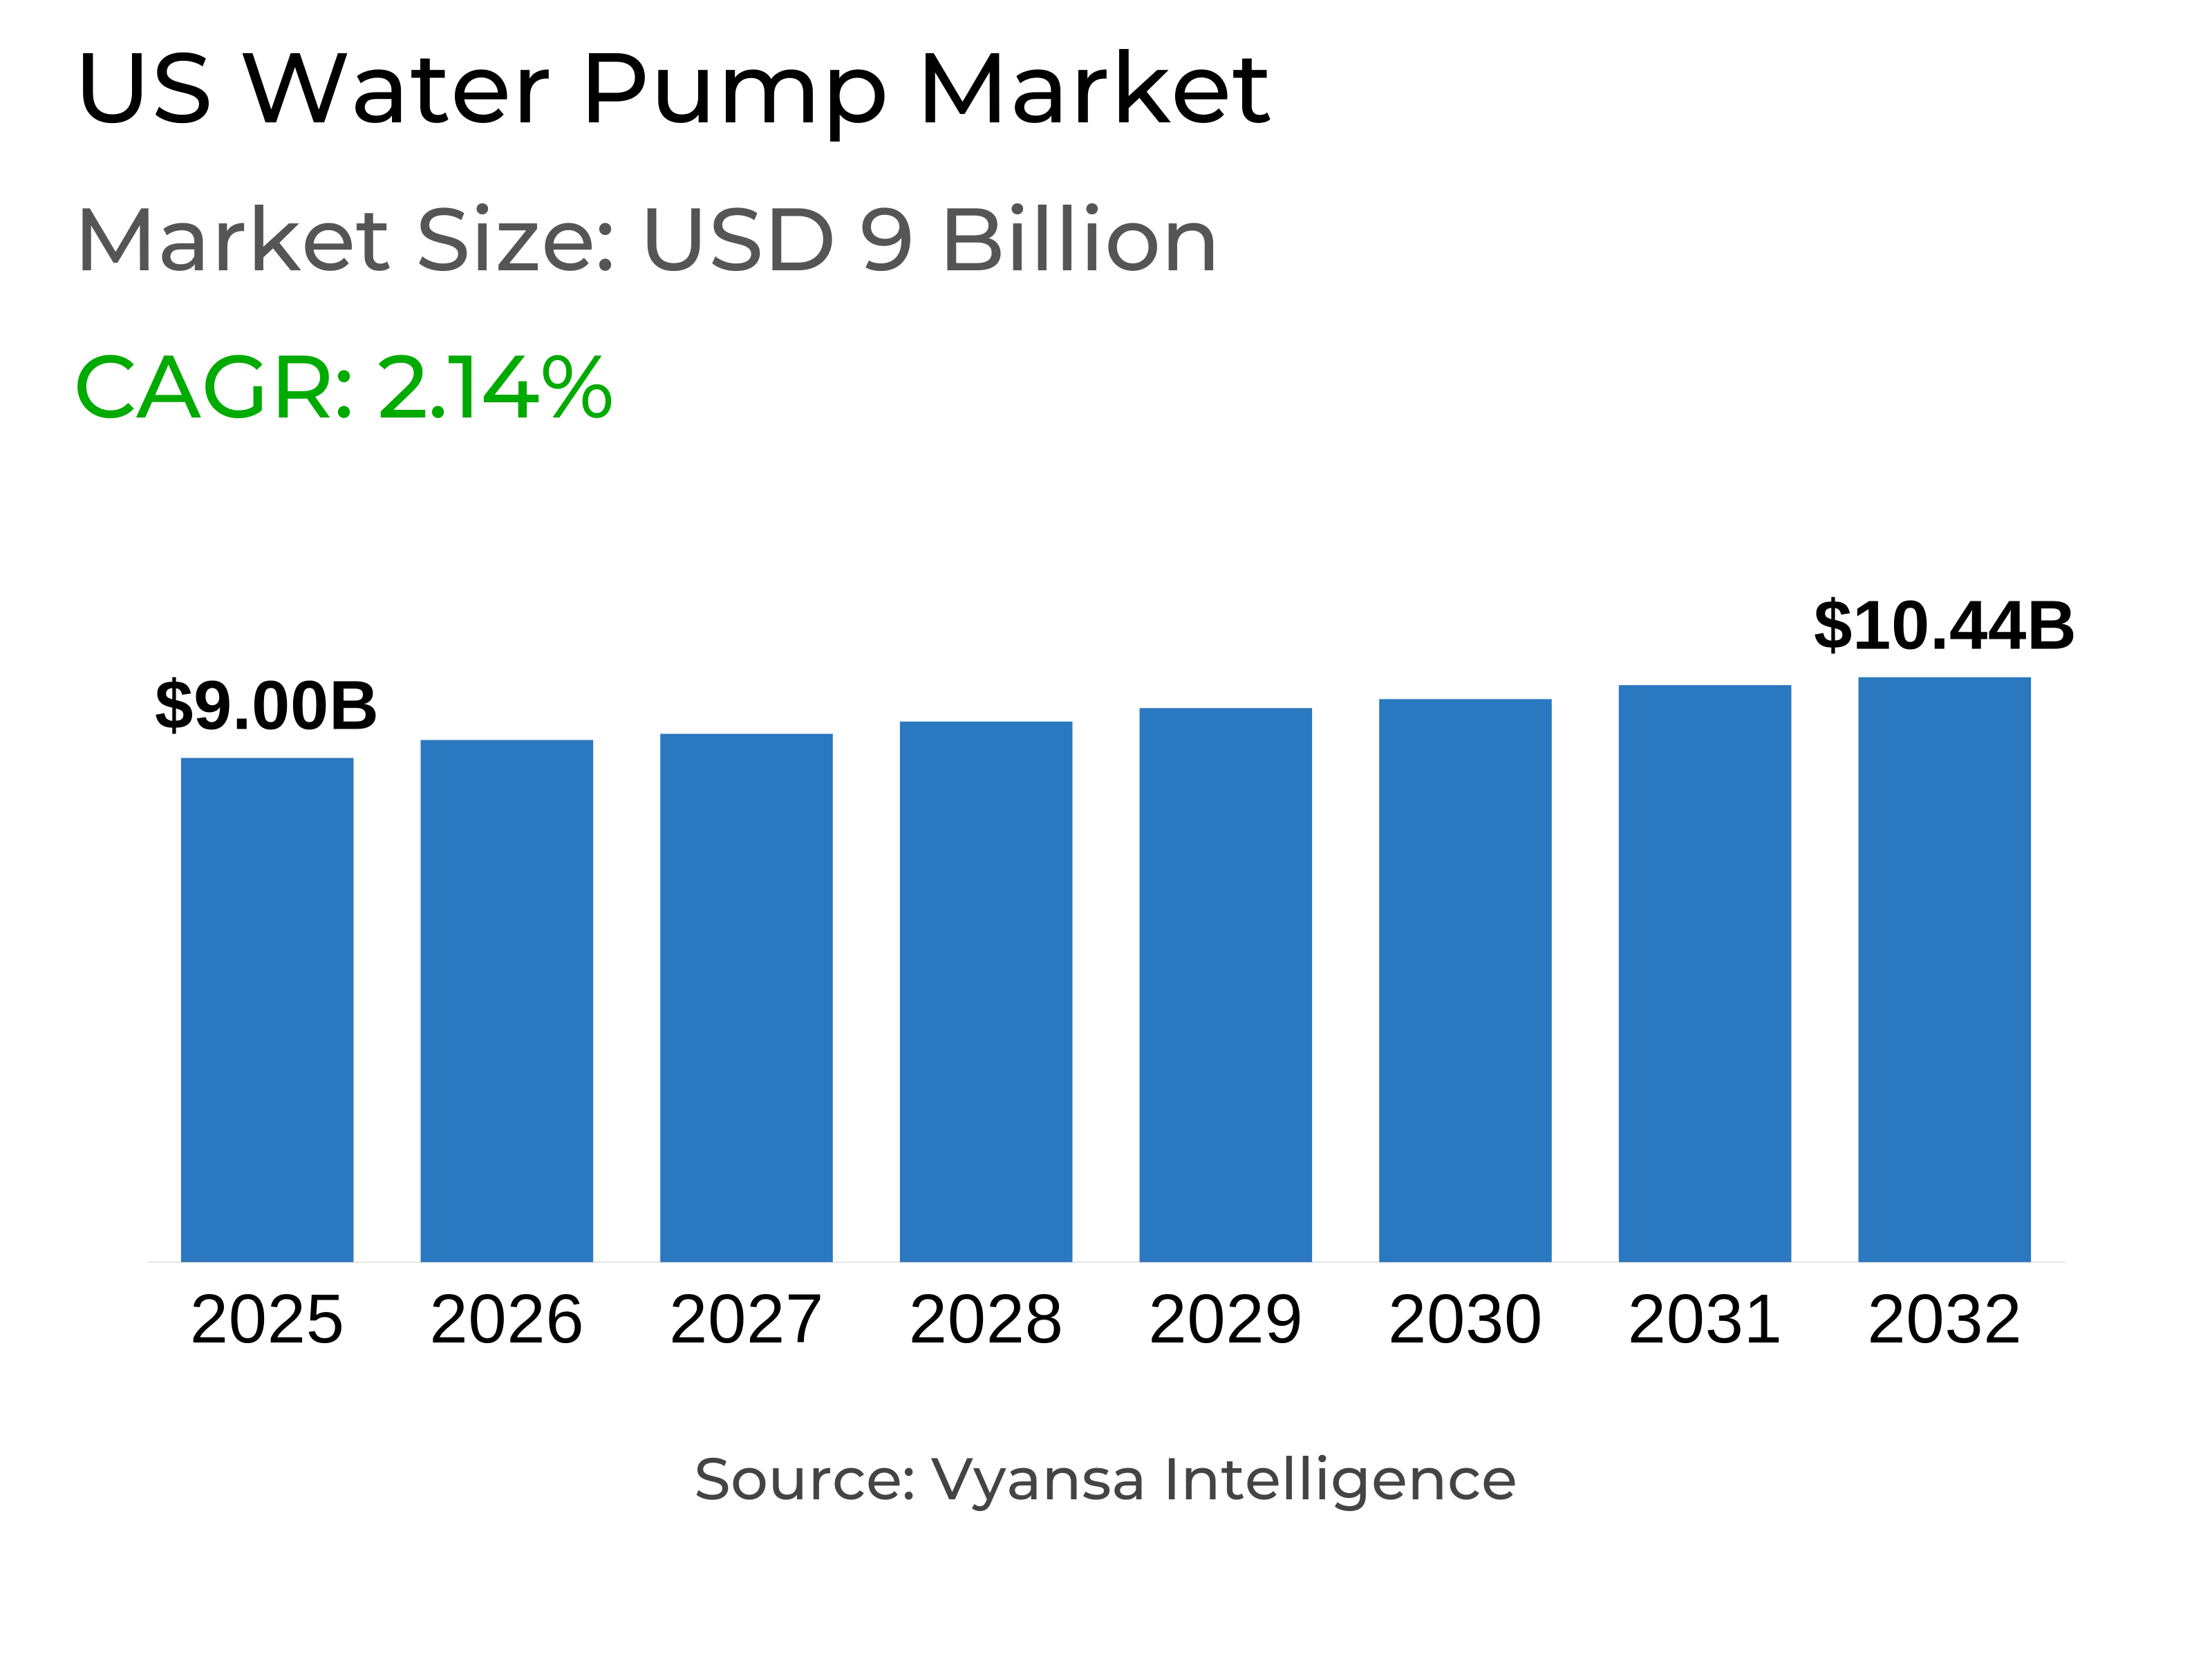
- Water Pump in US is estimated at $ 9 Billion.
- The market size is expected to grow to $ 10.44 Billion by 2032.
- Market to register a CAGR of around 2.14% during 2026-32.
- Pump Type Segment
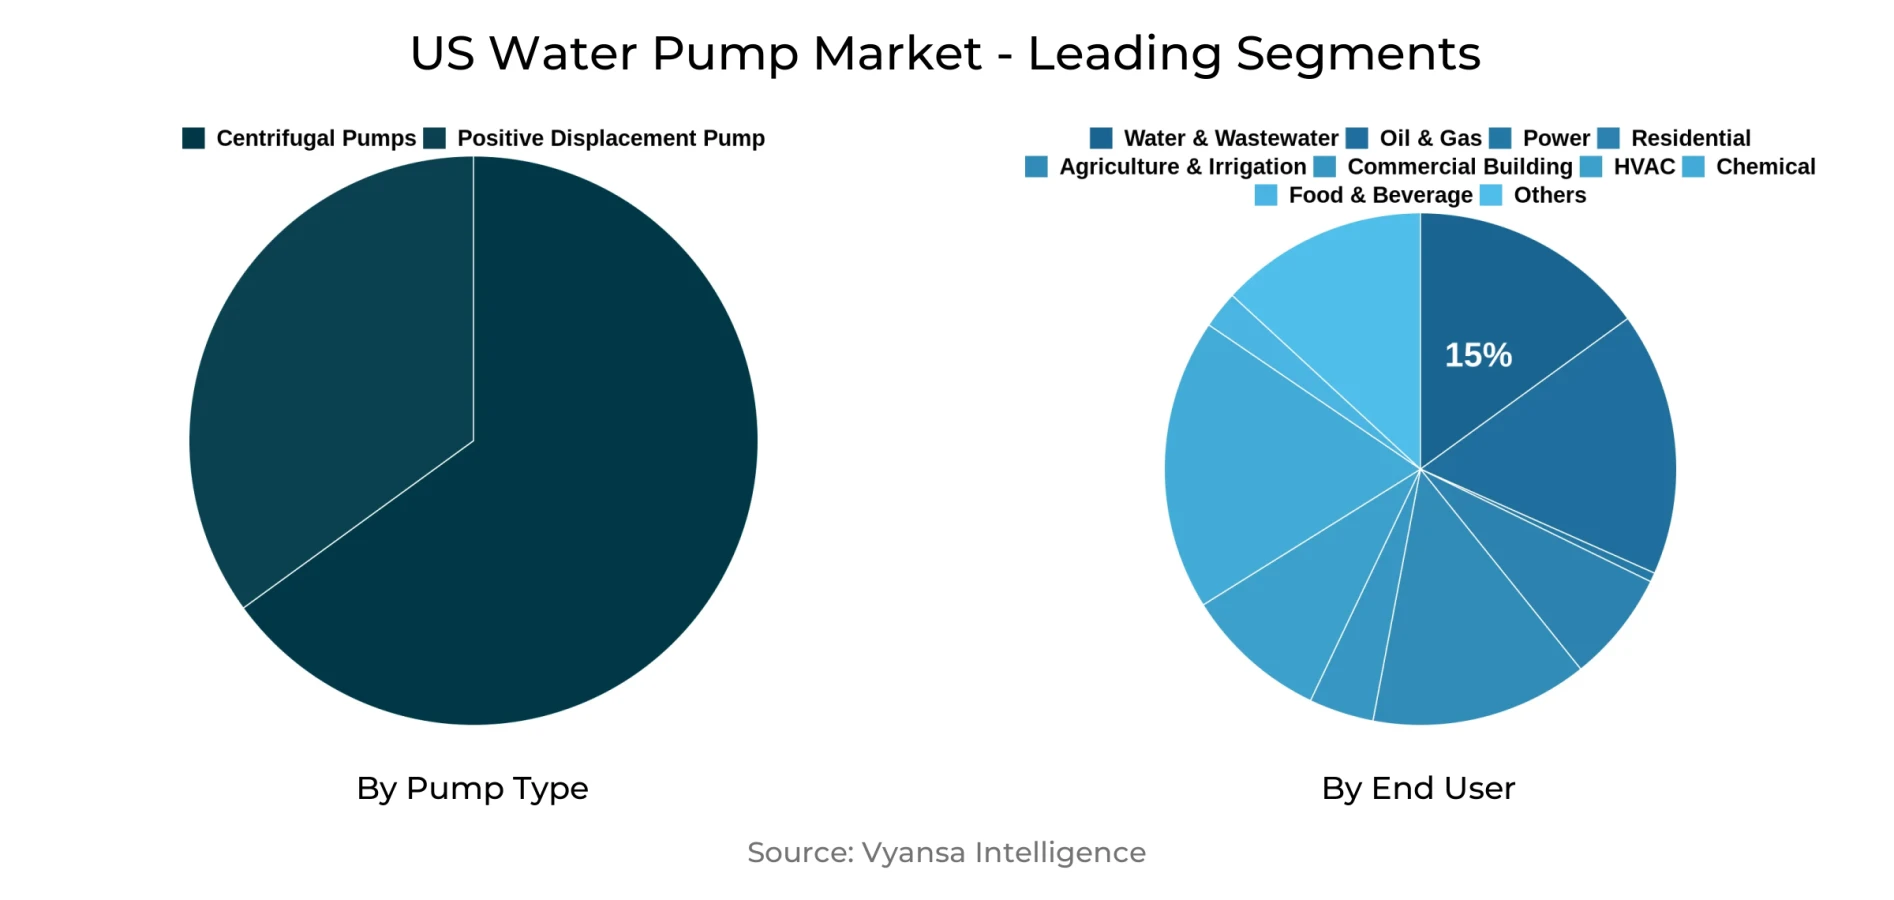
- Centrifugal Pumps continues to dominate the market.
- Competition
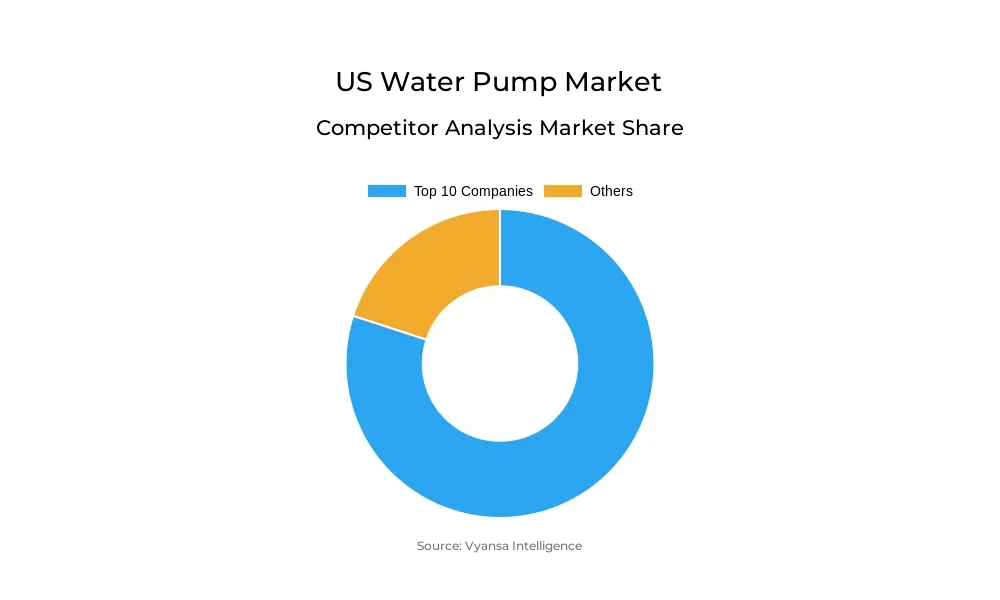
- More than 15 companies are actively engaged in producing Water Pump in US.
- Top 10 companies acquired the maximum share of the market.
- Pedrollo S.p.A., Pleuger Industries, SFA Group, Franklin Electric Co., Inc., Grundfos Holding A/S etc., are few of the top companies.
- End User
- Water & Wastewater grabbed 15% of the market.
US Water Pump Market Outlook
The U.S. water pump market, worth approximately $9 billion, is anticipated to grow consistently to reach $10.44 billion by 2032. Urbanization, upgradation of infrastructure, and increasing need for efficient, energy-saving pumping equipment are driving growth. Electric and smart pumps are becoming popular with demand for sustainable management of water because they save energy, are eco-friendly, and can be integrated with digital technologies such as IoT.
Although the market is ready to grow, obstacles like high initial costs, compliance with regulatory requirements, and supply chain issues present stumbling blocks. Sophisticated pumps tend to involve large capital expenditures to install and maintain, slowing down adoption by smaller customers. Stringent environmental requirements also increase production costs for manufacturers, so affordability is a balancing factor in future development.
Among the end customers, Water & Wastewater is the largest with a 15% market share, propelled by steady investment in municipal water treatment and sewerage networks. This segment requires high-capacity, dependable pumps to maintain public health and support regulatory requirements. Agriculture & Irrigation, however, is the growth leader, with increasing demand for efficient irrigation systems to maximize water utilization and increase agricultural output.
The U.S. water pump market also exemplifies the competitive environment, with over 15 firms in active presence, and the top 10 holding the highest share. The players are emphasizing creating sophisticated, sustainable, and IoT-based pumps to keep up with the sustainability wave as well as regulatory compliance. With digitalization and expansion of infrastructure gaining momentum, the industry is slated for sustained and innovative development until 2032.
US Water Pump Market Growth Driver
Increasing Adoption of Energy-Efficient and Smart Pump Technologies
Infrastructure development and urbanization in the U.S. are key factors driving the demand for advanced water pumps. The growing need for efficient water management in industries like agriculture, oil and gas, and municipal water systems pushes adoption of energy-efficient and intelligent pumping solutions. Electric pumps lead the market due to their environmental benefits and energy savings, attracting a large share of industrial and municipal applications. The integration of IoT technology in pumps enables real-time monitoring and remote management, which improves operational efficiency and reduces costs.
Environmental regulations also play an important role, encouraging manufacturers to develop pumps that use less energy and emit fewer pollutants. According to Persistence Market Research, electric pumps hold around 63.9% market share in North America, reflecting a strong trend towards sustainable pumping solutions. These drivers collectively fuel the growth of the water pump market across the U.S.
US Water Pump Market Challenge
High Initial Costs and Regulatory Compliance Pose Significant Challenges
Despite strong demand, the U.S. water pump market faces challenges such as high initial installation and maintenance costs. The complexity of advanced energy-efficient and smart pumps adds to operational expenses, making it difficult for smaller users to adopt these technologies quickly. Supply chain disruptions also affect the availability and cost of advanced pump components.
Moreover, stringent regulatory compliance with environmental standards imposed by agencies like the EPA increases development expenses for manufacturers. These regulations require pumps to meet high efficiency and low emission benchmarks, mandating costly research and design adjustments. Fluctuating energy and raw material prices further strain manufacturer profitability. These hurdles slow the market's pace of growth and require innovation to balance cost and compliance effectively.
Unlock Market Intelligence
Explore the market potential with our data-driven report
US Water Pump Market Trend
Shift Toward Sustainable and IoT-Enabled Pumping Systems
The U.S. water pump market currently follows a strong trend of sustainability and digital transformation. There is an increasing emphasis on eco-friendly pumps powered by renewable energy sources like solar and wind, significantly reducing the environmental footprint of water management systems. Integration of IoT technologies allows operators to monitor pumps remotely, predict maintenance needs, and optimize water usage, reducing waste and costs.
These smart technologies are becoming standard, with many industrial and municipal users adopting automated systems for better resource management. As environmental awareness grows, manufacturers continue to invest in pump designs that align with sustainability initiatives. This digital transition supports more efficient operations and regulatory compliance, reflecting a shift to next-generation pumping solutions.
US Water Pump Market Opportunity
Expanding Infrastructure and Water Treatment Projects Offer Growth Opportunities
Investment in water and wastewater infrastructure in the U.S. presents vast growth opportunities. Federal and state government initiatives focus heavily on upgrading aging water systems to improve water quality and availability. For instance, EPA funding programs target wastewater treatment facility modernization, requiring reliable and energy-efficient pumps.
Additionally, rising industrial activities in sectors such as oil and gas, agriculture, and manufacturing increase demand for advanced water pumps to manage fluid handling and processing. Companies developing smart, automated, and energy-saving pumps stand to benefit from this expanding infrastructure landscape. The increasing urgency to address water scarcity and improve sustainability further boosts opportunity for innovative pump technologies
| Report Coverage | Details |
|---|---|
| Market Forecast | 2026-32 |
| USD Value 2025 | $ 9 Billion |
| USD Value 2032 | $ 10.44 Billion |
| CAGR 2026-2032 | 2.14% |
| Largest Category | Centrifugal Pumps segment leads the market |
| Top Drivers | Increasing Adoption of Energy-Efficient and Smart Pump Technologies |
| Top Challenges | High Initial Costs and Regulatory Compliance Pose Significant Challenges |
| Top Trends | Shift Toward Sustainable and IoT-Enabled Pumping Systems |
| Top Opportunities | Expanding Infrastructure and Water Treatment Projects Offer Growth Opportunities |
| Key Players | Pedrollo S.p.A., Pleuger Industries, SFA Group, Franklin Electric Co., Inc., Grundfos Holding A/S, Wilo SE, Sulzer Ltd., ITT Goulds Pumps Inc., Kirloskar Brothers Ltd., Flowserve Corporation and Others. |
Unlock Market Intelligence
Explore the market potential with our data-driven report
US Water Pump Market Segmentation Analysis
By Pump Type
- Centrifugal Pumps
- Positive Displacement Pump
The most dominant segment in terms of market share under pump type in the U.S. water pump market is the centrifugal pump segment. Centrifugal pumps remain the best in terms of efficiency over a broad spectrum of flow rates and pressures. They are simpler to install, maintain, and couple with existing infrastructures than positive displacement pumps. This simplicity of operation and reliable performance results in centrifugal pumps being very appealing in uses like water treatment, industrial processing, and building services.
Their lower energy usage and easier design further enable broad-based adoption in municipal and industrial applications. The centrifugal pump category has a commanding lead, spurred by demand for affordable and dependable pumping solutions. Its leadership is further enhanced by ongoing innovation in pump design that enhances energy efficiency and operating durability.
By End User
- Oil & Gas
- Power
- Residential
- Agriculture & Irrigation
- Commercial Building
- HVAC
- Chemical
- Water & Wastewater
- Food & Beverage
- Others
Among end-user segments, the water and wastewater sector grabs the highest share in the U.S. water pump market. This segment accounts for about 15% of the market, reflecting significant investments by municipalities and industries in water treatment and sewage management infrastructure. Pumps in this segment are crucial for efficient conveyance and processing of water to ensure public health and environmental compliance.
Municipal water and wastewater systems require robust, energy-efficient pumps to handle large volumes while minimizing operational costs. The rise in infrastructure modernization projects and stricter regulations on water quality amplify the demand from this sector. This end-user segment's prominence is due to the essential nature of water management and ongoing government support for sustainable water infrastructure.
Top Companies in US Water Pump Market
The top companies operating in the market include Pedrollo S.p.A., Pleuger Industries, SFA Group, Franklin Electric Co., Inc., Grundfos Holding A/S, Wilo SE, Sulzer Ltd., ITT Goulds Pumps Inc., Kirloskar Brothers Ltd., Flowserve Corporation, etc., are the top players operating in the US Water Pump Market.
Frequently Asked Questions
Related Report
1. Market Segmentation
1.1. Research Scope
1.2. Research Methodology
1.3. Definitions and Assumptions
2. Executive Summary
3. US Water Pump Market Policies, Regulations, and Standards
4. US Water Pump Market Dynamics
4.1. Growth Factors
4.2. Challenges
4.3. Trends
4.4. Opportunities
5. US Water Pump Market Statistics, 2022-2032F
5.1. Market Size & Growth Outlook
5.1.1.By Revenues in US$ Million
5.2. Market Segmentation & Growth Outlook
5.2.1.By Pump Type
5.2.1.1. Centrifugal Pumps- Market Insights and Forecast 2022-2032, USD Million
5.2.1.1.1. Overhung Pumps- Market Insights and Forecast 2022-2032, USD Million
5.2.1.1.1.1. Vertical Line- Market Insights and Forecast 2022-2032, USD Million
5.2.1.1.1.2. Horizontal End Suction- Market Insights and Forecast 2022-2032, USD Million
5.2.1.1.2. Split Case Pumps- Market Insights and Forecast 2022-2032, USD Million
5.2.1.1.2.1. Single/Two Stage- Market Insights and Forecast 2022-2032, USD Million
5.2.1.1.2.2. Multi Stage- Market Insights and Forecast 2022-2032, USD Million
5.2.1.1.3. Vertical Pumps- Market Insights and Forecast 2022-2032, USD Million
5.2.1.1.3.1. Turbine- Market Insights and Forecast 2022-2032, USD Million
5.2.1.1.3.2. Axial- Market Insights and Forecast 2022-2032, USD Million
5.2.1.1.3.3. Mixed Flow- Market Insights and Forecast 2022-2032, USD Million
5.2.1.1.4. Submersible Pumps- Market Insights and Forecast 2022-2032, USD Million
5.2.1.1.4.1. Solid Handling- Market Insights and Forecast 2022-2032, USD Million
5.2.1.1.4.2. Non-Solid Handling- Market Insights and Forecast 2022-2032, USD Million
5.2.1.2. Positive Displacement Pump- Market Insights and Forecast 2022-2032, USD Million
5.2.1.2.1. Diaphragm Pumps- Market Insights and Forecast 2022-2032, USD Million
5.2.1.2.2. Piston Pumps- Market Insights and Forecast 2022-2032, USD Million
5.2.1.2.3. Gear Pumps- Market Insights and Forecast 2022-2032, USD Million
5.2.1.2.4. Lobe Pumps- Market Insights and Forecast 2022-2032, USD Million
5.2.1.2.5. Progressive Cavity Pumps- Market Insights and Forecast 2022-2032, USD Million
5.2.1.2.6. Screw Pumps- Market Insights and Forecast 2022-2032, USD Million
5.2.1.2.7. Vane Pumps- Market Insights and Forecast 2022-2032, USD Million
5.2.1.2.8. Peristaltic Pumps- Market Insights and Forecast 2022-2032, USD Million
5.2.1.2.9. Others- Market Insights and Forecast 2022-2032, USD Million
5.2.2.By End User
5.2.2.1. Oil & Gas- Market Insights and Forecast 2022-2032, USD Million
5.2.2.2. Power- Market Insights and Forecast 2022-2032, USD Million
5.2.2.3. Residential- Market Insights and Forecast 2022-2032, USD Million
5.2.2.4. Agriculture & Irrigation- Market Insights and Forecast 2022-2032, USD Million
5.2.2.5. Commercial Building- Market Insights and Forecast 2022-2032, USD Million
5.2.2.6. HVAC- Market Insights and Forecast 2022-2032, USD Million
5.2.2.7. Chemical- Market Insights and Forecast 2022-2032, USD Million
5.2.2.8. Water & Wastewater- Market Insights and Forecast 2022-2032, USD Million
5.2.2.9. Food & Beverage- Market Insights and Forecast 2022-2032, USD Million
5.2.2.10. Others- Market Insights and Forecast 2022-2032, USD Million
5.2.3.By Competitors
5.2.3.1. Competition Characteristics
5.2.3.2. Market Share & Analysis
6. US Centrifugal Pump Water Pump Market Statistics, 2022-2032F
6.1. Market Size & Growth Outlook
6.1.1.By Revenues in US$ Million
6.2. Market Segmentation & Growth Outlook
6.2.1.By Pump Type- Market Insights and Forecast 2022-2032, USD Million
6.2.2.By End User- Market Insights and Forecast 2022-2032, USD Million
7. US Positive Displacement Pump Water Pump Market Statistics, 2022-2032F
7.1. Market Size & Growth Outlook
7.1.1.By Revenues in US$ Million
7.2. Market Segmentation & Growth Outlook
7.2.1.By Pump Type- Market Insights and Forecast 2022-2032, USD Million
7.2.2.By End User- Market Insights and Forecast 2022-2032, USD Million
8. Competitive Outlook
8.1. Company Profiles
8.1.1.Flowserve
8.1.1.1. Business Description
8.1.1.2. Product Portfolio
8.1.1.3. Collaborations & Alliances
8.1.1.4. Recent Developments
8.1.1.5. Financial Details
8.1.1.6. Others
8.1.2.Sulzer AG
8.1.2.1. Business Description
8.1.2.2. Product Portfolio
8.1.2.3. Collaborations & Alliances
8.1.2.4. Recent Developments
8.1.2.5. Financial Details
8.1.2.6. Others
8.1.3.KSB
8.1.3.1. Business Description
8.1.3.2. Product Portfolio
8.1.3.3. Collaborations & Alliances
8.1.3.4. Recent Developments
8.1.3.5. Financial Details
8.1.3.6. Others
8.1.4.Xylem
8.1.4.1. Business Description
8.1.4.2. Product Portfolio
8.1.4.3. Collaborations & Alliances
8.1.4.4. Recent Developments
8.1.4.5. Financial Details
8.1.4.6. Others
8.1.5.Grundfos
8.1.5.1. Business Description
8.1.5.2. Product Portfolio
8.1.5.3. Collaborations & Alliances
8.1.5.4. Recent Developments
8.1.5.5. Financial Details
8.1.5.6. Others
8.1.6.ITT
8.1.6.1. Business Description
8.1.6.2. Product Portfolio
8.1.6.3. Collaborations & Alliances
8.1.6.4. Recent Developments
8.1.6.5. Financial Details
8.1.6.6. Others
8.1.7.IDEX
8.1.7.1. Business Description
8.1.7.2. Product Portfolio
8.1.7.3. Collaborations & Alliances
8.1.7.4. Recent Developments
8.1.7.5. Financial Details
8.1.7.6. Others
8.1.8.Pentair Plc
8.1.8.1. Business Description
8.1.8.2. Product Portfolio
8.1.8.3. Collaborations & Alliances
8.1.8.4. Recent Developments
8.1.8.5. Financial Details
8.1.8.6. Others
8.1.9.Ebara
8.1.9.1. Business Description
8.1.9.2. Product Portfolio
8.1.9.3. Collaborations & Alliances
8.1.9.4. Recent Developments
8.1.9.5. Financial Details
8.1.9.6. Others
8.1.10. SPX Flow
8.1.10.1. Business Description
8.1.10.2. Product Portfolio
8.1.10.3. Collaborations & Alliances
8.1.10.4. Recent Developments
8.1.10.5. Financial Details
8.1.10.6. Others
9. Disclaimer
| Segment | Sub-Segment |
|---|---|
| By Pump Type |
|
| By End User |
|
Research Methodology
This study followed a structured approach comprising four key phases to assess the size and scope of the electro-oxidation market. The process began with thorough secondary research to collect data on the target market, related markets, and broader industry context. These findings, along with preliminary assumptions and estimates, were then validated through extensive primary research involving industry experts from across the value chain. To calculate the overall market size, both top-down and bottom-up methodologies were employed. Finally, market segmentation and data triangulation techniques were applied to refine and validate segment-level estimations.
Secondary Research
The secondary research phase involved gathering data from a wide range of credible and published sources. This step helped in identifying industry trends, defining market segmentation, and understanding the market landscape and value chain.
Sources consulted during this phase included:
- Company annual reports, investor presentations, and press releases
- Industry white papers and certified publications
- Trade directories and market-recognized databases
- Articles from authoritative authors and reputable journals
- Gold and silver standard websites
Secondary research was critical in mapping out the industry's value chain and monetary flow, identifying key market segments, understanding regional variations, and tracking significant industry developments.
Other key sources:
- Financial disclosures
- Industry associations and trade bodies
- News outlets and business magazines
- Academic journals and research studies
- Paid industry databases
Primary Research
To validate secondary data and gain deeper market insights, primary research was conducted with key stakeholders across both the supply and demand sides of the market.
On the demand side, participants included decision-makers and influencers from end-user industries—such as CIOs, CTOs, and CSOs—who provided first-hand perspectives on market needs, product usage, and future expectations.
On the supply side, interviews were conducted with manufacturers, industry associations, and institutional participants to gather insights into current offerings, product pipelines, and market challenges.
Primary interviews provided critical inputs such as:
- Market size and revenue data
- Product and service breakdowns
- Market forecasts
- Regional and application-specific trends
Stakeholders consulted included:
- Leading OEM and solution providers
- Channel and distribution partners
- End users across various applications
- Independent consultants and industry specialists
Market Size Estimation and Data Triangulation
- Identifying Key Market Participants (Secondary Research)
- Goal: To identify the major players or companies in the target market. This typically involves using publicly available data sources such as industry reports, market research publications, and financial statements of companies.
- Tools: Reports from firms like Gartner, Forrester, Euromonitor, Statista, IBISWorld, and others. Public financial statements, news articles, and press releases from top market players.
- Extracting Earnings of Key Market Participants
- Goal: To estimate the earnings generated from the product or service being analyzed. This step helps in understanding the revenue potential of each market player in a specific geography.
- Methods: Earnings data can be gathered from:
- Publicly available financial reports (for listed companies).
- Interviews and primary data sources from professionals, such as Directors, VPs, SVPs, etc. This is especially useful for understanding more nuanced, internal data that isn't publicly disclosed.
- Annual reports and investor presentations of key players.
- Data Collation and Development of a Relevant Data Model
- Goal: To collate inputs from both primary and secondary sources into a structured, data-driven model for market estimation. This model will incorporate key market KPIs and any independent variables relevant to the market.
- Key KPIs: These could include:
- Market size, growth rate, and demand drivers.
- Industry-specific metrics like market share, average revenue per customer (ARPC), or average deal size.
- External variables, such as economic growth rates, inflation rates, or commodity prices, that could affect the market.
- Data Modeling: Based on this data, the market forecasts are developed for the next 5 years. A combination of trend analysis, scenario modeling, and statistical regression might be used to generate projections.
- Scenario Analysis
- Goal: To test different assumptions and validate how sensitive the market is to changes in key variables (e.g., market demand, regulatory changes, technological disruptions).
- Types of Scenarios:
- Base Case: Based on current assumptions and historical data.
- Best-Case Scenario: Assuming favorable market conditions, regulatory environments, and technological advancements.
- Worst-Case Scenario: Accounting for adverse factors, such as economic downturns, stricter regulations, or unexpected disruptions.


