South America Positive Displacement Pump Market Report: Trends, Growth and Forecast (2026-2032)
By Pump Type (Reciprocating Pump (Piston, Plunger, Diaphragm), Rotary Pump (Gear, Screw, Lobe, Vane), Peristaltic Pump), By Pressure Rating (Up to 50 bar, 51 to 150 bar, Above 150 bar), By End-user Industry (Oil & Gas, Power Generation, Water & Wastewater, Chemical & Petrochemical, Food & Beverage, Pharmaceutical & Biotechnology, Mining & Minerals, Pulp & Paper, Others), By Country (Brazil, Argentina, Chile, Rest of South America) ... Read more
|
Major Players
|
South America Positive Displacement Pump Market Statistics and Insights, 2026
- Market Size Statistics
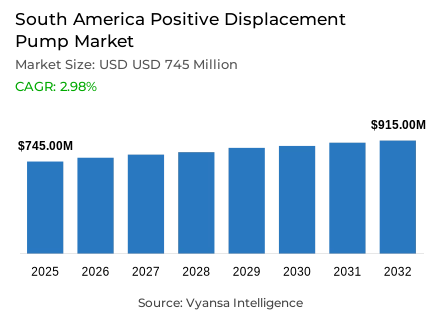
- South America positive displacement pump market is estimated at USD 745 million in 2025.
- The market size is expected to grow to USD 915 million by 2032.
- Market to register a cagr of around 2.98% during 2026-32.
- Pump Type Shares
- Rotary pump grabbed market share of 50%.
- Competition
- Positive displacement pump in South America is currently being catered to by more than 10 companies.
- Top 5 companies acquired around 50% of the market share.
- Schneider Motobombas; IMBIL; Bombas Leão; Grundfos Holding A/S; Flowserve Corporation etc., are few of the top companies.
- Pressure Rating
- Up to 50 bar grabbed 50% of the market.
- Country
- Brazil leads with a 40% share of the South America market.
South America Positive Displacement Pump Market Outlook
Positive displacement pumps market in South America is valued at USD 745 million in 2025 and USD 915 million in 2032 with a CAGR of about 2.98% per annum between 2026 and 2032. This consistent growth is an indication of long-term capital investments in water, sanitation, oil and gas infrastructure. Massive government and commercial investments are transforming hydraulic and industrial systems, creating a long-term demand base of pumps that provide dependable volumetric operation in essential applications like treatment plants, distribution systems, and energy transportation infrastructure.
The growth of the sector is still based on infrastructure expansion. Brazil is the key driver, as infrastructure investments are projected to reach R$ 259.3 billion in 2024, with the help of the Novo PAC program and a significant rise in sanitation expenditure since 2020. These programs are directly translated into the purchase of pumps to be used in municipal and industrial purposes. Argentina augments this trend with energy-based growth, where the expansion of production by the Vaca Muerta formation leads to long-term investment in pipelines and pumping systems needed to move hydrocarbons effectively over long distances.
Moreover, rotary pumps control the market with a share of about 50. Gear, screw, and progressive-cavity pumps are commonly used because of their ability to handle viscous, abrasive and high-reliability services in petroleum, chemical, and heavy-industrial processes. At the same time, pumps with a maximum pressure of 50 bar make up about half of the demand, which is due to the needs of municipal water supply, wastewater systems, and overall industrial processes where moderate pressure and cost-effectiveness are the main priorities.
Brazil dominates the South America positive displacement pump market with a 40% share, which is backed by its large population, diversified industry, and growing offshore and municipal infrastructure. Argentina is a specialized market associated with the development of shale oil and gas, and other countries play a role in specific investments in water, mining, and energy projects, maintaining a balanced regional perspective until 2032.

South America Positive Displacement Pump Market Growth Driver
Infrastructure Expansion Strengthening Regional Pump Demand
The hydraulic and industrial market infrastructure is transforming the South America positive displacement pump market with substantial public and private capital commitments, thus creating a long-term demand base in water, oil, and gas applications. Brazil is the main driver of growth, and overall infrastructure investment has reached R$ 259.3 billion in 2024, which is a 15% annual growth rate, most of which is privately funded. The Novo PAC programme, which includes over 23000 active projects, has hastened the construction of sanitation and water-security systems, which today serve 12 million people in the Northeast of Brazil. The doubling of sanitation investment in 2020-2024 shows the structural character of this growth, which is directly converted into the purchase of pumps for treatment plants, distribution networks, and sludge-handling systems that need to be reliable in volumetric performance.
To add to the momentum of Brazil, the infrastructure development in Argentina is becoming more and more production-oriented. The Vaca Muerta formation reached 550,881 barrels per day in September 2025, which is 30% more than the previous year. This trend requires the constant investment in pipelines, compression, and pumping facilities to deliver hydrocarbons in inland basins to export terminals and domestic demand centres. These developments combined make infrastructure expansion a sustainable demand driver up to 2032.
South America Positive Displacement Pump Market Challenge
Structural Financing Gaps Constraining Equipment Penetration
Despite observable capital inflows, endemic financing constraints still hinder full-scale modernization throughout the South America positive displacement pump market. The level of infrastructure investment is structurally inadequate compared to long-term needs, and Brazil invests only 2.2% of GDP in infrastructure in 2024, compared to an estimated requirement of more than 4%. This disconnect leads to staged or slow project implementation, especially at the municipal level where utilities find it difficult to justify initial investment in high-technology pumping systems even when the life-cycle efficiency is evident. The interest rates in the region are expected to be high in 2025-2026, which further limits the borrowing ability, reducing the pace at which specialised and more efficient pump technologies can be adopted.
These financial constraints are compounded by regulatory fragmentation. The varying federal, state, and municipal procurement systems create unequal technical standards, certification, and tender procedures in South American markets. This fragmentation raises compliance costs to suppliers and raises the overall cost of ownership to end users, and thus does not encourage standardised deployment across regions. Although privatisation efforts like the Sabesp deal in São Paulo bring in capital, dependency on private financing highlights lopsided modernisation trajectories that limit homogenous market penetration.
Unlock Market Intelligence
Explore the market potential with our data-driven report
South America Positive Displacement Pump Market Trend
Energy Sector Expansion Redefining Technical Requirements
The fast growth in unconventional and offshore energy generation is transforming technical specifications in the South America positive displacement pump market. The Vaca Muerta formation in Argentina contributed 66% of national oil production and 65% of gas production in 2025, thus creating demand of pumps that can work in high-pressure environments that are usually between 60 and 100 bar. These applications demand equipment designed to operate in abrasive, corrosive fluids and continuous-duty operation, thus hastening the need to design specialised submersible, multiphase and transfer pump designs specific to shale operations.
The offshore trend in Brazil supports this. By October 2025, national crude production had exceeded 4.0 million barrels per day, with pre-salt projects expected to hit 3.2 million barrels of oil equivalent daily by 2029. Deepwater production systems require stable pumping solutions in subsea boosting, pipeline transportation and export terminal. Such changing operating environments are forcing manufacturers to design beyond traditional municipal requirements, increasing technical complexity and value per installation.
South America Positive Displacement Pump Market Opportunity
Capital Mobilization Creating Long-Term Growth Visibility
Multilateral development banks are developing sustainable growth prospects in the South America positive displacement pump market through structured financing structures. The authorization of USD 9.7 billion in 52 regional operations in the fiscal year 2024 by the World Bank demonstrates the role of blended-finance in water, sanitation, energy and transport projects. These mechanisms minimize risk to the private investors and allow governments to maintain infrastructure pipelines, which enhances project continuity and equipment acquisition transparency.
The 20252029 pipeline of private infrastructure investment in Brazil amounts to R$ 372.3 billion, which is 63.4% higher than the earlier estimates. This level of committed capital allows equipment suppliers to make long-term capacity plans, develop regional service networks and negotiate volume-based supply contracts consistent with multi-year project schedules. These financing dynamics, coupled with regional economic-growth forecasts of about 2.9%, provide an evident growth opportunity in municipal, industrial and energy-related pumping applications up to 2032.
South America Positive Displacement Pump Market Country Analysis
By Country
- Brazil
- Argentina
- Chile
- Rest of South America
Brazil accounts for approximately 40% of the South America positive displacement pump market, reflecting its population scale, diversified industrial base, and sustained infrastructure modernization. Large metropolitan utilities, particularly in the São Paulo region serving around 22 million residents, generate consistent demand for municipal pumping equipment. Concurrently, Brazil’s energy sector expansion, with crude production exceeding 4.0 million barrels per day in late 2025, underpins demand for specialized pumps supporting offshore production, pipeline boosting, and export infrastructure.
Argentina represents the second-largest contributor, driven by concentrated demand linked to shale oil and gas development. Production from Vaca Muerta reached 550,881 barrels per day in September 2025, with projections indicating further growth, reinforcing the country’s role as a specialized equipment market. Chile, Peru, Colombia, and other regional economies collectively account for the remaining 20%, supported by water infrastructure upgrades, mining operations, and targeted energy investments.
Unlock Market Intelligence
Explore the market potential with our data-driven report
South America Positive Displacement Pump Market Segmentation Analysis
By Pump Type
- Reciprocating Pump
- Piston
- Plunger
- Diaphragm
- Rotary Pump
- Gear
- Screw
- Lobe
- Vane
- Peristaltic Pump
Rotary pumps hold the dominant position within the South America positive displacement pump market, accounting for approximately 50% of total demand in 2025. Gear, screw, and progressive cavity pumps are widely deployed in applications requiring precise flow control and efficient handling of viscous or abrasive fluids. Their prominence is particularly strong in petroleum extraction, chemical processing, and heavy industrial operations, where operating stability and tolerance to variable fluid characteristics are critical to maintaining system reliability and minimizing downtime for end users.
Beyond rotary designs, other positive displacement and centrifugal pump configurations serve complementary roles across the regional market. These technologies are commonly deployed in municipal water distribution, wastewater treatment, and desalination facilities where higher volumetric throughput and moderate pressure requirements are prioritized. While rotary pumps retain leadership due to their versatility and durability, the coexistence of multiple pump types reflects the diverse operating environments across South America’s infrastructure and industrial landscape.

By Pressure Rating
- Up to 50 bar
- 51 to 150 bar
- Above 150 bar
Pumps operating at pressure ratings up to 50 bar represent the largest segment of the South America positive displacement pump market, capturing roughly 50% of overall demand. This category aligns with the operating requirements of most municipal water supply networks, wastewater collection systems, and general industrial circulation processes. Moderate-pressure configurations offer a balance between efficiency, system safety, and cost control, making them the preferred choice for utilities and industrial end users seeking reliable performance without extensive reinforcement of pipelines or auxiliary infrastructure.
High-pressure systems above 50 bar form the secondary segment, driven primarily by energy and resource extraction activities. Unconventional oil and gas production in Argentina, pre-salt offshore developments in Brazil, and emerging mining applications generate concentrated demand for pumps rated between 60 and 150 bar or higher. Although smaller in volume, this segment commands higher unit values due to stringent material, sealing, and performance specifications, contributing disproportionately to overall market value growth.
Various Market Players in South America Positive Displacement Pump Market
The companies mentioned below are highly active in the South America positive displacement pump market, occupying a considerable portion of the market and shaping industry progress.
- Schneider Motobombas
- IMBIL
- Bombas Leão
- Grundfos Holding A/S
- Flowserve Corporation
- Sulzer Ltd.
- Xylem Inc.
- KSB SE & Co. KGaA
- NETZSCH Holding
- Metso
- Baker Hughes
- The Weir Group PLC
Market News & Updates
- Schneider Motobombas, 2025:
Schneider Motobombas released a comprehensive 2025 pump selection catalog featuring an expanded portfolio addressing diverse water and wastewater applications across South America, including single-stage centrifugal motors (MSA series), self-priming models (ASP-98 Versajet), stainless steel centrifugal motors (MCI), multistage horizontal configurations (BT4, ME-HI), specialized fire suppression pump series (BRAVA D/DV/E/EV, BCS series, LUP), and submersible models (SUB 2.5", 3", 4", 5") with detailed hydraulic performance curves and specifications. The company showcased complete pumping systems representing agricultural and industrial solutions at Agrishow 2025, demonstrating its commitment to serving South American water, wastewater, and agricultural sectors with integrated system offerings combining surface, submersible, submersible-mounted, and pressurization equipment engineered for regional irrigation, potable water capture, and livestock applications.
- Metso, 2025:
Metso announced a strategic partnership with Millennium Machinery Parts and Service Corp. in August 2025, significantly expanding its distribution and service infrastructure across the Caribbean and Latin America region. The alliance combines Metso's advanced equipment and global technology portfolio with Millennium's established local market expertise and customer support infrastructure across 17 territories including the Bahamas, Turks & Caicos, British Virgin Islands, US Virgin Islands, Dominica, Grenada, St. Lucia, Bonaire, Aruba, Curaçao, Trinidad and Tobago, Suriname, Guyana, French Guiana, Ecuador, and Panama. Millennium provides comprehensive support including new and used machinery distribution, technical engineering services, spare parts availability, and wear items supply—enabling customers across construction, aggregate, and contractor industries to access Metso's portfolio while benefiting from localized service responsiveness and regional supply chain optimization that addresses critical lead-time and maintenance challenges in historically underserved markets.
Frequently Asked Questions
Related Report
1. Market Segmentation
1.1. Research Scope
1.2. Research Methodology
1.3. Definitions and Assumptions
2. Executive Summary
3. South America Positive Displacement Pump Market Policies, Regulations, and Standards
4. South America Positive Displacement Pump Market Dynamics
4.1. Growth Factors
4.2. Challenges
4.3. Trends
4.4. Opportunities
5. South America Positive Displacement Pump Market Statistics, 2022-2032F
5.1. Market Size & Growth Outlook
5.1.1.By Revenues in USD Million
5.1.2.By Units Sold in Million Units
5.2. Market Segmentation & Growth Outlook
5.2.1.By Pump Type
5.2.1.1. Reciprocating Pump- Market Insights and Forecast 2022-2032, USD Million
5.2.1.1.1. Piston- Market Insights and Forecast 2022-2032, USD Million
5.2.1.1.2. Plunger- Market Insights and Forecast 2022-2032, USD Million
5.2.1.1.3. Diaphragm- Market Insights and Forecast 2022-2032, USD Million
5.2.1.2. Rotary Pump- Market Insights and Forecast 2022-2032, USD Million
5.2.1.2.1. Gear- Market Insights and Forecast 2022-2032, USD Million
5.2.1.2.2. Screw- Market Insights and Forecast 2022-2032, USD Million
5.2.1.2.3. Lobe- Market Insights and Forecast 2022-2032, USD Million
5.2.1.2.4. Vane- Market Insights and Forecast 2022-2032, USD Million
5.2.1.3. Peristaltic Pump- Market Insights and Forecast 2022-2032, USD Million
5.2.2.By Pressure Rating
5.2.2.1. Up to 50 bar- Market Insights and Forecast 2022-2032, USD Million
5.2.2.2. 51 to 150 bar- Market Insights and Forecast 2022-2032, USD Million
5.2.2.3. Above 150 bar- Market Insights and Forecast 2022-2032, USD Million
5.2.3.By End-user Industry
5.2.3.1. Oil & Gas- Market Insights and Forecast 2022-2032, USD Million
5.2.3.2. Power Generation- Market Insights and Forecast 2022-2032, USD Million
5.2.3.3. Water & Wastewater- Market Insights and Forecast 2022-2032, USD Million
5.2.3.4. Chemical & Petrochemical- Market Insights and Forecast 2022-2032, USD Million
5.2.3.5. Food & Beverage- Market Insights and Forecast 2022-2032, USD Million
5.2.3.6. Pharmaceutical & Biotechnology- Market Insights and Forecast 2022-2032, USD Million
5.2.3.7. Mining & Minerals- Market Insights and Forecast 2022-2032, USD Million
5.2.3.8. Pulp & Paper- Market Insights and Forecast 2022-2032, USD Million
5.2.3.9. Others- Market Insights and Forecast 2022-2032, USD Million
5.2.4.By Country
5.2.4.1. Brazil
5.2.4.2. Argentina
5.2.4.3. Chile
5.2.4.4. Rest of South America
5.2.5.By Competitors
5.2.5.1. Competition Characteristics
5.2.5.2. Market Share & Analysis
6. Brazil Positive Displacement Pump Market Statistics, 2022-2032F
6.1. Market Size & Growth Outlook
6.1.1.By Revenues in USD Million
6.1.2.By Units Sold in Million Units
6.2. Market Segmentation & Growth Outlook
6.2.1.By Pump Type- Market Insights and Forecast 2022-2032, USD Million
6.2.2.By Pressure Rating- Market Insights and Forecast 2022-2032, USD Million
6.2.3.By End-user Industry- Market Insights and Forecast 2022-2032, USD Million
7. Argentina Positive Displacement Pump Market Statistics, 2022-2032F
7.1. Market Size & Growth Outlook
7.1.1.By Revenues in USD Million
7.1.2.By Units Sold in Million Units
7.2. Market Segmentation & Growth Outlook
7.2.1.By Pump Type- Market Insights and Forecast 2022-2032, USD Million
7.2.2.By Pressure Rating- Market Insights and Forecast 2022-2032, USD Million
7.2.3.By End-user Industry- Market Insights and Forecast 2022-2032, USD Million
8. Chile Positive Displacement Pump Market Statistics, 2022-2032F
8.1. Market Size & Growth Outlook
8.1.1.By Revenues in USD Million
8.1.2.By Units Sold in Million Units
8.2. Market Segmentation & Growth Outlook
8.2.1.By Pump Type- Market Insights and Forecast 2022-2032, USD Million
8.2.2.By Pressure Rating- Market Insights and Forecast 2022-2032, USD Million
8.2.3.By End-user Industry- Market Insights and Forecast 2022-2032, USD Million
9. Competitive Outlook
9.1. Company Profiles
9.1.1.Grundfos Holding A/S
9.1.1.1. Business Description
9.1.1.2. Product Portfolio
9.1.1.3. Collaborations & Alliances
9.1.1.4. Recent Developments
9.1.1.5. Financial Details
9.1.1.6. Others
9.1.2.Flowserve Corporation
9.1.2.1. Business Description
9.1.2.2. Product Portfolio
9.1.2.3. Collaborations & Alliances
9.1.2.4. Recent Developments
9.1.2.5. Financial Details
9.1.2.6. Others
9.1.3.Sulzer Ltd.
9.1.3.1. Business Description
9.1.3.2. Product Portfolio
9.1.3.3. Collaborations & Alliances
9.1.3.4. Recent Developments
9.1.3.5. Financial Details
9.1.3.6. Others
9.1.4.Xylem Inc.
9.1.4.1. Business Description
9.1.4.2. Product Portfolio
9.1.4.3. Collaborations & Alliances
9.1.4.4. Recent Developments
9.1.4.5. Financial Details
9.1.4.6. Others
9.1.5.KSB SE & Co. KGaA
9.1.5.1. Business Description
9.1.5.2. Product Portfolio
9.1.5.3. Collaborations & Alliances
9.1.5.4. Recent Developments
9.1.5.5. Financial Details
9.1.5.6. Others
9.1.6.Schneider Motobombas
9.1.6.1. Business Description
9.1.6.2. Product Portfolio
9.1.6.3. Collaborations & Alliances
9.1.6.4. Recent Developments
9.1.6.5. Financial Details
9.1.6.6. Others
9.1.7.IMBIL
9.1.7.1. Business Description
9.1.7.2. Product Portfolio
9.1.7.3. Collaborations & Alliances
9.1.7.4. Recent Developments
9.1.7.5. Financial Details
9.1.7.6. Others
9.1.8.Bombas Leão
9.1.8.1. Business Description
9.1.8.2. Product Portfolio
9.1.8.3. Collaborations & Alliances
9.1.8.4. Recent Developments
9.1.8.5. Financial Details
9.1.8.6. Others
9.1.9.NETZSCH Holding
9.1.9.1. Business Description
9.1.9.2. Product Portfolio
9.1.9.3. Collaborations & Alliances
9.1.9.4. Recent Developments
9.1.9.5. Financial Details
9.1.9.6. Others
9.1.10. Metso
9.1.10.1. Business Description
9.1.10.2. Product Portfolio
9.1.10.3. Collaborations & Alliances
9.1.10.4. Recent Developments
9.1.10.5. Financial Details
9.1.10.6. Others
9.1.11. Baker Hughes
9.1.11.1. Business Description
9.1.11.2. Product Portfolio
9.1.11.3. Collaborations & Alliances
9.1.11.4. Recent Developments
9.1.11.5. Financial Details
9.1.11.6. Others
9.1.12. The Weir Group PLC
9.1.12.1. Business Description
9.1.12.2. Product Portfolio
9.1.12.3. Collaborations & Alliances
9.1.12.4. Recent Developments
9.1.12.5. Financial Details
9.1.12.6. Others
10. Disclaimer
| Segment | Sub-Segment |
|---|---|
| By Pump Type |
|
| By Pressure Rating |
|
| By End-user Industry |
|
| By Country |
|
Research Methodology
This study followed a structured approach comprising four key phases to assess the size and scope of the electro-oxidation market. The process began with thorough secondary research to collect data on the target market, related markets, and broader industry context. These findings, along with preliminary assumptions and estimates, were then validated through extensive primary research involving industry experts from across the value chain. To calculate the overall market size, both top-down and bottom-up methodologies were employed. Finally, market segmentation and data triangulation techniques were applied to refine and validate segment-level estimations.
Secondary Research
The secondary research phase involved gathering data from a wide range of credible and published sources. This step helped in identifying industry trends, defining market segmentation, and understanding the market landscape and value chain.
Sources consulted during this phase included:
- Company annual reports, investor presentations, and press releases
- Industry white papers and certified publications
- Trade directories and market-recognized databases
- Articles from authoritative authors and reputable journals
- Gold and silver standard websites
Secondary research was critical in mapping out the industry's value chain and monetary flow, identifying key market segments, understanding regional variations, and tracking significant industry developments.
Other key sources:
- Financial disclosures
- Industry associations and trade bodies
- News outlets and business magazines
- Academic journals and research studies
- Paid industry databases
Primary Research
To validate secondary data and gain deeper market insights, primary research was conducted with key stakeholders across both the supply and demand sides of the market.
On the demand side, participants included decision-makers and influencers from end-user industries—such as CIOs, CTOs, and CSOs—who provided first-hand perspectives on market needs, product usage, and future expectations.
On the supply side, interviews were conducted with manufacturers, industry associations, and institutional participants to gather insights into current offerings, product pipelines, and market challenges.
Primary interviews provided critical inputs such as:
- Market size and revenue data
- Product and service breakdowns
- Market forecasts
- Regional and application-specific trends
Stakeholders consulted included:
- Leading OEM and solution providers
- Channel and distribution partners
- End users across various applications
- Independent consultants and industry specialists
Market Size Estimation and Data Triangulation
- Identifying Key Market Participants (Secondary Research)
- Goal: To identify the major players or companies in the target market. This typically involves using publicly available data sources such as industry reports, market research publications, and financial statements of companies.
- Tools: Reports from firms like Gartner, Forrester, Euromonitor, Statista, IBISWorld, and others. Public financial statements, news articles, and press releases from top market players.
- Extracting Earnings of Key Market Participants
- Goal: To estimate the earnings generated from the product or service being analyzed. This step helps in understanding the revenue potential of each market player in a specific geography.
- Methods: Earnings data can be gathered from:
- Publicly available financial reports (for listed companies).
- Interviews and primary data sources from professionals, such as Directors, VPs, SVPs, etc. This is especially useful for understanding more nuanced, internal data that isn't publicly disclosed.
- Annual reports and investor presentations of key players.
- Data Collation and Development of a Relevant Data Model
- Goal: To collate inputs from both primary and secondary sources into a structured, data-driven model for market estimation. This model will incorporate key market KPIs and any independent variables relevant to the market.
- Key KPIs: These could include:
- Market size, growth rate, and demand drivers.
- Industry-specific metrics like market share, average revenue per customer (ARPC), or average deal size.
- External variables, such as economic growth rates, inflation rates, or commodity prices, that could affect the market.
- Data Modeling: Based on this data, the market forecasts are developed for the next 5 years. A combination of trend analysis, scenario modeling, and statistical regression might be used to generate projections.
- Scenario Analysis
- Goal: To test different assumptions and validate how sensitive the market is to changes in key variables (e.g., market demand, regulatory changes, technological disruptions).
- Types of Scenarios:
- Base Case: Based on current assumptions and historical data.
- Best-Case Scenario: Assuming favorable market conditions, regulatory environments, and technological advancements.
- Worst-Case Scenario: Accounting for adverse factors, such as economic downturns, stricter regulations, or unexpected disruptions.


