North America Positive Displacement Pump Market Report: Trends, Growth and Forecast (2026-2032)
By Pump Type (Reciprocating Pump (Piston, Plunger, Diaphragm), Rotary Pump (Gear, Screw, Lobe, Vane), Peristaltic Pump), By Pressure Rating (Up to 50 bar, 51 to 150 bar, Above 150 bar), By End-user Industry (Oil & Gas, Power Generation, Water & Wastewater, Chemical & Petrochemical, Food & Beverage, Pharmaceutical & Biotechnology, Mining & Minerals, Pulp & Paper, Others), By Country (US, Canada, Mexico, Rest of North America) ... Read more
|
Major Players
|
North America Positive Displacement Pump Market Statistics and Insights, 2026
- Market Size Statistics
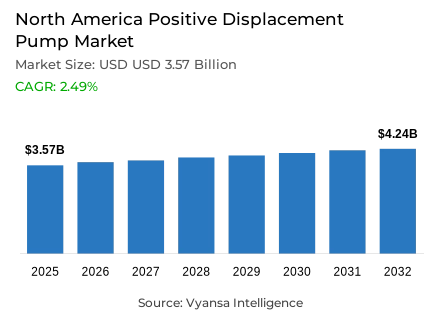
- North America positive displacement pump market is estimated at USD 3.57 billion in 2025.
- The market size is expected to grow to USD 4.24 billion by 2032.
- Market to register a cagr of around 2.49% during 2026-32.
- Pump Type Shares
- Rotary pump grabbed market share of 50%.
- Competition
- Positive displacement pump in North America is currently being catered to by more than 10 companies.
- Top 5 companies acquired around 60% of the market share.
- SPX FLOW Inc.; Grundfos Holding A/S; Dover Corporation; Flowserve Corporation; Xylem Inc. etc., are few of the top companies.
- End-user Industry
- Oil & Gas grabbed 35% of the market.
- Country
- US leads with a 90% share of the North America market.
North America Positive Displacement Pump Market Outlook
The market of North America positive displacement pump is estimated at USD 3.57 billion in 2025 and to increase to USD 4.24 billion by 2032 with a CAGR of about 2.49% between 2026 and 2032. This expansion is fueled by steady demand in major sectors like water infrastructure, oil and gas, and clean energy and rising investments in new facilities and equipment upgrades.
Rotary positive displacement pumps dominate the market with 50% share, as they are preferred due to their capacity to deliver a constant volume, self-priming, and their capacity to tolerate high-viscosity fluids. These pumps are common in the oil and gas, chemical processing, and water infrastructure industries. Their strong performance in different operational conditions guarantees them reliable operations which further enhances their market share in North America.
The oil and gas sector is the biggest end-user market with 35% of the market. The continuous capital investments in upstream production, midstream transportation, and downstream refining operations drive demand, and positive displacement pumps are important in fluid transfer, controlling crude oil viscosity, and in drilling operations. These sectors will keep the market stable and growing during the forecast period.
The United States is the market leader, with a share of about 90% of the demand of positive displacement pumps in North America. The U.S. continues to be a market growth engine, making significant investments in water infrastructure, energy, and new hydrogen production plants. Although Canada and Mexico also play a role in regional demand, the U.S. remains dominant, which guarantees a stable pipeline of pump deployment in different sectors by 2032.

North America Positive Displacement Pump Market Growth Driver
Sustained Municipal and Industrial Water Infrastructure Investment Supports Market Expansion
North America is experiencing massive modernization of water and wastewater systems and this is generating a stable demand for pumping equipment. In the United States, the U.S. Environmental Protection Agency estimated in 2024 that wastewater and stormwater infrastructure needs USD 630.1 billion in 20 years. The Infrastructure Investment and Jobs Act specifically provided USD 50 billion in five years to improve water infrastructure, including upgrades to treatment plants, wastewater collection systems, and drinking water distribution systems. This is a multi-year federal investment that creates a stable demand climate among pump suppliers to municipal water authorities.
Positive displacement pumps are required in water treatment plants, wastewater plants, and slurry-handling distribution networks to provide accurate chemical dosing, fluid transfer at different pressures. Rotary, gear, and screw pump designs are commonly used, which provide uniform volumetric delivery and reliability. The long-term infrastructure investment cycle offers long-term replacement and growth opportunities to equipment manufacturers, which strengthens the market stability up to 2026-2032.
North America Positive Displacement Pump Market Challenge
Extended Lead Times and Raw Material Constraints Affect Supply Reliability
The manufacturers of pumps in North America are experiencing chronic shortages of raw materials that are essential in their operations, which increases lead times and affects delivery times. The average procurement cycles are 81 days, 25% higher than before the pandemic, with capacitors taking 34 weeks and semiconductors between 12 and 40 weeks. The fabrication of standard industrial equipment has grown to 20–78 weeks, compared to 8–16 weeks earlier, with the actual delivery times varying 50–200% of supplier quotes. Manufacturers will be forced to hold larger safety stocks, which will raise the cost of operation and make it difficult to manage inventory.
The tightness of the supply chain is also applied to the new hydrogen production equipment. The worldwide electrolyzer capacity increased to more than 40 gigawatts in 2024, compared to 25 gigawatts in 2023, and is expected to reach more than 165 gigawatts by 2030. Rare materials such as iridium and platinum to make proton exchange membrane electrolyzers are bottlenecks, and the cost of the system is an average of USD 3,000 per kilowatt in 2024. These limitations are felt throughout the wider industrial equipment industry, such as positive displacement pump manufacturing, in terms of access to motors, controllers, and precision components that are essential to reliable operation.
Unlock Market Intelligence
Explore the market potential with our data-driven report
North America Positive Displacement Pump Market Trend
Regulatory Energy Efficiency Standards Drive Design Optimization
New regulations by the U.S. Department of Energy (DOE) are influencing the specifications of industrial pumps by imposing mandatory energy efficiency standards. The DOE uses the Pump Energy Index (PEI) to measure performance where equipment must achieve minimum efficiency levels in categories of End Suction Close-Coupled, End Suction Frame Mounted, In-line, and Submersible Turbine pumps. To meet the requirement, manufacturers need to redesign the 25% of deployed pumps that are the least efficient, removing the old designs and standardizing the performance benchmarks in the market.
Adherence to these standards provides operational and environmental advantages, which encourages the use of energy-efficient pump technology. DOE estimates that the lifecycle greenhouse gas reductions of equipment produced under these standards may amount to 17 million metric tons in 30 years. The end users in water treatment, oil and gas, and chemical processing have realized that enhanced efficiency lowers the operating costs in the long run. The regulatory framework sets a performance standard, which is more inclined towards advanced hydraulic designs and strengthening market demand towards optimized positive displacement pumps.
North America Positive Displacement Pump Market Opportunity
Expansion of Hydrogen Production Infrastructure Stimulates Equipment Demand
The industrial hydrogen market in North America is growing at a high rate, which opens the prospects of specialized pumping systems. The International Energy Agency predicts that by 2030, 50% of the world announced low-emissions hydrogen production will be in North America. In 2024, capital expenditure on low-emissions hydrogen increased 80% over 2023 to USD 4.3 billion, and electrolyzer technology constitutes 80% of planned 2025 deployment. By the end of 2025, the production of hydrogen with low emissions will reach 1 million tons.
The growth of electrolyzer manufacturing is supported by regional policy and resource benefits, and 60 gigawatts of cumulative capacity are planned between 2024 and 2030. Electrolyzer plants use positive displacement pumps to circulate coolant, transfer hydrogen, and handle high-pressure fluids. Such investments generate a long-term demand in pumping systems in hydrogen generation, compression, storage, and distribution infrastructure, which gives manufacturers long-term growth opportunities and end-user diversification in the changing clean energy market.
North America Positive Displacement Pump Market Country Analysis
By Country
- US
- Canada
- Mexico
- Rest of North America
The United States accounts for approximately 90% of North America’s positive displacement pump demand, reflecting extensive industrial infrastructure and capital-intensive energy sector operations. U.S. water and energy operations drive substantial replacement spending, while hydrogen production infrastructure provides a new vector for pump deployment.
Energy sector operations, including conventional hydrocarbons and emerging hydrogen production, further strengthen U.S. market dominance. Electrolyzer facilities, hydrogen compression, and distribution systems require positive displacement pumps for high-pressure and precision fluid handling. Canada’s smaller industrial base and Mexico’s developing infrastructure contribute to regional demand, but the U.S. remains the primary driver, ensuring predictable deployment of pumps across industrial, water, and energy applications throughout the 2026–2032 period.
Unlock Market Intelligence
Explore the market potential with our data-driven report
North America Positive Displacement Pump Market Segmentation Analysis
By Pump Type
- Reciprocating Pump
- Piston
- Plunger
- Diaphragm
- Rotary Pump
- Gear
- Screw
- Lobe
- Vane
- Peristaltic Pump
Rotary positive displacement pumps account for 50% of North America’s market share, reflecting widespread preference for consistent volumetric delivery, self-priming capability, and tolerance of high-viscosity fluids. Designs including internal and external gear pumps, lobe pumps, and helical screw pumps are widely used in oil and gas fluid transfer, chemical dosing, and abrasive slurry handling. Their robust performance under varying operational conditions ensures reliability and repeatable accuracy, establishing rotary technology as the baseline across most industrial end users.
The diversity of industrial applications supports market stability through economic cycles. Water infrastructure modernization, oil and gas operations, and chemical processing collectively drive sustained deployment of rotary pumps. Replacement demand from aging equipment and new facility construction maintains a continuous market pipeline, while the design advantages of rotary pumps—self-priming, tolerance of abrasive fluids, and consistent volumetric delivery—reinforce their leadership position in North America’s positive displacement pump market.

By End-user Industry
- Oil & Gas
- Power Generation
- Water & Wastewater
- Chemical & Petrochemical
- Food & Beverage
- Pharmaceutical & Biotechnology
- Mining & Minerals
- Pulp & Paper
- Others
The oil and gas industry represents approximately 35% of North America’s positive displacement pump market, making it the largest end-user segment. Upstream production, midstream transportation, and downstream refining rely on pumps to manage crude oil viscosity, transfer production fluids, and support drilling operations in challenging environments. Specialized pump designs are essential for handling crude, drilling muds, and high-pressure production fluids with consistent reliability.
Ongoing capital investment in infrastructure maintenance, production operations, and equipment replacement ensures predictable demand cycles. Positive displacement pumps deployed across extraction, transportation, and refining operations maintain operational continuity and efficiency, establishing the oil and gas sector as the primary driver of industrial demand. New facility development, replacement cycles, and operational upgrades collectively sustain robust pump deployment across the 2026–2032 forecast period, reinforcing North America’s industrial equipment market resilience.
Various Market Players in North America Positive Displacement Pump Market
The companies mentioned below are highly active in the North America positive displacement pump market, occupying a considerable portion of the market and shaping industry progress.
- SPX FLOW Inc.
- Grundfos Holding A/S
- Dover Corporation
- Flowserve Corporation
- Xylem Inc.
- Ampco Pumps Company Inc.
- ITT Inc.
- Pentair PLC
- Ingersoll Rand
- KSB SE & Co. KGaA
- Sulzer Ltd.
- Baker Hughes Company
Market News & Updates
- Ampco Pumps Company Inc., 2025:
Ampco showcased its new H Series high-capacity centrifugal pumps at Pack Expo 2025 (September 29-October 1, Chicago), featuring 100% hydraulic and dimensional part-for-part interchangeability with competing 200 Series units. The company demonstrated its patented ZP3 Series circumferential piston positive displacement pump with improved CIP-ability through front-loading seal technology and a free drain design. Additionally, Ampco introduced the Bornemann SLH-5G twin-screw pump developed through its membership integration with the KRONES group. The company also featured its AC/AC+ Series sanitary positive displacement pumps constructed from 316L stainless steel and the LF Series high-efficiency models designed for difficult-to-handle products, demonstrating these at multiple industry trade shows throughout 2025.
Frequently Asked Questions
Related Report
1. Market Segmentation
1.1. Research Scope
1.2. Research Methodology
1.3. Definitions and Assumptions
2. Executive Summary
3. North America Positive Displacement Pump Market Policies, Regulations, and Standards
4. North America Positive Displacement Pump Market Dynamics
4.1. Growth Factors
4.2. Challenges
4.3. Trends
4.4. Opportunities
5. North America Positive Displacement Pump Market Statistics, 2022-2032F
5.1. Market Size & Growth Outlook
5.1.1.By Revenues in USD Million
5.1.2.By Units Sold in Million Units
5.2. Market Segmentation & Growth Outlook
5.2.1.By Pump Type
5.2.1.1. Reciprocating Pump- Market Insights and Forecast 2022-2032, USD Million
5.2.1.1.1. Piston- Market Insights and Forecast 2022-2032, USD Million
5.2.1.1.2. Plunger- Market Insights and Forecast 2022-2032, USD Million
5.2.1.1.3. Diaphragm- Market Insights and Forecast 2022-2032, USD Million
5.2.1.2. Rotary Pump- Market Insights and Forecast 2022-2032, USD Million
5.2.1.2.1. Gear- Market Insights and Forecast 2022-2032, USD Million
5.2.1.2.2. Screw- Market Insights and Forecast 2022-2032, USD Million
5.2.1.2.3. Lobe- Market Insights and Forecast 2022-2032, USD Million
5.2.1.2.4. Vane- Market Insights and Forecast 2022-2032, USD Million
5.2.1.3. Peristaltic Pump- Market Insights and Forecast 2022-2032, USD Million
5.2.2.By Pressure Rating
5.2.2.1. Up to 50 bar- Market Insights and Forecast 2022-2032, USD Million
5.2.2.2. 51 to 150 bar- Market Insights and Forecast 2022-2032, USD Million
5.2.2.3. Above 150 bar- Market Insights and Forecast 2022-2032, USD Million
5.2.3.By End-user Industry
5.2.3.1. Oil & Gas- Market Insights and Forecast 2022-2032, USD Million
5.2.3.2. Power Generation- Market Insights and Forecast 2022-2032, USD Million
5.2.3.3. Water & Wastewater- Market Insights and Forecast 2022-2032, USD Million
5.2.3.4. Chemical & Petrochemical- Market Insights and Forecast 2022-2032, USD Million
5.2.3.5. Food & Beverage- Market Insights and Forecast 2022-2032, USD Million
5.2.3.6. Pharmaceutical & Biotechnology- Market Insights and Forecast 2022-2032, USD Million
5.2.3.7. Mining & Minerals- Market Insights and Forecast 2022-2032, USD Million
5.2.3.8. Pulp & Paper- Market Insights and Forecast 2022-2032, USD Million
5.2.3.9. Others- Market Insights and Forecast 2022-2032, USD Million
5.2.4.By Country
5.2.4.1. US
5.2.4.2. Canada
5.2.4.3. Mexico
5.2.4.4. Rest of North America
5.2.5.By Competitors
5.2.5.1. Competition Characteristics
5.2.5.2. Market Share & Analysis
6. US Positive Displacement Pump Market Statistics, 2022-2032F
6.1. Market Size & Growth Outlook
6.1.1.By Revenues in USD Million
6.1.2.By Units Sold in Million Units
6.2. Market Segmentation & Growth Outlook
6.2.1.By Pump Type- Market Insights and Forecast 2022-2032, USD Million
6.2.2.By Pressure Rating- Market Insights and Forecast 2022-2032, USD Million
6.2.3.By End-user Industry- Market Insights and Forecast 2022-2032, USD Million
7. Canada Positive Displacement Pump Market Statistics, 2022-2032F
7.1. Market Size & Growth Outlook
7.1.1.By Revenues in USD Million
7.1.2.By Units Sold in Million Units
7.2. Market Segmentation & Growth Outlook
7.2.1.By Pump Type- Market Insights and Forecast 2022-2032, USD Million
7.2.2.By Pressure Rating- Market Insights and Forecast 2022-2032, USD Million
7.2.3.By End-user Industry- Market Insights and Forecast 2022-2032, USD Million
8. Mexico Positive Displacement Pump Market Statistics, 2022-2032F
8.1. Market Size & Growth Outlook
8.1.1.By Revenues in USD Million
8.1.2.By Units Sold in Million Units
8.2. Market Segmentation & Growth Outlook
8.2.1.By Pump Type- Market Insights and Forecast 2022-2032, USD Million
8.2.2.By Pressure Rating- Market Insights and Forecast 2022-2032, USD Million
8.2.3.By End-user Industry- Market Insights and Forecast 2022-2032, USD Million
9. Competitive Outlook
9.1. Company Profiles
9.1.1.Flowserve Corporation
9.1.1.1. Business Description
9.1.1.2. Product Portfolio
9.1.1.3. Collaborations & Alliances
9.1.1.4. Recent Developments
9.1.1.5. Financial Details
9.1.1.6. Others
9.1.2.Xylem Inc.
9.1.2.1. Business Description
9.1.2.2. Product Portfolio
9.1.2.3. Collaborations & Alliances
9.1.2.4. Recent Developments
9.1.2.5. Financial Details
9.1.2.6. Others
9.1.3.Ampco Pumps Company Inc.
9.1.3.1. Business Description
9.1.3.2. Product Portfolio
9.1.3.3. Collaborations & Alliances
9.1.3.4. Recent Developments
9.1.3.5. Financial Details
9.1.3.6. Others
9.1.4.ITT Inc.
9.1.4.1. Business Description
9.1.4.2. Product Portfolio
9.1.4.3. Collaborations & Alliances
9.1.4.4. Recent Developments
9.1.4.5. Financial Details
9.1.4.6. Others
9.1.5.Pentair PLC
9.1.5.1. Business Description
9.1.5.2. Product Portfolio
9.1.5.3. Collaborations & Alliances
9.1.5.4. Recent Developments
9.1.5.5. Financial Details
9.1.5.6. Others
9.1.6.SPX FLOW Inc.
9.1.6.1. Business Description
9.1.6.2. Product Portfolio
9.1.6.3. Collaborations & Alliances
9.1.6.4. Recent Developments
9.1.6.5. Financial Details
9.1.6.6. Others
9.1.7.Grundfos Holding A/S
9.1.7.1. Business Description
9.1.7.2. Product Portfolio
9.1.7.3. Collaborations & Alliances
9.1.7.4. Recent Developments
9.1.7.5. Financial Details
9.1.7.6. Others
9.1.8.Dover Corporation
9.1.8.1. Business Description
9.1.8.2. Product Portfolio
9.1.8.3. Collaborations & Alliances
9.1.8.4. Recent Developments
9.1.8.5. Financial Details
9.1.8.6. Others
9.1.9.Ingersoll Rand
9.1.9.1. Business Description
9.1.9.2. Product Portfolio
9.1.9.3. Collaborations & Alliances
9.1.9.4. Recent Developments
9.1.9.5. Financial Details
9.1.9.6. Others
9.1.10. KSB SE & Co. KGaA
9.1.10.1. Business Description
9.1.10.2. Product Portfolio
9.1.10.3. Collaborations & Alliances
9.1.10.4. Recent Developments
9.1.10.5. Financial Details
9.1.10.6. Others
9.1.11. Sulzer Ltd.
9.1.11.1. Business Description
9.1.11.2. Product Portfolio
9.1.11.3. Collaborations & Alliances
9.1.11.4. Recent Developments
9.1.11.5. Financial Details
9.1.11.6. Others
9.1.12. Baker Hughes Company
9.1.12.1. Business Description
9.1.12.2. Product Portfolio
9.1.12.3. Collaborations & Alliances
9.1.12.4. Recent Developments
9.1.12.5. Financial Details
9.1.12.6. Others
10. Disclaimer
| Segment | Sub-Segment |
|---|---|
| By Pump Type |
|
| By Pressure Rating |
|
| By End-user Industry |
|
| By Country |
|
Research Methodology
This study followed a structured approach comprising four key phases to assess the size and scope of the electro-oxidation market. The process began with thorough secondary research to collect data on the target market, related markets, and broader industry context. These findings, along with preliminary assumptions and estimates, were then validated through extensive primary research involving industry experts from across the value chain. To calculate the overall market size, both top-down and bottom-up methodologies were employed. Finally, market segmentation and data triangulation techniques were applied to refine and validate segment-level estimations.
Secondary Research
The secondary research phase involved gathering data from a wide range of credible and published sources. This step helped in identifying industry trends, defining market segmentation, and understanding the market landscape and value chain.
Sources consulted during this phase included:
- Company annual reports, investor presentations, and press releases
- Industry white papers and certified publications
- Trade directories and market-recognized databases
- Articles from authoritative authors and reputable journals
- Gold and silver standard websites
Secondary research was critical in mapping out the industry's value chain and monetary flow, identifying key market segments, understanding regional variations, and tracking significant industry developments.
Other key sources:
- Financial disclosures
- Industry associations and trade bodies
- News outlets and business magazines
- Academic journals and research studies
- Paid industry databases
Primary Research
To validate secondary data and gain deeper market insights, primary research was conducted with key stakeholders across both the supply and demand sides of the market.
On the demand side, participants included decision-makers and influencers from end-user industries—such as CIOs, CTOs, and CSOs—who provided first-hand perspectives on market needs, product usage, and future expectations.
On the supply side, interviews were conducted with manufacturers, industry associations, and institutional participants to gather insights into current offerings, product pipelines, and market challenges.
Primary interviews provided critical inputs such as:
- Market size and revenue data
- Product and service breakdowns
- Market forecasts
- Regional and application-specific trends
Stakeholders consulted included:
- Leading OEM and solution providers
- Channel and distribution partners
- End users across various applications
- Independent consultants and industry specialists
Market Size Estimation and Data Triangulation
- Identifying Key Market Participants (Secondary Research)
- Goal: To identify the major players or companies in the target market. This typically involves using publicly available data sources such as industry reports, market research publications, and financial statements of companies.
- Tools: Reports from firms like Gartner, Forrester, Euromonitor, Statista, IBISWorld, and others. Public financial statements, news articles, and press releases from top market players.
- Extracting Earnings of Key Market Participants
- Goal: To estimate the earnings generated from the product or service being analyzed. This step helps in understanding the revenue potential of each market player in a specific geography.
- Methods: Earnings data can be gathered from:
- Publicly available financial reports (for listed companies).
- Interviews and primary data sources from professionals, such as Directors, VPs, SVPs, etc. This is especially useful for understanding more nuanced, internal data that isn't publicly disclosed.
- Annual reports and investor presentations of key players.
- Data Collation and Development of a Relevant Data Model
- Goal: To collate inputs from both primary and secondary sources into a structured, data-driven model for market estimation. This model will incorporate key market KPIs and any independent variables relevant to the market.
- Key KPIs: These could include:
- Market size, growth rate, and demand drivers.
- Industry-specific metrics like market share, average revenue per customer (ARPC), or average deal size.
- External variables, such as economic growth rates, inflation rates, or commodity prices, that could affect the market.
- Data Modeling: Based on this data, the market forecasts are developed for the next 5 years. A combination of trend analysis, scenario modeling, and statistical regression might be used to generate projections.
- Scenario Analysis
- Goal: To test different assumptions and validate how sensitive the market is to changes in key variables (e.g., market demand, regulatory changes, technological disruptions).
- Types of Scenarios:
- Base Case: Based on current assumptions and historical data.
- Best-Case Scenario: Assuming favorable market conditions, regulatory environments, and technological advancements.
- Worst-Case Scenario: Accounting for adverse factors, such as economic downturns, stricter regulations, or unexpected disruptions.


