Global Positive Displacement Pump Market Report: Trends, Growth and Forecast (2026-2032)
By Pump Type (Reciprocating Pump (Piston, Plunger, Diaphragm), Rotary Pump (Gear, Screw, Lobe, Vane), Peristaltic Pump), By Pressure Rating (Up to 50 bar, 51 to 150 bar, Above 150 bar), By End-user Industry (Oil & Gas, Power Generation, Water & Wastewater, Chemical & Petrochemical, Food & Beverage, Pharmaceutical & Biotechnology, Mining & Minerals, Pulp & Paper, Others), By Region (North America, South America, Europe, Middle East & Africa, Asia Pacific) ... Read more
|
Major Players
|
Global Positive Displacement Pump Market Statistics and Insights, 2026
- Market Size Statistics
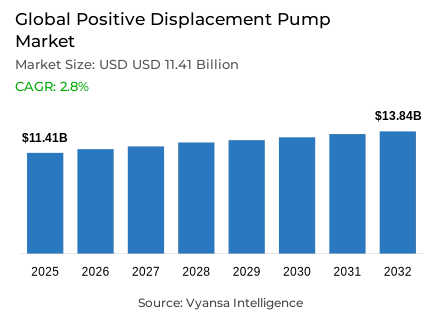
- Global positive displacement pump market is estimated at USD 11.41 billion in 2025.
- The market size is expected to grow to USD 13.84 billion by 2032.
- Market to register a CAGR of around 2.8% during 2026-32.
- Pump Type Shares
- Rotary pump grabbed market share of 55%.
- Competition
- Global positive displacement pump market is currently being catered to by more than 20 companies.
- Top 5 companies acquired around 50% of the market share.
- KSB SE & Co. KGaA; Sulzer Ltd.; Alfa Laval AB; Grundfos Holding A/S; Xylem Inc. etc., are few of the top companies.
- Pressure Rating
- Up to 50 bar grabbed 45% of the market.
- Region
- Asia Pacific leads with a 35% share of the global market.
Global Positive Displacement Pump Market Outlook
The Global positive displacement pump market between 2026 and 2032 is stable and is structurally supported by the continued lack of long-term water infrastructure and by climate-related pressures on the existing systems. It is projected at USD 11.41 billion in 2025 and will be around USD 13.84 billion in 2032 with a compound annual growth rate of about 2.8% in the period 2026 to 2032. The growth is pegged on the increasing disconnect between the increasing demand of water services and the constrained capacity to treat, distribute, and sanitise, especially in the rapidly urbanising low- and middle-income economies. Massive government programmes and external funding guarantee consistent procurement patterns instead of demand peaks.
The consistency of demand is still supported by water scarcity and climate variability. Reduced river flows and groundwater stress are forcing utilities and industries to increase treatment capacity, enhance conveyance efficiency, and invest in recycling systems. These applications are based on positive-displacement pumps to ensure volumetric flow, pressure enhancement, and variable-quality fluid management. This results in a demand that is less discretionary capital spending-driven and more operational necessity and system resilience-driven, which offers downside protection during economic cycles.
Technologically, rotary pumps are the most prevalent in the market with a market share of 55%, which is an indication of their wide applicability in municipal, industrial, and process industries. Their consistent flow performance in different pressure conditions supports their application in water treatment, refining, chemicals, and food processing. Similarly, pumps with a maximum pressure of 50 bar represent approximately 45% of the world market, since this pressure level is within the normal operating range of water distribution, wastewater recirculation, irrigation, and general industrial services.
Asia Pacific dominates the global positive-displacement pump market with 35% of the market share regionally. This position is supported by large-scale industrial activity in China and the growing irrigation, municipal, and industrial infrastructure in India. The long-term multilateral funding and national investment programmes in the region provide the region with a sustained demand of cost-effective and reliable pump systems up to 2032.

Global Positive Displacement Pump Market Growth Driver
Expanding Global Water Access Deficit Sustains Infrastructure-Led Equipment Demand
The increasing gap between the demand of potable water and the current infrastructure capacity is structurally supported by the Global positive displacement pump market. The 2024 evaluation by the World Bank confirms that 2.1 billion individuals continue to lack access to safely managed drinking water, thus generating a sustained need to establish new treatment facilities, network expansions, and system repairs in rapidly urbanising low- and middle-income economies. Achieving universal water and sanitation access requires an annual investment of USD 138 billion nearly three times the current expenditure rates, which entrenches long-term procurement cycles of pumping equipment into public infrastructure programmes. In 2024, multilateral development banks sanctioned USD 19.6 billion in water-sector financing, most of which was channeled to areas where volumetric pumping reliability is essential to expand service coverage.
This demand is further exacerbated by climate stress. According to the World Meteorological Organization, 2023 was the driest year of global river flows in over 30 years, forcing utilities to increase treatment capacity, improve conveyance efficiency, and implement recycling systems. The recirculation, pressure boosting, and variable-quality water handling operational needs rely on positive displacement pumps, anchoring demand until 2032.
Global Positive Displacement Pump Market Challenge
Intensifying Regulatory Compliance Raises Barriers Across Manufacturing Ecosystems
Regulatory evolution is a material constraint that influences competitive forces in the Global positive displacement pump market. The EU Machinery Regulation 2023/1230, which will come into effect in January 2027, will impose mandatory cybersecurity, digital documentation, and lifecycle traceability requirements on machinery with automated control systems. Manufacturers are forced to re-architect compliance, combine vulnerability-management processes, and go through extended third-party conformity testing, which adds to the cost of development and lengthens certification schedules. These requirements are disproportionately imposed on smaller suppliers who do not have in-house regulatory expertise, which has the effect of increasing the barriers to market entry and favouring established manufacturers with well-developed compliance infrastructure.
The complexity of compliance is not limited to Europe. The revised machinery quality-control orders in India require certification to enter the market since September 2026, and introduce parallel regulatory frameworks, which demand region-specific product variants and documentation systems. Handling conflicting standards raises capital intensity, testing spending, and technical staffing needs, delays time-to-market, and strengthens consolidation trends in the supply base.
Unlock Market Intelligence
Explore the market potential with our data-driven report
Global Positive Displacement Pump Market Trend
Slow Industrial Energy Efficiency Progress Shapes Specification Priorities
The development of energy-efficiency in industrial systems is still uneven, and it affects the choice of specifications in the application of positive displacement pumps. According to the International Energy Agency, the world primary energy intensity improved by 1% in 2024, far less than the rate needed to achieve COP28 efficiency goals. The industrial motor systems consume 72% of industrial electricity, but minimum performance standards apply only to three-fifths of installed motors in the world. This disjointed regulatory environment creates a two-speed market, with developed economies focusing on higher efficiency classes and emerging markets focusing on initial cost containment.
Barriers to structural adoption continue in 2026. Poor incentive alignment, skills gaps in electrical and mechanical trades, and poor retrofit economics limit quick efficiency upgrades. Consequently, end users still choose pumps based on capital cost and operational durability instead of lifecycle energy optimisation, maintaining demand over a wide efficiency range instead of driving universal uptake of high-performance settings.
Global Positive Displacement Pump Market Opportunity
Water-Stressed Regions Create Durable Multi-Sector Investment Potential
The Global positive displacement pump market has the highest concentration of opportunities in the long term in water stressed areas with concurrent municipal, industrial, and agricultural infrastructure shortages. According to WHO and UNICEF statistics, 3.4 billion individuals do not have access to safely managed sanitation in 2024, and the lack is most severe in low-income and climate-prone geographies. The ongoing hydrological stress in the largest Asian river basins has increased the pace of investment in treatment growth, recycling, and distribution resilience, all of which demand high-reliability positive displacement pumping solutions.
India is a good example of this convergence. Central Ground Water Board statistics indicate that groundwater is being pumped out faster than it is being replenished in several northern states, forcing concomitant investments in surface water treatment and industrial reuse systems. The municipal utilities, process industries and irrigation operators are also modernizing infrastructure and creating a continuous procurement cycle of pumps designed to meet variable pressures, fluid qualities and duty cycles regardless of the overall economic fluctuations.
Global Positive Displacement Pump Market Regional Analysis

By Region
- North America
- South America
- Europe
- Middle East & Africa
- Asia Pacific
Asia Pacific commands approximately 35% of the Global positive displacement pump market, driven by industrial scale, infrastructure modernization, and demographic demand intensity. China’s manufacturing dominance across chemicals, petrochemicals, pharmaceuticals, and food processing sustains continuous pump deployment, while India’s expansive irrigation base and accelerating industrialization generate parallel demand streams across municipal and process applications.
Financial commitment underpins this leadership. The Asian Development Bank estimates regional water infrastructure requirements at USD 60 billion annually through 2030, supported by more than USD 9 billion per year in multilateral financing. Diverse economic profiles create segmented demand, ranging from digitally enabled systems in advanced economies to cost-optimized solutions in developing markets, compelling manufacturers to maintain broad portfolios to achieve full regional penetration.
Unlock Market Intelligence
Explore the market potential with our data-driven report
Global Positive Displacement Pump Market Segmentation Analysis
By Pump Type
- Reciprocating Pump
- Piston
- Plunger
- Diaphragm
- Rotary Pump
- Gear
- Screw
- Lobe
- Vane
- Peristaltic Pump
Rotary pumps hold approximately 55% share of the Global positive displacement pump market, reflecting their adaptability across the widest range of industrial and municipal applications. External gear, internal gear, screw, and lobe configurations provide stable volumetric flow regardless of pressure variation, aligning with requirements in refining, chemical processing, food manufacturing, and wastewater recirculation. API 676 standardization reinforces adoption by defining performance classifications that simplify specification, testing, and cross-market acceptance.
Market leadership is reinforced by ecosystem maturity. Rotary pumps benefit from established manufacturing supply chains, extensive service networks, and proven retrofit compatibility within existing facilities. End users favor these platforms due to component interchangeability, predictable maintenance profiles, and minimized commissioning risk, strengthening repeat procurement as facilities modernize aging assets and standardize equipment portfolios.

By Pressure Rating
- Up to 50 bar
- 51 to 150 bar
- Above 150 bar
Pump systems rated up to 50 bar account for roughly 45% of total market share, representing the most widely deployed pressure class globally. This range aligns with standard operating conditions across municipal water distribution, wastewater treatment recirculation, food processing, and agricultural irrigation booster systems. Equipment in this category utilizes conventional materials, standardized sealing arrangements, and high-volume manufacturing processes, enabling competitive pricing that supports adoption across budget-constrained utilities and emerging industrial regions.
From a manufacturer perspective, this segment offers optimal scalability. Component commonality and supply chain efficiency outweigh the need for specialized metallurgy or custom engineering, supporting high unit volumes and predictable margins. In Asia Pacific particularly, infrastructure expansion specifications naturally align with sub-50-bar requirements, making this pressure class foundational to global installation volumes.
Market Players in Global Positive Displacement Pump Market
These market players maintain a significant presence in the Global positive displacement pump market sector and contribute to its ongoing evolution.
- KSB SE & Co. KGaA
- Sulzer Ltd.
- Alfa Laval AB
- Grundfos Holding A/S
- Xylem Inc.
- Flowserve Corporation
- SPX FLOW Inc.
- IDEX Corporation
- Dover Corporation
- Ingersoll Rand
- Pentair PLC
- NETZSCH Holding
- Wilo SE
- Gorman-Rupp Company
- The Weir Group PLC
Market News & Updates
- Gorman-Rupp Company, 2025:
Gorman-Rupp announced the expansion of its 6400 Series end suction centrifugal pumps with new 6" and 8" discharge models on February 4, 2025, representing a significant upgrade to its flooded suction portfolio. The 6400 Series, engineered on proven Super T Series technology, delivers advanced solids-handling capabilities through patented Eradicator® and Eradicator Plus™ wearplate designs, with capacities reaching 2,740 gallons per minute and heads to 170 feet, enabling handling of up to 4" solids. These pumps feature double-floating, self-aligning oil-lubricated mechanical cartridge seals for extended operational life. The company simultaneously commissioned new assembly and test facilities across its European operations at Waardenburg, Netherlands, expanding manufacturing capacity to support enhanced distribution and parts availability networks across municipal water, wastewater, industrial, construction, and petroleum markets globally, with production capability spanning nearly 1 million square feet of advanced facilities incorporating state-of-the-art quality control processes.
- Alfa Laval AB, 2025:
Alfa Laval launched the DuraCirc® circumferential piston pump in 2025 as the industry's first pump delivering a balanced combination of durability, reliability, high volumetric efficiency, and hygienic performance—addressing a market gap where manufacturers previously had to sacrifice one essential feature for another. The DuraCirc features 13 displacement models delivering flow rates to 150 m³/hour at pressures to 40 bar (580 psi), with EHEDG and 3-A hygienic design compliance, all-stainless steel construction, and an innovative oil-filled bearing design that eliminates weekly grease injection requirements. The pump incorporates a modular seal design for easy conversion without re-machining, long-life heavy-duty bearings on rigid shafts, and a truly front-loading single mechanical seal enabling fast in-situ replacement without requiring pump removal from the process line—a critical advantage for continuous operations in dairy, food, beverage, confectionery, pharmaceutical, and home-personal care industries where process uptime directly impacts profitability.
Frequently Asked Questions
Related Report
1. Market Segmentation
1.1. Research Scope
1.2. Research Methodology
1.3. Definitions and Assumptions
2. Executive Summary
3. Global Positive Displacement Pump Market Policies, Regulations, and Standards
4. Global Positive Displacement Pump Market Dynamics
4.1. Growth Factors
4.2. Challenges
4.3. Trends
4.4. Opportunities
5. Global Positive Displacement Pump Market Statistics, 2022-2032F
5.1. Market Size & Growth Outlook
5.1.1.By Revenues in USD Million
5.1.2.By Units Sold in Million Units
5.2. Market Segmentation & Growth Outlook
5.2.1.By Pump Type
5.2.1.1. Reciprocating Pump- Market Insights and Forecast 2022-2032, USD Million
5.2.1.1.1. Piston- Market Insights and Forecast 2022-2032, USD Million
5.2.1.1.2. Plunger- Market Insights and Forecast 2022-2032, USD Million
5.2.1.1.3. Diaphragm- Market Insights and Forecast 2022-2032, USD Million
5.2.1.2. Rotary Pump- Market Insights and Forecast 2022-2032, USD Million
5.2.1.2.1. Gear- Market Insights and Forecast 2022-2032, USD Million
5.2.1.2.2. Screw- Market Insights and Forecast 2022-2032, USD Million
5.2.1.2.3. Lobe- Market Insights and Forecast 2022-2032, USD Million
5.2.1.2.4. Vane- Market Insights and Forecast 2022-2032, USD Million
5.2.1.3. Peristaltic Pump- Market Insights and Forecast 2022-2032, USD Million
5.2.2.By Pressure Rating
5.2.2.1. Up to 50 bar- Market Insights and Forecast 2022-2032, USD Million
5.2.2.2. 51 to 150 bar- Market Insights and Forecast 2022-2032, USD Million
5.2.2.3. Above 150 bar- Market Insights and Forecast 2022-2032, USD Million
5.2.3.By End-user Industry
5.2.3.1. Oil & Gas- Market Insights and Forecast 2022-2032, USD Million
5.2.3.2. Power Generation- Market Insights and Forecast 2022-2032, USD Million
5.2.3.3. Water & Wastewater- Market Insights and Forecast 2022-2032, USD Million
5.2.3.4. Chemical & Petrochemical- Market Insights and Forecast 2022-2032, USD Million
5.2.3.5. Food & Beverage- Market Insights and Forecast 2022-2032, USD Million
5.2.3.6. Pharmaceutical & Biotechnology- Market Insights and Forecast 2022-2032, USD Million
5.2.3.7. Mining & Minerals- Market Insights and Forecast 2022-2032, USD Million
5.2.3.8. Pulp & Paper- Market Insights and Forecast 2022-2032, USD Million
5.2.3.9. Others- Market Insights and Forecast 2022-2032, USD Million
5.2.4.By Region
5.2.4.1. North America
5.2.4.2. South America
5.2.4.3. Europe
5.2.4.4. Middle East & Africa
5.2.4.5. Asia Pacific
5.2.5.By Competitors
5.2.5.1. Competition Characteristics
5.2.5.2. Market Share & Analysis
6. North America Positive Displacement Pump Market Statistics, 2022-2032F
6.1. Market Size & Growth Outlook
6.1.1.By Revenues in USD Million
6.1.2.By Units Sold in Million Units
6.2. Market Segmentation & Growth Outlook
6.2.1.By Pump Type- Market Insights and Forecast 2022-2032, USD Million
6.2.2.By Pressure Rating- Market Insights and Forecast 2022-2032, USD Million
6.2.3.By End-user Industry- Market Insights and Forecast 2022-2032, USD Million
6.2.4.By Country
6.2.4.1. US
6.2.4.2. Canada
6.2.4.3. Mexico
6.2.4.4. Rest of North America
6.3. US Positive Displacement Pump Market Statistics, 2022-2032F
6.3.1.Market Size & Growth Outlook
6.3.1.1. By Revenues in USD Million
6.3.1.2. By Units Sold in Million Units
6.3.2.Market Segmentation & Growth Outlook
6.3.2.1. By Pump Type- Market Insights and Forecast 2022-2032, USD Million
6.3.2.2. By Pressure Rating- Market Insights and Forecast 2022-2032, USD Million
6.3.2.3. By End-user Industry- Market Insights and Forecast 2022-2032, USD Million
6.4. Canada Positive Displacement Pump Market Statistics, 2022-2032F
6.4.1.Market Size & Growth Outlook
6.4.1.1. By Revenues in USD Million
6.4.1.2. By Units Sold in Million Units
6.4.2.Market Segmentation & Growth Outlook
6.4.2.1. By Pump Type- Market Insights and Forecast 2022-2032, USD Million
6.4.2.2. By Pressure Rating- Market Insights and Forecast 2022-2032, USD Million
6.4.2.3. By End-user Industry- Market Insights and Forecast 2022-2032, USD Million
6.5. Mexico Positive Displacement Pump Market Statistics, 2022-2032F
6.5.1.Market Size & Growth Outlook
6.5.1.1. By Revenues in USD Million
6.5.1.2. By Units Sold in Million Units
6.5.2.Market Segmentation & Growth Outlook
6.5.2.1. By Pump Type- Market Insights and Forecast 2022-2032, USD Million
6.5.2.2. By Pressure Rating- Market Insights and Forecast 2022-2032, USD Million
6.5.2.3. By End-user Industry- Market Insights and Forecast 2022-2032, USD Million
7. South America Positive Displacement Pump Market Statistics, 2022-2032F
7.1. Market Size & Growth Outlook
7.1.1.By Revenues in USD Million
7.1.2.By Units Sold in Million Units
7.2. Market Segmentation & Growth Outlook
7.2.1.By Pump Type- Market Insights and Forecast 2022-2032, USD Million
7.2.2.By Pressure Rating- Market Insights and Forecast 2022-2032, USD Million
7.2.3.By End-user Industry- Market Insights and Forecast 2022-2032, USD Million
7.2.4.By Country
7.2.4.1. Brazil
7.2.4.2. Argentina
7.2.4.3. Chile
7.2.4.4. Rest of South America
7.3. Brazil Positive Displacement Pump Market Statistics, 2022-2032F
7.3.1.Market Size & Growth Outlook
7.3.1.1. By Revenues in USD Million
7.3.1.2. By Units Sold in Million Units
7.3.2.Market Segmentation & Growth Outlook
7.3.2.1. By Pump Type- Market Insights and Forecast 2022-2032, USD Million
7.3.2.2. By Pressure Rating- Market Insights and Forecast 2022-2032, USD Million
7.3.2.3. By End-user Industry- Market Insights and Forecast 2022-2032, USD Million
7.4. Argentina Positive Displacement Pump Market Statistics, 2022-2032F
7.4.1.Market Size & Growth Outlook
7.4.1.1. By Revenues in USD Million
7.4.1.2. By Units Sold in Million Units
7.4.2.Market Segmentation & Growth Outlook
7.4.2.1. By Pump Type- Market Insights and Forecast 2022-2032, USD Million
7.4.2.2. By Pressure Rating- Market Insights and Forecast 2022-2032, USD Million
7.4.2.3. By End-user Industry- Market Insights and Forecast 2022-2032, USD Million
7.5. Chile Positive Displacement Pump Market Statistics, 2022-2032F
7.5.1.Market Size & Growth Outlook
7.5.1.1. By Revenues in USD Million
7.5.1.2. By Units Sold in Million Units
7.5.2.Market Segmentation & Growth Outlook
7.5.2.1. By Pump Type- Market Insights and Forecast 2022-2032, USD Million
7.5.2.2. By Pressure Rating- Market Insights and Forecast 2022-2032, USD Million
7.5.2.3. By End-user Industry- Market Insights and Forecast 2022-2032, USD Million
8. Europe Positive Displacement Pump Market Statistics, 2022-2032F
8.1. Market Size & Growth Outlook
8.1.1.By Revenues in USD Million
8.1.2.By Units Sold in Million Units
8.2. Market Segmentation & Growth Outlook
8.2.1.By Pump Type- Market Insights and Forecast 2022-2032, USD Million
8.2.2.By Pressure Rating- Market Insights and Forecast 2022-2032, USD Million
8.2.3.By End-user Industry- Market Insights and Forecast 2022-2032, USD Million
8.2.4.By Country
8.2.4.1. Germany
8.2.4.2. UK
8.2.4.3. France
8.2.4.4. Italy
8.2.4.5. Spain
8.2.4.6. Russia
8.2.4.7. Rest of Europe
8.3. Germany Positive Displacement Pump Market Statistics, 2022-2032F
8.3.1.Market Size & Growth Outlook
8.3.1.1. By Revenues in USD Million
8.3.1.2. By Units Sold in Million Units
8.3.2.Market Segmentation & Growth Outlook
8.3.2.1. By Pump Type- Market Insights and Forecast 2022-2032, USD Million
8.3.2.2. By Pressure Rating- Market Insights and Forecast 2022-2032, USD Million
8.3.2.3. By End-user Industry- Market Insights and Forecast 2022-2032, USD Million
8.4. UK Positive Displacement Pump Market Statistics, 2022-2032F
8.4.1.Market Size & Growth Outlook
8.4.1.1. By Revenues in USD Million
8.4.1.2. By Units Sold in Million Units
8.4.2.Market Segmentation & Growth Outlook
8.4.2.1. By Pump Type- Market Insights and Forecast 2022-2032, USD Million
8.4.2.2. By Pressure Rating- Market Insights and Forecast 2022-2032, USD Million
8.4.2.3. By End-user Industry- Market Insights and Forecast 2022-2032, USD Million
8.5. France Positive Displacement Pump Market Statistics, 2022-2032F
8.5.1.Market Size & Growth Outlook
8.5.1.1. By Revenues in USD Million
8.5.1.2. By Units Sold in Million Units
8.5.2.Market Segmentation & Growth Outlook
8.5.2.1. By Pump Type- Market Insights and Forecast 2022-2032, USD Million
8.5.2.2. By Pressure Rating- Market Insights and Forecast 2022-2032, USD Million
8.5.2.3. By End-user Industry- Market Insights and Forecast 2022-2032, USD Million
8.6. Italy Positive Displacement Pump Market Statistics, 2022-2032F
8.6.1.Market Size & Growth Outlook
8.6.1.1. By Revenues in USD Million
8.6.1.2. By Units Sold in Million Units
8.6.2.Market Segmentation & Growth Outlook
8.6.2.1. By Pump Type- Market Insights and Forecast 2022-2032, USD Million
8.6.2.2. By Pressure Rating- Market Insights and Forecast 2022-2032, USD Million
8.6.2.3. By End-user Industry- Market Insights and Forecast 2022-2032, USD Million
8.7. Spain Positive Displacement Pump Market Statistics, 2022-2032F
8.7.1.Market Size & Growth Outlook
8.7.1.1. By Revenues in USD Million
8.7.1.2. By Units Sold in Million Units
8.7.2.Market Segmentation & Growth Outlook
8.7.2.1. By Pump Type- Market Insights and Forecast 2022-2032, USD Million
8.7.2.2. By Pressure Rating- Market Insights and Forecast 2022-2032, USD Million
8.7.2.3. By End-user Industry- Market Insights and Forecast 2022-2032, USD Million
8.8. Russia Positive Displacement Pump Market Statistics, 2022-2032F
8.8.1.Market Size & Growth Outlook
8.8.1.1. By Revenues in USD Million
8.8.1.2. By Units Sold in Million Units
8.8.2.Market Segmentation & Growth Outlook
8.8.2.1. By Pump Type- Market Insights and Forecast 2022-2032, USD Million
8.8.2.2. By Pressure Rating- Market Insights and Forecast 2022-2032, USD Million
8.8.2.3. By End-user Industry- Market Insights and Forecast 2022-2032, USD Million
9. Middle East & Africa Positive Displacement Pump Market Statistics, 2022-2032F
9.1. Market Size & Growth Outlook
9.1.1.By Revenues in USD Million
9.1.2.By Units Sold in Million Units
9.2. Market Segmentation & Growth Outlook
9.2.1.By Pump Type- Market Insights and Forecast 2022-2032, USD Million
9.2.2.By Pressure Rating- Market Insights and Forecast 2022-2032, USD Million
9.2.3.By End-user Industry- Market Insights and Forecast 2022-2032, USD Million
9.2.4.By Country
9.2.4.1. Saudi Arabia
9.2.4.2. UAE
9.2.4.3. South Africa
9.2.4.4. Egypt
9.2.4.5. Rest of Middle East & Africa
9.3. Saudi Arabia Positive Displacement Pump Market Statistics, 2022-2032F
9.3.1.Market Size & Growth Outlook
9.3.1.1. By Revenues in USD Million
9.3.1.2. By Units Sold in Million Units
9.3.2.Market Segmentation & Growth Outlook
9.3.2.1. By Pump Type- Market Insights and Forecast 2022-2032, USD Million
9.3.2.2. By Pressure Rating- Market Insights and Forecast 2022-2032, USD Million
9.3.2.3. By End-user Industry- Market Insights and Forecast 2022-2032, USD Million
9.4. UAE Positive Displacement Pump Market Statistics, 2022-2032F
9.4.1.Market Size & Growth Outlook
9.4.1.1. By Revenues in USD Million
9.4.1.2. By Units Sold in Million Units
9.4.2.Market Segmentation & Growth Outlook
9.4.2.1. By Pump Type- Market Insights and Forecast 2022-2032, USD Million
9.4.2.2. By Pressure Rating- Market Insights and Forecast 2022-2032, USD Million
9.4.2.3. By End-user Industry- Market Insights and Forecast 2022-2032, USD Million
9.5. South Africa Positive Displacement Pump Market Statistics, 2022-2032F
9.5.1.Market Size & Growth Outlook
9.5.1.1. By Revenues in USD Million
9.5.1.2. By Units Sold in Million Units
9.5.2.Market Segmentation & Growth Outlook
9.5.2.1. By Pump Type- Market Insights and Forecast 2022-2032, USD Million
9.5.2.2. By Pressure Rating- Market Insights and Forecast 2022-2032, USD Million
9.5.2.3. By End-user Industry- Market Insights and Forecast 2022-2032, USD Million
9.6. Egypt Positive Displacement Pump Market Statistics, 2022-2032F
9.6.1.Market Size & Growth Outlook
9.6.1.1. By Revenues in USD Million
9.6.1.2. By Units Sold in Million Units
9.6.2.Market Segmentation & Growth Outlook
9.6.2.1. By Pump Type- Market Insights and Forecast 2022-2032, USD Million
9.6.2.2. By Pressure Rating- Market Insights and Forecast 2022-2032, USD Million
9.6.2.3. By End-user Industry- Market Insights and Forecast 2022-2032, USD Million
10. Asia Pacific Positive Displacement Pump Market Statistics, 2022-2032F
10.1. Market Size & Growth Outlook
10.1.1. By Revenues in USD Million
10.1.2. By Units Sold in Million Units
10.2. Market Segmentation & Growth Outlook
10.2.1. By Pump Type- Market Insights and Forecast 2022-2032, USD Million
10.2.2. By Pressure Rating- Market Insights and Forecast 2022-2032, USD Million
10.2.3. By End-user Industry- Market Insights and Forecast 2022-2032, USD Million
10.2.4. By Country
10.2.4.1. China
10.2.4.2. India
10.2.4.3. Japan
10.2.4.4. South Korea
10.2.4.5. Australia
10.2.4.6. Rest of Asia Pacific
10.3. China Positive Displacement Pump Market Statistics, 2022-2032F
10.3.1. Market Size & Growth Outlook
10.3.1.1. By Revenues in USD Million
10.3.1.2. By Units Sold in Million Units
10.3.2. Market Segmentation & Growth Outlook
10.3.2.1. By Pump Type- Market Insights and Forecast 2022-2032, USD Million
10.3.2.2. By Pressure Rating- Market Insights and Forecast 2022-2032, USD Million
10.3.2.3. By End-user Industry- Market Insights and Forecast 2022-2032, USD Million
10.4. India Positive Displacement Pump Market Statistics, 2022-2032F
10.4.1. Market Size & Growth Outlook
10.4.1.1. By Revenues in USD Million
10.4.1.2. By Units Sold in Million Units
10.4.2. Market Segmentation & Growth Outlook
10.4.2.1. By Pump Type- Market Insights and Forecast 2022-2032, USD Million
10.4.2.2. By Pressure Rating- Market Insights and Forecast 2022-2032, USD Million
10.4.2.3. By End-user Industry- Market Insights and Forecast 2022-2032, USD Million
10.5. Japan Positive Displacement Pump Market Statistics, 2022-2032F
10.5.1. Market Size & Growth Outlook
10.5.1.1. By Revenues in USD Million
10.5.1.2. By Units Sold in Million Units
10.5.2. Market Segmentation & Growth Outlook
10.5.2.1. By Pump Type- Market Insights and Forecast 2022-2032, USD Million
10.5.2.2. By Pressure Rating- Market Insights and Forecast 2022-2032, USD Million
10.5.2.3. By End-user Industry- Market Insights and Forecast 2022-2032, USD Million
10.6. South Korea Positive Displacement Pump Market Statistics, 2022-2032F
10.6.1. Market Size & Growth Outlook
10.6.1.1. By Revenues in USD Million
10.6.1.2. By Units Sold in Million Units
10.6.2. Market Segmentation & Growth Outlook
10.6.2.1. By Pump Type- Market Insights and Forecast 2022-2032, USD Million
10.6.2.2. By Pressure Rating- Market Insights and Forecast 2022-2032, USD Million
10.6.2.3. By End-user Industry- Market Insights and Forecast 2022-2032, USD Million
10.7. Australia Positive Displacement Pump Market Statistics, 2022-2032F
10.7.1. Market Size & Growth Outlook
10.7.1.1. By Revenues in USD Million
10.7.1.2. By Units Sold in Million Units
10.7.2. Market Segmentation & Growth Outlook
10.7.2.1. By Pump Type- Market Insights and Forecast 2022-2032, USD Million
10.7.2.2. By Pressure Rating- Market Insights and Forecast 2022-2032, USD Million
10.7.2.3. By End-user Industry- Market Insights and Forecast 2022-2032, USD Million
11. Competitive Outlook
11.1. Company Profiles
11.1.1. Grundfos Holding A/S
11.1.1.1. Business Description
11.1.1.2. Product Portfolio
11.1.1.3. Collaborations & Alliances
11.1.1.4. Recent Developments
11.1.1.5. Financial Details
11.1.1.6. Others
11.1.2. Xylem Inc.
11.1.2.1. Business Description
11.1.2.2. Product Portfolio
11.1.2.3. Collaborations & Alliances
11.1.2.4. Recent Developments
11.1.2.5. Financial Details
11.1.2.6. Others
11.1.3. Flowserve Corporation
11.1.3.1. Business Description
11.1.3.2. Product Portfolio
11.1.3.3. Collaborations & Alliances
11.1.3.4. Recent Developments
11.1.3.5. Financial Details
11.1.3.6. Others
11.1.4. SPX FLOW Inc.
11.1.4.1. Business Description
11.1.4.2. Product Portfolio
11.1.4.3. Collaborations & Alliances
11.1.4.4. Recent Developments
11.1.4.5. Financial Details
11.1.4.6. Others
11.1.5. IDEX Corporation
11.1.5.1. Business Description
11.1.5.2. Product Portfolio
11.1.5.3. Collaborations & Alliances
11.1.5.4. Recent Developments
11.1.5.5. Financial Details
11.1.5.6. Others
11.1.6. KSB SE & Co. KGaA
11.1.6.1. Business Description
11.1.6.2. Product Portfolio
11.1.6.3. Collaborations & Alliances
11.1.6.4. Recent Developments
11.1.6.5. Financial Details
11.1.6.6. Others
11.1.7. Sulzer Ltd.
11.1.7.1. Business Description
11.1.7.2. Product Portfolio
11.1.7.3. Collaborations & Alliances
11.1.7.4. Recent Developments
11.1.7.5. Financial Details
11.1.7.6. Others
11.1.8. Alfa Laval AB
11.1.8.1. Business Description
11.1.8.2. Product Portfolio
11.1.8.3. Collaborations & Alliances
11.1.8.4. Recent Developments
11.1.8.5. Financial Details
11.1.8.6. Others
11.1.9. Dover Corporation
11.1.9.1. Business Description
11.1.9.2. Product Portfolio
11.1.9.3. Collaborations & Alliances
11.1.9.4. Recent Developments
11.1.9.5. Financial Details
11.1.9.6. Others
11.1.10. Ingersoll Rand
11.1.10.1.Business Description
11.1.10.2.Product Portfolio
11.1.10.3.Collaborations & Alliances
11.1.10.4.Recent Developments
11.1.10.5.Financial Details
11.1.10.6.Others
11.1.11. Pentair PLC
11.1.11.1.Business Description
11.1.11.2.Product Portfolio
11.1.11.3.Collaborations & Alliances
11.1.11.4.Recent Developments
11.1.11.5.Financial Details
11.1.11.6.Others
11.1.12. NETZSCH Holding
11.1.12.1.Business Description
11.1.12.2.Product Portfolio
11.1.12.3.Collaborations & Alliances
11.1.12.4.Recent Developments
11.1.12.5.Financial Details
11.1.12.6.Others
11.1.13. Wilo SE
11.1.13.1.Business Description
11.1.13.2.Product Portfolio
11.1.13.3.Collaborations & Alliances
11.1.13.4.Recent Developments
11.1.13.5.Financial Details
11.1.13.6.Others
11.1.14. Gorman-Rupp Company
11.1.14.1.Business Description
11.1.14.2.Product Portfolio
11.1.14.3.Collaborations & Alliances
11.1.14.4.Recent Developments
11.1.14.5.Financial Details
11.1.14.6.Others
11.1.15. The Weir Group PLC
11.1.15.1.Business Description
11.1.15.2.Product Portfolio
11.1.15.3.Collaborations & Alliances
11.1.15.4.Recent Developments
11.1.15.5.Financial Details
11.1.15.6.Others
| Segment | Sub-Segment |
|---|---|
| By Pump Type |
|
| By Pressure Rating |
|
| By End-user Industry |
|
| By Region |
|
Research Methodology
This study followed a structured approach comprising four key phases to assess the size and scope of the electro-oxidation market. The process began with thorough secondary research to collect data on the target market, related markets, and broader industry context. These findings, along with preliminary assumptions and estimates, were then validated through extensive primary research involving industry experts from across the value chain. To calculate the overall market size, both top-down and bottom-up methodologies were employed. Finally, market segmentation and data triangulation techniques were applied to refine and validate segment-level estimations.
Secondary Research
The secondary research phase involved gathering data from a wide range of credible and published sources. This step helped in identifying industry trends, defining market segmentation, and understanding the market landscape and value chain.
Sources consulted during this phase included:
- Company annual reports, investor presentations, and press releases
- Industry white papers and certified publications
- Trade directories and market-recognized databases
- Articles from authoritative authors and reputable journals
- Gold and silver standard websites
Secondary research was critical in mapping out the industry's value chain and monetary flow, identifying key market segments, understanding regional variations, and tracking significant industry developments.
Other key sources:
- Financial disclosures
- Industry associations and trade bodies
- News outlets and business magazines
- Academic journals and research studies
- Paid industry databases
Primary Research
To validate secondary data and gain deeper market insights, primary research was conducted with key stakeholders across both the supply and demand sides of the market.
On the demand side, participants included decision-makers and influencers from end-user industries—such as CIOs, CTOs, and CSOs—who provided first-hand perspectives on market needs, product usage, and future expectations.
On the supply side, interviews were conducted with manufacturers, industry associations, and institutional participants to gather insights into current offerings, product pipelines, and market challenges.
Primary interviews provided critical inputs such as:
- Market size and revenue data
- Product and service breakdowns
- Market forecasts
- Regional and application-specific trends
Stakeholders consulted included:
- Leading OEM and solution providers
- Channel and distribution partners
- End users across various applications
- Independent consultants and industry specialists
Market Size Estimation and Data Triangulation
- Identifying Key Market Participants (Secondary Research)
- Goal: To identify the major players or companies in the target market. This typically involves using publicly available data sources such as industry reports, market research publications, and financial statements of companies.
- Tools: Reports from firms like Gartner, Forrester, Euromonitor, Statista, IBISWorld, and others. Public financial statements, news articles, and press releases from top market players.
- Extracting Earnings of Key Market Participants
- Goal: To estimate the earnings generated from the product or service being analyzed. This step helps in understanding the revenue potential of each market player in a specific geography.
- Methods: Earnings data can be gathered from:
- Publicly available financial reports (for listed companies).
- Interviews and primary data sources from professionals, such as Directors, VPs, SVPs, etc. This is especially useful for understanding more nuanced, internal data that isn't publicly disclosed.
- Annual reports and investor presentations of key players.
- Data Collation and Development of a Relevant Data Model
- Goal: To collate inputs from both primary and secondary sources into a structured, data-driven model for market estimation. This model will incorporate key market KPIs and any independent variables relevant to the market.
- Key KPIs: These could include:
- Market size, growth rate, and demand drivers.
- Industry-specific metrics like market share, average revenue per customer (ARPC), or average deal size.
- External variables, such as economic growth rates, inflation rates, or commodity prices, that could affect the market.
- Data Modeling: Based on this data, the market forecasts are developed for the next 5 years. A combination of trend analysis, scenario modeling, and statistical regression might be used to generate projections.
- Scenario Analysis
- Goal: To test different assumptions and validate how sensitive the market is to changes in key variables (e.g., market demand, regulatory changes, technological disruptions).
- Types of Scenarios:
- Base Case: Based on current assumptions and historical data.
- Best-Case Scenario: Assuming favorable market conditions, regulatory environments, and technological advancements.
- Worst-Case Scenario: Accounting for adverse factors, such as economic downturns, stricter regulations, or unexpected disruptions.


