Middle East & Africa Positive Displacement Pump Market Report: Trends, Growth and Forecast (2026-2032)
By Pump Type (Reciprocating Pump (Piston, Plunger, Diaphragm), Rotary Pump (Gear, Screw, Lobe, Vane), Peristaltic Pump), By Pressure Rating (Up to 50 bar, 51 to 150 bar, Above 150 bar), By End-user Industry (Oil & Gas, Power Generation, Water & Wastewater, Chemical & Petrochemical, Food & Beverage, Pharmaceutical & Biotechnology, Mining & Minerals, Pulp & Paper, Others), By Country (Saudi Arabia, UAE, South Africa, Egypt, Rest of Middle East and Africa) ... Read more
|
Major Players
|
Middle East & Africa Positive Displacement Pump Market Statistics and Insights, 2026
- Market Size Statistics
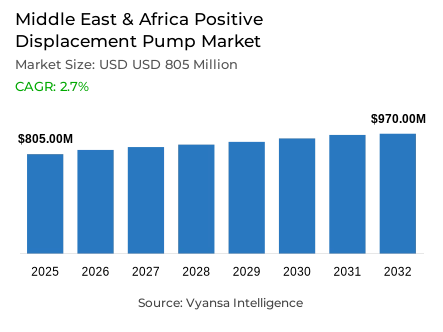
- Middle East & Africa positive displacement pump market is estimated at USD 805 million in 2025.
- The market size is expected to grow to USD 970 million by 2032.
- Market to register a cagr of around 2.7% during 2026-32.
- Pump Type Shares
- Rotary pump grabbed market share of 50%.
- Competition
- Positive displacement pump in Middle East & Africa is currently being catered to by more than 10 companies.
- Top 5 companies acquired around 50% of the market share.
- Flowserve Corporation; Grundfos Holding A/S; Schlumberger Limited; Dover Corporation; Ingersoll Rand Inc. etc., are few of the top companies.
- Pressure Rating
- Above 150 bar grabbed 40% of the market.
- Country
- Saudi Arabia leads with a 20% share of the Middle East & Africa market.
Middle East & Africa Positive Displacement Pump Market Outlook
The Middle East and Africa positive displacement pump market is estimated at USD 805 million in 2025 and is expected to be worth about USD 970 million in 2032 with a constant compound annual growth rate of about 2.7% in 2026-32. This expansion indicates a stable demand environment as opposed to a fast growth, which is backed by long-term capital investment in oil and gas and water infrastructure. The interplay between energy-security concerns and the increasing water demands gives the pump demand a solid foundation, which gives suppliers a fair amount of visibility over the forecast horizon.
The market is heavily supported by upstream oil and gas investment. In 2025, about 130 billion dollars are being invested in upstream projects in the region, with Saudi Arabia investing nearly 40 billion dollars per year. These projects demand positive displacement pumps that can accommodate high-viscosity crude, abrasive fluids, and variable pressure conditions. These technical needs prefer established pump technologies that are durable and stable in performance, hence stabilizing demand despite changes in commodity prices.
Additionally the investment in water infrastructure is another driving force for the market. The governments in the region have estimated over 110 billion capital requirements in desalination, wastewater treatment, and irrigation upgrades. With the growth of desalination capacity and the prevalence of reverse osmosis, pumps with high-pressure operation and accurate flow control are becoming more and more necessary. At the same time, the imbalance in wastewater treatment performance creates difficult operating conditions, maintenance requirements, and supports the demand of strong pump systems.
Rotary pumps represent about 50% of the market because they are used in viscous and abrasive applications, and systems with a rating over 150 bar represent about 40% of the total value, due to the demand in high-pressure oil and desalination projects. Saudi Arabia dominates the regional market with approximately 20% share, which is due to its combined investment in energy and water infrastructure, hence stabilizing the overall market until 2032.

Middle East & Africa Positive Displacement Pump Market Growth Driver
Sustained Capital Deployment Across Energy and Water Infrastructure
The positive-displacement pump market in the Middle East and Africa is maintained through the coordinated capital investment in both upstream hydrocarbons and water infrastructure, thus creating a long-term demand base. The region is investing about USD 130 billion in upstream oil and gas in 2025, which is about 15% of the world capital expenditure with Saudi Arabia alone investing almost USD 40 billion per year. This continuous upstream operation requires positive-displacement pump systems that can operate under high-viscosity crude, abrasive production fluids, and variable pressure conditions in both onshore and offshore developments. The magnitude and sustainability of these investments provide equipment suppliers with long-term visibility that is not as vulnerable to short-term commodity price fluctuations.
Simultaneously, governments in the region have found USD 110.8 billion in capital needs of desalination, wastewater treatment, and modernization of irrigation. These investments in the water sector create the need of pumps that aid reverse osmosis desalination, sludge management, and accurate chemical dosing. The energy and water infrastructure program overlap anchors pump procurement in various end-user sectors, which enhances market resilience over the 2026-2032 horizon.
Middle East & Africa Positive Displacement Pump Market Challenge
Infrastructure Fragmentation and Treatment Efficiency Limitations
Although there is a significant capacity increase, the inefficiency of operations in water-treatment systems limits the integration of the entire infrastructure in the Middle East and Africa positive-displacement pump market. The capacity of desalination in the region increased to approximately 52 million cubic metres per day in 2024, compared to approximately 40 million cubic metres per day in 2020, but the performance of wastewater-treatment is not even. The treatment of domestic wastewater produced in the MENA region is only done to national safety standards in about 76% of the total wastewater produced in the region, leaving a huge service gap that directly impacts the pump operating conditions. Poor influent water quality causes accelerated equipment wear, higher frequency of maintenance and higher overall cost of ownership to the end users.
The development of infrastructure in fragments also restricts optimisation of the system and coordinated procurement. Facilities are usually independent, which means that they do not enjoy economies of scale and postpones the adoption of standardised technology. As a result, operators often focus on increasing treatment coverage and regulatory compliance rather than investing in sophisticated pump systems. These limitations delay the replacement cycles and delay the adoption of more efficient technologies until larger infrastructure shortages are addressed.
Unlock Market Intelligence
Explore the market potential with our data-driven report
Middle East & Africa Positive Displacement Pump Market Trend
Shift Toward Energy-Efficient and Digitally Managed Desalination
The shift in technology in desalination infrastructure is transforming the procurement focus in the Middle East and Africa positive-displacement pump market. In countries like the UAE and Oman, reverse osmosis has become the dominant choice in new desalination plants, with over 60% of new plants now using this technology, a clear shift away from energy-intensive thermal processes. Energy efficiency and operational precision have become central performance indicators, with national plans, such as pledges to obtain a large portion of desalinated water through renewables by 2030, making them central. The positive-displacement pumps are now required to provide constant flow control and pressure regulation of over 150 bar to accommodate the advanced membrane systems.
This shift encourages the replacement of capital because new membrane technologies can provide 15-20% energy savings over older equipment. End users are moving towards pumps with digital monitoring, predictive maintenance, and modular designs that support low-carbon operational objectives. With efficiency and reliability becoming key points of difference, more highly specified equipment replaces lower-priced options in both new and retrofit projects.
Middle East & Africa Positive Displacement Pump Market Opportunity
Expanding Water Security Financing Unlocks Long-Term Growth
An expanding water-security financing channel opens up distinct growth opportunities in the Middle East and Africa positive-displacement pump market. By 2030, Africa alone needs an estimated extra US 30 billion a year to fill water supply and sanitation gaps, which underscores a structural investment shortfall. In 2024, multilateral development banks sanctioned US 19.6 billion in water-related funding, most of which was channeled to low- and middle-income economies. Governments in the MENA region have already estimated US 110.8 billion in financing of desalination, wastewater treatment and irrigation systems, and overall requirements may reach US 500 billion when climate adaptation and renewable integration are factored in. This financing trend promotes the demand of modular and cost-effective pump solutions that can be used in various operating conditions. Manufacturers with localised service networks, flexible payment systems in line with project financing, and equipment tailored to different salinity and operating conditions have the best opportunities. These capabilities place suppliers in a position to be involved in both large-scale urban projects and decentralised installations.
Middle East & Africa Positive Displacement Pump Market Country Analysis
By Country
- Saudi Arabia
- UAE
- South Africa
- Egypt
- Rest of Middle East and Africa
Country-level analysis positions Saudi Arabia as the largest market of the Middle East & Africa positive displacement pump market, accounting for about 20% of regional demand. This dominance is directly linked to the kingdom’s $40 billion annual upstream oil and gas investment and its leadership in desalination infrastructure, which represents approximately 36% of regional capacity. Integrated development of energy and water systems generates simultaneous demand for pumps across extraction, processing, and distribution applications.
Large-scale facilities such as Ras Al Khair and Shuaibah create concentrated procurement volumes and standardized technical requirements, resulting in predictable ordering patterns and structured replacement cycles. For manufacturers, this scale provides revenue visibility and planning advantages unmatched elsewhere in the region. Other Middle Eastern and African economies lack comparable capital intensity or infrastructure integration, reinforcing Saudi Arabia’s central role through the 2026-2032 horizon.
Unlock Market Intelligence
Explore the market potential with our data-driven report
Middle East & Africa Positive Displacement Pump Market Segmentation Analysis
By Pump Type
- Reciprocating Pump
- Piston
- Plunger
- Diaphragm
- Rotary Pump
- Gear
- Screw
- Lobe
- Vane
- Peristaltic Pump
Within the Middle East & Africa positive displacement pump market, rotary pumps command the largest share at approximately 50%, reflecting their technical suitability for regional operating conditions. These configurations excel in handling high-viscosity crude oils, abrasive drilling fluids, and multiphase production streams common in upstream oil and gas operations across the Arabian Gulf and Red Sea. Rotary pumps maintain consistent displacement under fluctuating pressures, reducing failure rates and downtime compared with alternative designs when exposed to sand and particulate-heavy fluids.
For end users prioritizing production uptime, this reliability translates directly into lower total cost of ownership. Established performance advantages have positioned rotary pumps as the preferred standard across upstream developments, reinforcing manufacturing scale and supply chain efficiencies. Competing pump types remain confined to specialized niches such as precision metering or narrow viscosity ranges, limiting their ability to erode rotary pump leadership during the forecast period.

By Pressure Rating
- Up to 50 bar
- 51 to 150 bar
- Above 150 bar
Pressure rating segmentation highlights a clear value concentration within the Middle East & Africa positive displacement pump market. Systems rated above 150 bar account for roughly 40% of total market value, underscoring strong demand from high-intensity applications including deepwater exploration, enhanced oil recovery, and industrial-scale reverse osmosis desalination. These applications inherently require elevated operating pressures to achieve target production rates and treatment throughput, driving demand for advanced engineering, specialized materials, and stringent quality standards.
The premium associated with high-pressure systems reflects both technical complexity and criticality to operations. Large oil producers and major water utilities dominate demand in this segment, while smaller operators typically rely on sub-150 bar equipment with lower capital costs. This bifurcation creates distinct competitive dynamics, separating suppliers focused on high-performance engineering from those pursuing volume-driven strategies in lower-pressure applications.
Various Market Players in Middle East & Africa Positive Displacement Pump Market
The companies mentioned below are highly active in the Middle East & Africa positive displacement pump market, occupying a considerable portion of the market and shaping industry progress.
- Flowserve Corporation
- Grundfos Holding A/S
- Schlumberger Limited
- Dover Corporation
- Ingersoll Rand Inc.
- Alfa Laval AB
- Gorman-Rupp Company
- Watson-Marlow Fluid Technology Solutions
- Sulzer Ltd.
- KSB SE & Co. KGaA
- Pentair PLC
- SPX FLOW Inc.
Market News & Updates
- Watson-Marlow Fluid Technology Solutions, 2025:
Watson-Marlow Fluid Technology Solutions presented comprehensive peristaltic pump and niche fluid handling solutions at CPHI Frankfurt 2025 (October 28-30) targeting biopharmaceutical applications across the MENA region, showcasing peristaltic cased pumps achieving accuracy to ±0.5% for qualified bioprocessing duties, DriveSure® panel mount solutions for OEM automation requirements, and WMArchitect™ single-use assemblies addressing sterile fill/finish requirements essential to pharmaceutical manufacturing. The company's Qdos Conveying Wave Technology (CWT) pump achieved a documented 97.5% phosphorus load reduction rate at the Fürstenhagen wastewater treatment plant in Germany, demonstrating measurable environmental performance benefits—a reference case directly applicable to regional water quality and environmental compliance standards. Watson-Marlow's APAC operations expanded to 13+ regional sales offices supporting life sciences, food & beverage, chemical, and medical device sectors, with DriveSure panel solutions providing deployment flexibility for OEM automation needs across MENA's growing pharmaceutical and biotech infrastructure.
- Alfa Laval AB, 2025:
Alfa Laval deployed its DuraCirc® circumferential piston pump across industrial fluid handling applications in the MENA region, featuring the distinctive oil-filled bearing design that eliminates weekly grease injection requirements and delivers 40 bar (580 psi) pressure capability with superior volumetric efficiency. The company simultaneously marketed its OptiLobe and SRU rotary lobe pumps specifically for hygienic, low-maintenance operation across food processing and pharmaceutical sectors in the region. The SRU maintains market leadership with L10 bearing life of minimum 20,000 hours, flow rates to 106 m³/h, pressures to 20 bar, operating temperatures to 200°C with modular designs offering 12 displacement options—providing regional customers with application flexibility from standard dairy and beverage processing to specialized pharmaceutical and biotechnology applications where gentle product handling and process reliability directly impact product yield and regulatory compliance.
Frequently Asked Questions
Related Report
1. Market Segmentation
1.1. Research Scope
1.2. Research Methodology
1.3. Definitions and Assumptions
2. Executive Summary
3. Middle East and Africa Positive Displacement Pump Market Policies, Regulations, and Standards
4. Middle East and Africa Positive Displacement Pump Market Dynamics
4.1. Growth Factors
4.2. Challenges
4.3. Trends
4.4. Opportunities
5. Middle East and Africa Positive Displacement Pump Market Statistics, 2022-2032F
5.1. Market Size & Growth Outlook
5.1.1.By Revenues in USD Million
5.1.2.By Units Sold in Million Units
5.2. Market Segmentation & Growth Outlook
5.2.1.By Pump Type
5.2.1.1. Reciprocating Pump- Market Insights and Forecast 2022-2032, USD Million
5.2.1.1.1. Piston- Market Insights and Forecast 2022-2032, USD Million
5.2.1.1.2. Plunger- Market Insights and Forecast 2022-2032, USD Million
5.2.1.1.3. Diaphragm- Market Insights and Forecast 2022-2032, USD Million
5.2.1.2. Rotary Pump- Market Insights and Forecast 2022-2032, USD Million
5.2.1.2.1. Gear- Market Insights and Forecast 2022-2032, USD Million
5.2.1.2.2. Screw- Market Insights and Forecast 2022-2032, USD Million
5.2.1.2.3. Lobe- Market Insights and Forecast 2022-2032, USD Million
5.2.1.2.4. Vane- Market Insights and Forecast 2022-2032, USD Million
5.2.1.3. Peristaltic Pump- Market Insights and Forecast 2022-2032, USD Million
5.2.2.By Pressure Rating
5.2.2.1. Up to 50 bar- Market Insights and Forecast 2022-2032, USD Million
5.2.2.2. 51 to 150 bar- Market Insights and Forecast 2022-2032, USD Million
5.2.2.3. Above 150 bar- Market Insights and Forecast 2022-2032, USD Million
5.2.3.By End-user Industry
5.2.3.1. Oil & Gas- Market Insights and Forecast 2022-2032, USD Million
5.2.3.2. Power Generation- Market Insights and Forecast 2022-2032, USD Million
5.2.3.3. Water & Wastewater- Market Insights and Forecast 2022-2032, USD Million
5.2.3.4. Chemical & Petrochemical- Market Insights and Forecast 2022-2032, USD Million
5.2.3.5. Food & Beverage- Market Insights and Forecast 2022-2032, USD Million
5.2.3.6. Pharmaceutical & Biotechnology- Market Insights and Forecast 2022-2032, USD Million
5.2.3.7. Mining & Minerals- Market Insights and Forecast 2022-2032, USD Million
5.2.3.8. Pulp & Paper- Market Insights and Forecast 2022-2032, USD Million
5.2.3.9. Others- Market Insights and Forecast 2022-2032, USD Million
5.2.4.By Country
5.2.4.1. Saudi Arabia
5.2.4.2. UAE
5.2.4.3. South Africa
5.2.4.4. Egypt
5.2.4.5. Rest of Middle East and Africa
5.2.5.By Competitors
5.2.5.1. Competition Characteristics
5.2.5.2. Market Share & Analysis
6. Saudi Arabia Positive Displacement Pump Market Statistics, 2022-2032F
6.1. Market Size & Growth Outlook
6.1.1.By Revenues in USD Million
6.1.2.By Units Sold in Million Units
6.2. Market Segmentation & Growth Outlook
6.2.1.By Pump Type- Market Insights and Forecast 2022-2032, USD Million
6.2.2.By Pressure Rating- Market Insights and Forecast 2022-2032, USD Million
6.2.3.By End-user Industry- Market Insights and Forecast 2022-2032, USD Million
7. UAE Positive Displacement Pump Market Statistics, 2022-2032F
7.1. Market Size & Growth Outlook
7.1.1.By Revenues in USD Million
7.1.2.By Units Sold in Million Units
7.2. Market Segmentation & Growth Outlook
7.2.1.By Pump Type- Market Insights and Forecast 2022-2032, USD Million
7.2.2.By Pressure Rating- Market Insights and Forecast 2022-2032, USD Million
7.2.3.By End-user Industry- Market Insights and Forecast 2022-2032, USD Million
8. South Africa Positive Displacement Pump Market Statistics, 2022-2032F
8.1. Market Size & Growth Outlook
8.1.1.By Revenues in USD Million
8.1.2.By Units Sold in Million Units
8.2. Market Segmentation & Growth Outlook
8.2.1.By Pump Type- Market Insights and Forecast 2022-2032, USD Million
8.2.2.By Pressure Rating- Market Insights and Forecast 2022-2032, USD Million
8.2.3.By End-user Industry- Market Insights and Forecast 2022-2032, USD Million
9. Egypt Positive Displacement Pump Market Statistics, 2022-2032F
9.1. Market Size & Growth Outlook
9.1.1.By Revenues in USD Million
9.1.2.By Units Sold in Million Units
9.2. Market Segmentation & Growth Outlook
9.2.1.By Pump Type- Market Insights and Forecast 2022-2032, USD Million
9.2.2.By Pressure Rating- Market Insights and Forecast 2022-2032, USD Million
9.2.3.By End-user Industry- Market Insights and Forecast 2022-2032, USD Million
10. Competitive Outlook
10.1. Company Profiles
10.1.1. Dover Corporation
10.1.1.1. Business Description
10.1.1.2. Product Portfolio
10.1.1.3. Collaborations & Alliances
10.1.1.4. Recent Developments
10.1.1.5. Financial Details
10.1.1.6. Others
10.1.2. Ingersoll Rand Inc.
10.1.2.1. Business Description
10.1.2.2. Product Portfolio
10.1.2.3. Collaborations & Alliances
10.1.2.4. Recent Developments
10.1.2.5. Financial Details
10.1.2.6. Others
10.1.3. Alfa Laval AB
10.1.3.1. Business Description
10.1.3.2. Product Portfolio
10.1.3.3. Collaborations & Alliances
10.1.3.4. Recent Developments
10.1.3.5. Financial Details
10.1.3.6. Others
10.1.4. Gorman-Rupp Company
10.1.4.1. Business Description
10.1.4.2. Product Portfolio
10.1.4.3. Collaborations & Alliances
10.1.4.4. Recent Developments
10.1.4.5. Financial Details
10.1.4.6. Others
10.1.5. Watson-Marlow Fluid Technology Solutions
10.1.5.1. Business Description
10.1.5.2. Product Portfolio
10.1.5.3. Collaborations & Alliances
10.1.5.4. Recent Developments
10.1.5.5. Financial Details
10.1.5.6. Others
10.1.6. Flowserve Corporation
10.1.6.1. Business Description
10.1.6.2. Product Portfolio
10.1.6.3. Collaborations & Alliances
10.1.6.4. Recent Developments
10.1.6.5. Financial Details
10.1.6.6. Others
10.1.7. Grundfos Holding A/S
10.1.7.1. Business Description
10.1.7.2. Product Portfolio
10.1.7.3. Collaborations & Alliances
10.1.7.4. Recent Developments
10.1.7.5. Financial Details
10.1.7.6. Others
10.1.8. Schlumberger Limited
10.1.8.1. Business Description
10.1.8.2. Product Portfolio
10.1.8.3. Collaborations & Alliances
10.1.8.4. Recent Developments
10.1.8.5. Financial Details
10.1.8.6. Others
10.1.9. Sulzer Ltd.
10.1.9.1. Business Description
10.1.9.2. Product Portfolio
10.1.9.3. Collaborations & Alliances
10.1.9.4. Recent Developments
10.1.9.5. Financial Details
10.1.9.6. Others
10.1.10. KSB SE & Co. KGaA
10.1.10.1.Business Description
10.1.10.2.Product Portfolio
10.1.10.3.Collaborations & Alliances
10.1.10.4.Recent Developments
10.1.10.5.Financial Details
10.1.10.6.Others
10.1.11. Pentair PLC
10.1.11.1.Business Description
10.1.11.2.Product Portfolio
10.1.11.3.Collaborations & Alliances
10.1.11.4.Recent Developments
10.1.11.5.Financial Details
10.1.11.6.Others
10.1.12. SPX FLOW Inc.
10.1.12.1.Business Description
10.1.12.2.Product Portfolio
10.1.12.3.Collaborations & Alliances
10.1.12.4.Recent Developments
10.1.12.5.Financial Details
10.1.12.6.Others
11. Disclaimer
| Segment | Sub-Segment |
|---|---|
| By Pump Type |
|
| By Pressure Rating |
|
| By End-user Industry |
|
| By Country |
|
Research Methodology
This study followed a structured approach comprising four key phases to assess the size and scope of the electro-oxidation market. The process began with thorough secondary research to collect data on the target market, related markets, and broader industry context. These findings, along with preliminary assumptions and estimates, were then validated through extensive primary research involving industry experts from across the value chain. To calculate the overall market size, both top-down and bottom-up methodologies were employed. Finally, market segmentation and data triangulation techniques were applied to refine and validate segment-level estimations.
Secondary Research
The secondary research phase involved gathering data from a wide range of credible and published sources. This step helped in identifying industry trends, defining market segmentation, and understanding the market landscape and value chain.
Sources consulted during this phase included:
- Company annual reports, investor presentations, and press releases
- Industry white papers and certified publications
- Trade directories and market-recognized databases
- Articles from authoritative authors and reputable journals
- Gold and silver standard websites
Secondary research was critical in mapping out the industry's value chain and monetary flow, identifying key market segments, understanding regional variations, and tracking significant industry developments.
Other key sources:
- Financial disclosures
- Industry associations and trade bodies
- News outlets and business magazines
- Academic journals and research studies
- Paid industry databases
Primary Research
To validate secondary data and gain deeper market insights, primary research was conducted with key stakeholders across both the supply and demand sides of the market.
On the demand side, participants included decision-makers and influencers from end-user industries—such as CIOs, CTOs, and CSOs—who provided first-hand perspectives on market needs, product usage, and future expectations.
On the supply side, interviews were conducted with manufacturers, industry associations, and institutional participants to gather insights into current offerings, product pipelines, and market challenges.
Primary interviews provided critical inputs such as:
- Market size and revenue data
- Product and service breakdowns
- Market forecasts
- Regional and application-specific trends
Stakeholders consulted included:
- Leading OEM and solution providers
- Channel and distribution partners
- End users across various applications
- Independent consultants and industry specialists
Market Size Estimation and Data Triangulation
- Identifying Key Market Participants (Secondary Research)
- Goal: To identify the major players or companies in the target market. This typically involves using publicly available data sources such as industry reports, market research publications, and financial statements of companies.
- Tools: Reports from firms like Gartner, Forrester, Euromonitor, Statista, IBISWorld, and others. Public financial statements, news articles, and press releases from top market players.
- Extracting Earnings of Key Market Participants
- Goal: To estimate the earnings generated from the product or service being analyzed. This step helps in understanding the revenue potential of each market player in a specific geography.
- Methods: Earnings data can be gathered from:
- Publicly available financial reports (for listed companies).
- Interviews and primary data sources from professionals, such as Directors, VPs, SVPs, etc. This is especially useful for understanding more nuanced, internal data that isn't publicly disclosed.
- Annual reports and investor presentations of key players.
- Data Collation and Development of a Relevant Data Model
- Goal: To collate inputs from both primary and secondary sources into a structured, data-driven model for market estimation. This model will incorporate key market KPIs and any independent variables relevant to the market.
- Key KPIs: These could include:
- Market size, growth rate, and demand drivers.
- Industry-specific metrics like market share, average revenue per customer (ARPC), or average deal size.
- External variables, such as economic growth rates, inflation rates, or commodity prices, that could affect the market.
- Data Modeling: Based on this data, the market forecasts are developed for the next 5 years. A combination of trend analysis, scenario modeling, and statistical regression might be used to generate projections.
- Scenario Analysis
- Goal: To test different assumptions and validate how sensitive the market is to changes in key variables (e.g., market demand, regulatory changes, technological disruptions).
- Types of Scenarios:
- Base Case: Based on current assumptions and historical data.
- Best-Case Scenario: Assuming favorable market conditions, regulatory environments, and technological advancements.
- Worst-Case Scenario: Accounting for adverse factors, such as economic downturns, stricter regulations, or unexpected disruptions.


