US Skin Care Market Report: Trends, Growth and Forecast (2025-2030)
By Product (Body Care, Facial Care, Hand Care, Skin Care Sets/Kits), By Category (Premium, Mass), By Gender (Men, Women, Unisex), By End User (Adults, Teenagers, Children), By Packaging (Tubes, Bottles, Jars, Others), By Sales Channel (Online, Offline) ... Read more

|
Major Players
|
US Skin Care Market Statistics, 2025
- Market Size Statistics
- Skin Care in US is estimated at $ 29.33 Billion.
- The market size is expected to grow to $ 29.59 Billion by 2030.
- Market to register a CAGR of around 0.15% during 2025-30.
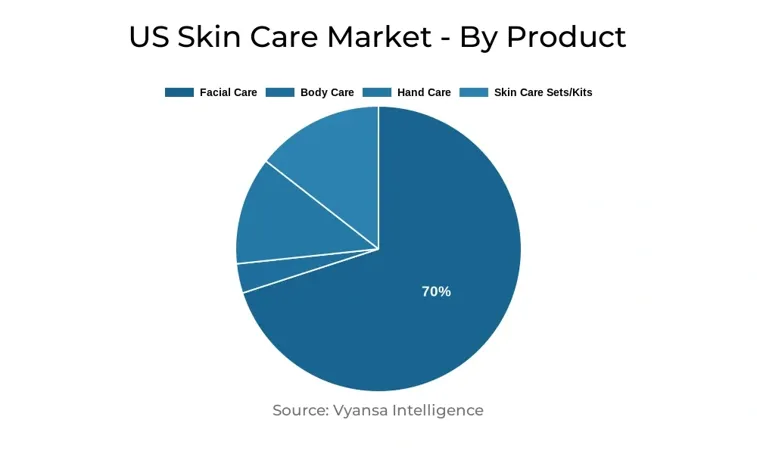
- Product Shares
- Facial Care grabbed market share of 70%.
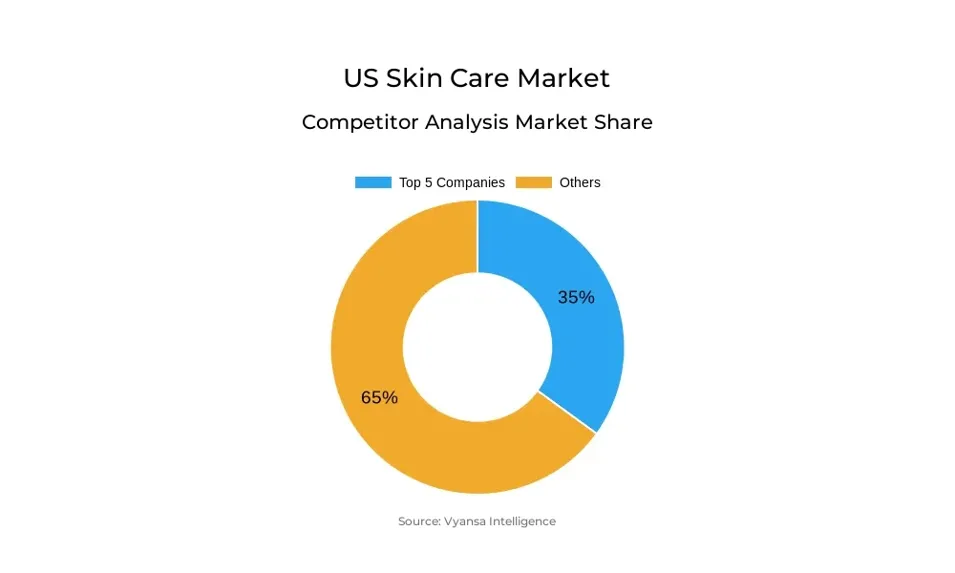
- Competition
- More than 20 companies are actively engaged in producing Skin Care in US.
- Top 5 companies acquired 35% of the market share.
- Beiersdorf Inc, Unilever Home & Personal Care USA, Mary Kay Inc, L'Oréal USA Inc, Johnson & Johnson Consumer Products Inc etc., are few of the top companies.
- Sales Channel
- Retail Offline grabbed 51% of the market.
US Skin Care Market Outlook
The US skin care market is projected to grow modestly between 2025 and 2030 after a period of slowdown and normalisation. Following the high growth recorded in previous years, the market is settling as consumers rationalise their regimens and exercise greater prudence in spending. Though growth in total value is expected to be minimal in constant terms, interest in skin health continues to be high, with most consumers still regarding steady routines as their overall well-being.
Expansion will be led by smaller but vibrant categories like body care, acne treatments, and lip care. These segments remain to witness innovation, with brands incorporating trendy facial care actives such as niacinamide and squalene into new body formats. Core categories like moisturisers and facial cleansers, on the other hand, can experience limited expansion, as shoppers down-trade to more budget-friendly versions that equally provide effective results.
Healthy ageing is expected to become increasingly prominent, driving demand for scientifically supported, clinical, ingredient-driven, and personalised products. Brands providing scientifically supported claims, such as those containing collagen, vitamin C, or patented ingredients, will find appeal among consumers looking for long-term skin enhancement. Personalised technological advances, including skin analysis tools, are also poised to make an impact.
Online platforms will keep transforming the market by increasing access to global brands. Korean beauty products, especially, are increasingly popular with their emphasis on skin health and affordability. Increased availability online and in new US retail channels will continue to heighten competition and sway purchasing decisions in the coming years.
US Skin Care Market Challenge
Over the next few years, consumers are likely to engage in more risk-averse and strategic buying behavior as a result of economic uncertainty, increasing living expenses, and possible tariff threats. This will likely temper overall growth in the skin care industry. Although regular beauty regimens continue to be crucial for wellbeing and self-esteem—finds a poll—consumers are switchings down to masstige or entry-premiums that provide comparable benefits to the high-end brands. It could lead to a reduced growth gap between premium and mass segments.
While skin care is anticipated to resume marginal growth following declines in 2025 and 2026, it will be more sluggish than prior years as consumption returns to normal. Niche categories like moisturisers, treatments, and facial cleansers are projected to expand at a slower rate. Nonetheless, niche categories including body care, acne treatments, and lip care will be more resilient on account of ongoing innovation in ingredients, functionalities, and product forms.
US Skin Care Market Trend
Post-2025, American consumers are predicted to further move towards ingredient-driven and dermocosmetic skin care, fueled by a heightened interest in ageing well and long-term health. Although dermocosmetic brands are still favored for their science-driven efficacy, they are under growing pressure from ingredient-driven players such as The Ordinary and COSRX. Even industry giants such as Neutrogena experienced value drop in 2024 and retaliated by introducing collagen-based products and TikTok campaigns aimed at Gen Z.
The emphasis on longevity is driving innovation throughout the category, particularly in prestige brands. In a recent survey, US consumers became less accepting of paying more for premium ingredients, so brands are doubling down on distinction through unique ingredients and customized offerings. This trend is being led by brands such as The Whoo and L'Oréal with innovations such as NAD+ complexes and intelligent diagnostic devices, enabling consumers to actively tackle ageing and skin wellness.
Unlock Market Intelligence
Explore the market potential with our data-driven report
US Skin Care Market Opportunity
The increasing digitalization of beauty retail is likely to increase the availability of international beauty brands in the US, particularly Korean beauty (K-beauty) brands. The brands are becoming increasingly popular due to their new-age ingredients, skin wellness orientation, and affordable pricing. Social media platforms like TikTok have enabled brands like COSRX, Medicube, Laneige, Innisfree, and Beauty of Joseon to reach out to US consumers. Amazon too has been a factor behind this growth, with K-beauty brands often appearing high on Prime Day sales.
In accordance with a study, Korean beauty firms will be diverting attention to strategic markets like the US as others like China slow down. AmorePacific is deepening collaboration with retailers such as Sephora and Amazon and will grow its presence in platforms such as TikTok Shop. Olive Young, a leading South Korean beauty retailer, will have its first US store in 2025 to further back the expansion of its popularity.
| Report Coverage | Details |
|---|---|
| Market Forecast | 2025-30 |
| USD Value 2024 | $ 29.33 Billion |
| USD Value 2030 | $ 29.59 Billion |
| CAGR 2025-2030 | 0.15% |
| Largest Category | Facial Care segment leads with 70% market share |
| Top Challenges | Rising Economic Pressures to Challenge Growth and Consumer Loyalty |
| Top Trends | Rising Demand for Ingredient-Led and Clinical Skin Care Solutions |
| Top Opportunities | Rising Global Accessibility to Drive Competitive Edge |
| Key Players | Beiersdorf Inc, Unilever Home & Personal Care USA, Mary Kay Inc, L'Oréal USA Inc, Johnson & Johnson Consumer Products Inc, Estée Lauder Cos Inc, Procter & Gamble Co, The, Bath & Body Works Inc, Shiseido Americas Corp, Galderma Laboratories Inc and Others. |
Unlock Market Intelligence
Explore the market potential with our data-driven report
US Skin Care Market Segmentation Analysis
The value sales channel segment with the biggest market share is Retail Offline, which barely held onto its position as leader in the US skin care market in 2024, claiming 51% value sales, compared to 71% in 2020. Department stores and pharmacies, two of the most important parts of offline retailing, have kept on struggling. Department stores have been unable to keep up with shifting consumer trends and the implementation of omnichannel approaches from large-box stores such as Walmart and Target. Their concentration on high-end brands has also come into conflict with consumers increasingly seeking out more budget-friendly choices. Pharmacies, for all their association with wellness, have suffered similarly through store closures and unpleasant shopping experiences.
Conversely, Retail E-commerce has continued to gain share, thanks to the convenience of buying online and the power of platforms such as TikTok. Based on research, companies such as Clinique and Estée Lauder extended their presence online through Amazon storefronts, accepting the change in customer behaviour.
Top Companies in US Skin Care Market
The top companies operating in the market include Beiersdorf Inc, Unilever Home & Personal Care USA, Mary Kay Inc, L'Oréal USA Inc, Johnson & Johnson Consumer Products Inc, Estée Lauder Cos Inc, Procter & Gamble Co, The, Bath & Body Works Inc, Shiseido Americas Corp, Galderma Laboratories Inc, etc., are the top players operating in the US Skin Care Market.
Frequently Asked Questions
Related Report
1. Market Segmentation
1.1. Research Scope
1.2. Research Methodology
1.3. Definitions and Assumptions
2. Executive Summary
3. US Skin Care Market Policies, Regulations, and Standards
4. US Skin Care Market Dynamics
4.1. Growth Factors
4.2. Challenges
4.3. Trends
4.4. Opportunities
5. US Skin Care Market Statistics, 2020-2030F
5.1. Market Size & Growth Outlook
5.1.1.By Revenues in US$ Million
5.2. Market Segmentation & Growth Outlook
5.2.1.By Product
5.2.1.1. Body Care- Market Insights and Forecast 2020-2030, USD Million
5.2.1.1.1. Firming Body Care- Market Insights and Forecast 2020-2030, USD Million
5.2.1.1.2. General Purpose Body Care- Market Insights and Forecast 2020-2030, USD Million
5.2.1.2. Facial Care- Market Insights and Forecast 2020-2030, USD Million
5.2.1.2.1. Acne Treatments- Market Insights and Forecast 2020-2030, USD Million
5.2.1.2.2. Face Masks- Market Insights and Forecast 2020-2030, USD Million
5.2.1.2.3. Facial Cleansers- Market Insights and Forecast 2020-2030, USD Million
5.2.1.2.3.1. Liquid- Market Insights and Forecast 2020-2030, USD Million
5.2.1.2.3.2. Cream- Market Insights and Forecast 2020-2030, USD Million
5.2.1.2.3.3. Gel- Market Insights and Forecast 2020-2030, USD Million
5.2.1.2.3.4. Bar Cleansers- Market Insights and Forecast 2020-2030, USD Million
5.2.1.2.3.5. Facial Cleansing Wipes- Market Insights and Forecast 2020-2030, USD Million
5.2.1.2.4. Moisturisers and Treatments- Market Insights and Forecast 2020-2030, USD Million
5.2.1.2.4.1. Basic Moisturisers- Market Insights and Forecast 2020-2030, USD Million
5.2.1.2.4.2. Anti-Agers- Market Insights and Forecast 2020-2030, USD Million
5.2.1.2.5. Lip Care- Market Insights and Forecast 2020-2030, USD Million
5.2.1.2.6. Toners- Market Insights and Forecast 2020-2030, USD Million
5.2.1.3. Hand Care- Market Insights and Forecast 2020-2030, USD Million
5.2.1.4. Skin Care Sets/Kits- Market Insights and Forecast 2020-2030, USD Million
5.2.2.By Category
5.2.2.1. Premium- Market Insights and Forecast 2020-2030, USD Million
5.2.2.2. Mass- Market Insights and Forecast 2020-2030, USD Million
5.2.3.By Gender
5.2.3.1. Men- Market Insights and Forecast 2020-2030, USD Million
5.2.3.2. Women- Market Insights and Forecast 2020-2030, USD Million
5.2.3.3. Unisex- Market Insights and Forecast 2020-2030, USD Million
5.2.4.By End User
5.2.4.1. Adults- Market Insights and Forecast 2020-2030, USD Million
5.2.4.2. Teenagers- Market Insights and Forecast 2020-2030, USD Million
5.2.4.3. Children- Market Insights and Forecast 2020-2030, USD Million
5.2.5.By Packaging
5.2.5.1. Tubes- Market Insights and Forecast 2020-2030, USD Million
5.2.5.2. Bottles- Market Insights and Forecast 2020-2030, USD Million
5.2.5.3. Jars- Market Insights and Forecast 2020-2030, USD Million
5.2.5.4. Others- Market Insights and Forecast 2020-2030, USD Million
5.2.6.By Sales Channel
5.2.6.1. Online- Market Insights and Forecast 2020-2030, USD Million
5.2.6.2. Offline- Market Insights and Forecast 2020-2030, USD Million
5.2.7.By Competitors
5.2.7.1. Competition Characteristics
5.2.7.2. Market Share & Analysis
6. US Body Care Market Statistics, 2020-2030F
6.1. Market Size & Growth Outlook
6.1.1.By Revenues in US$ Million
6.2. Market Segmentation & Growth Outlook
6.2.1.By Product- Market Insights and Forecast 2020-2030, USD Million
6.2.2.By Category- Market Insights and Forecast 2020-2030, USD Million
6.2.3.By Gender- Market Insights and Forecast 2020-2030, USD Million
6.2.4.By End User- Market Insights and Forecast 2020-2030, USD Million
6.2.5.By Packaging- Market Insights and Forecast 2020-2030, USD Million
6.2.6.By Sales Channel- Market Insights and Forecast 2020-2030, USD Million
7. US Facial Care Market Statistics, 2020-2030F
7.1. Market Size & Growth Outlook
7.1.1.By Revenues in US$ Million
7.2. Market Segmentation & Growth Outlook
7.2.1.By Product- Market Insights and Forecast 2020-2030, USD Million
7.2.2.By Category- Market Insights and Forecast 2020-2030, USD Million
7.2.3.By Gender- Market Insights and Forecast 2020-2030, USD Million
7.2.4.By End User- Market Insights and Forecast 2020-2030, USD Million
7.2.5.By Packaging- Market Insights and Forecast 2020-2030, USD Million
7.2.6.By Sales Channel- Market Insights and Forecast 2020-2030, USD Million
8. US Hand Care Market Statistics, 2020-2030F
8.1. Market Size & Growth Outlook
8.1.1.By Revenues in US$ Million
8.2. Market Segmentation & Growth Outlook
8.2.1.By Category- Market Insights and Forecast 2020-2030, USD Million
8.2.2.By Gender- Market Insights and Forecast 2020-2030, USD Million
8.2.3.By End User- Market Insights and Forecast 2020-2030, USD Million
8.2.4.By Packaging- Market Insights and Forecast 2020-2030, USD Million
8.2.5.By Sales Channel- Market Insights and Forecast 2020-2030, USD Million
9. US Skin Care Sets/Kits Market Statistics, 2020-2030F
9.1. Market Size & Growth Outlook
9.1.1.By Revenues in US$ Million
9.2. Market Segmentation & Growth Outlook
9.2.1.By Category- Market Insights and Forecast 2020-2030, USD Million
9.2.2.By Gender- Market Insights and Forecast 2020-2030, USD Million
9.2.3.By End User- Market Insights and Forecast 2020-2030, USD Million
9.2.4.By Packaging- Market Insights and Forecast 2020-2030, USD Million
9.2.5.By Sales Channel- Market Insights and Forecast 2020-2030, USD Million
10. Competitive Outlook
10.1. Company Profiles
10.1.1. L'Oréal USA Inc
10.1.1.1. Business Description
10.1.1.2. Product Portfolio
10.1.1.3. Collaborations & Alliances
10.1.1.4. Recent Developments
10.1.1.5. Financial Details
10.1.1.6. Others
10.1.2. Johnson & Johnson Consumer Products Inc
10.1.2.1. Business Description
10.1.2.2. Product Portfolio
10.1.2.3. Collaborations & Alliances
10.1.2.4. Recent Developments
10.1.2.5. Financial Details
10.1.2.6. Others
10.1.3. Estée Lauder Cos Inc
10.1.3.1. Business Description
10.1.3.2. Product Portfolio
10.1.3.3. Collaborations & Alliances
10.1.3.4. Recent Developments
10.1.3.5. Financial Details
10.1.3.6. Others
10.1.4. Procter & Gamble Co, The
10.1.4.1. Business Description
10.1.4.2. Product Portfolio
10.1.4.3. Collaborations & Alliances
10.1.4.4. Recent Developments
10.1.4.5. Financial Details
10.1.4.6. Others
10.1.5. Bath & Body Works Inc
10.1.5.1. Business Description
10.1.5.2. Product Portfolio
10.1.5.3. Collaborations & Alliances
10.1.5.4. Recent Developments
10.1.5.5. Financial Details
10.1.5.6. Others
10.1.6. Beiersdorf Inc
10.1.6.1. Business Description
10.1.6.2. Product Portfolio
10.1.6.3. Collaborations & Alliances
10.1.6.4. Recent Developments
10.1.6.5. Financial Details
10.1.6.6. Others
10.1.7. Unilever Home & Personal Care USA
10.1.7.1. Business Description
10.1.7.2. Product Portfolio
10.1.7.3. Collaborations & Alliances
10.1.7.4. Recent Developments
10.1.7.5. Financial Details
10.1.7.6. Others
10.1.8. Mary Kay Inc
10.1.8.1. Business Description
10.1.8.2. Product Portfolio
10.1.8.3. Collaborations & Alliances
10.1.8.4. Recent Developments
10.1.8.5. Financial Details
10.1.8.6. Others
10.1.9. Shiseido Americas Corp
10.1.9.1. Business Description
10.1.9.2. Product Portfolio
10.1.9.3. Collaborations & Alliances
10.1.9.4. Recent Developments
10.1.9.5. Financial Details
10.1.9.6. Others
10.1.10. Galderma Laboratories Inc
10.1.10.1.Business Description
10.1.10.2.Product Portfolio
10.1.10.3.Collaborations & Alliances
10.1.10.4.Recent Developments
10.1.10.5.Financial Details
10.1.10.6.Others
11. Disclaimer
| Segment | Sub-Segment |
|---|---|
| By Product |
|
| By Category |
|
| By Gender |
|
| By End User |
|
| By Packaging |
|
| By Sales Channel |
|
Research Methodology
This study followed a structured approach comprising four key phases to assess the size and scope of the electro-oxidation market. The process began with thorough secondary research to collect data on the target market, related markets, and broader industry context. These findings, along with preliminary assumptions and estimates, were then validated through extensive primary research involving industry experts from across the value chain. To calculate the overall market size, both top-down and bottom-up methodologies were employed. Finally, market segmentation and data triangulation techniques were applied to refine and validate segment-level estimations.
Secondary Research
The secondary research phase involved gathering data from a wide range of credible and published sources. This step helped in identifying industry trends, defining market segmentation, and understanding the market landscape and value chain.
Sources consulted during this phase included:
- Company annual reports, investor presentations, and press releases
- Industry white papers and certified publications
- Trade directories and market-recognized databases
- Articles from authoritative authors and reputable journals
- Gold and silver standard websites
Secondary research was critical in mapping out the industry's value chain and monetary flow, identifying key market segments, understanding regional variations, and tracking significant industry developments.
Other key sources:
- Financial disclosures
- Industry associations and trade bodies
- News outlets and business magazines
- Academic journals and research studies
- Paid industry databases
Primary Research
To validate secondary data and gain deeper market insights, primary research was conducted with key stakeholders across both the supply and demand sides of the market.
On the demand side, participants included decision-makers and influencers from end-user industries—such as CIOs, CTOs, and CSOs—who provided first-hand perspectives on market needs, product usage, and future expectations.
On the supply side, interviews were conducted with manufacturers, industry associations, and institutional participants to gather insights into current offerings, product pipelines, and market challenges.
Primary interviews provided critical inputs such as:
- Market size and revenue data
- Product and service breakdowns
- Market forecasts
- Regional and application-specific trends
Stakeholders consulted included:
- Leading OEM and solution providers
- Channel and distribution partners
- End users across various applications
- Independent consultants and industry specialists
Market Size Estimation and Data Triangulation
- Identifying Key Market Participants (Secondary Research)
- Goal: To identify the major players or companies in the target market. This typically involves using publicly available data sources such as industry reports, market research publications, and financial statements of companies.
- Tools: Reports from firms like Gartner, Forrester, Euromonitor, Statista, IBISWorld, and others. Public financial statements, news articles, and press releases from top market players.
- Extracting Earnings of Key Market Participants
- Goal: To estimate the earnings generated from the product or service being analyzed. This step helps in understanding the revenue potential of each market player in a specific geography.
- Methods: Earnings data can be gathered from:
- Publicly available financial reports (for listed companies).
- Interviews and primary data sources from professionals, such as Directors, VPs, SVPs, etc. This is especially useful for understanding more nuanced, internal data that isn't publicly disclosed.
- Annual reports and investor presentations of key players.
- Data Collation and Development of a Relevant Data Model
- Goal: To collate inputs from both primary and secondary sources into a structured, data-driven model for market estimation. This model will incorporate key market KPIs and any independent variables relevant to the market.
- Key KPIs: These could include:
- Market size, growth rate, and demand drivers.
- Industry-specific metrics like market share, average revenue per customer (ARPC), or average deal size.
- External variables, such as economic growth rates, inflation rates, or commodity prices, that could affect the market.
- Data Modeling: Based on this data, the market forecasts are developed for the next 5 years. A combination of trend analysis, scenario modeling, and statistical regression might be used to generate projections.
- Scenario Analysis
- Goal: To test different assumptions and validate how sensitive the market is to changes in key variables (e.g., market demand, regulatory changes, technological disruptions).
- Types of Scenarios:
- Base Case: Based on current assumptions and historical data.
- Best-Case Scenario: Assuming favorable market conditions, regulatory environments, and technological advancements.
- Worst-Case Scenario: Accounting for adverse factors, such as economic downturns, stricter regulations, or unexpected disruptions.


