US Pet Products Market Report: Trends, Growth and Forecast (2026-2032)
By Product (Cat Litter, Pet Healthcare (Flea/Tick Treatments, Pet Dietary Supplements, Worming Treatments, Others), Other Pet Products (Beauty Products, Accessories, Others)), By Sales Channel (Retail Offline, Retail E-Commerce, Veterinary Clinics) ... Read more
|
Major Players
|
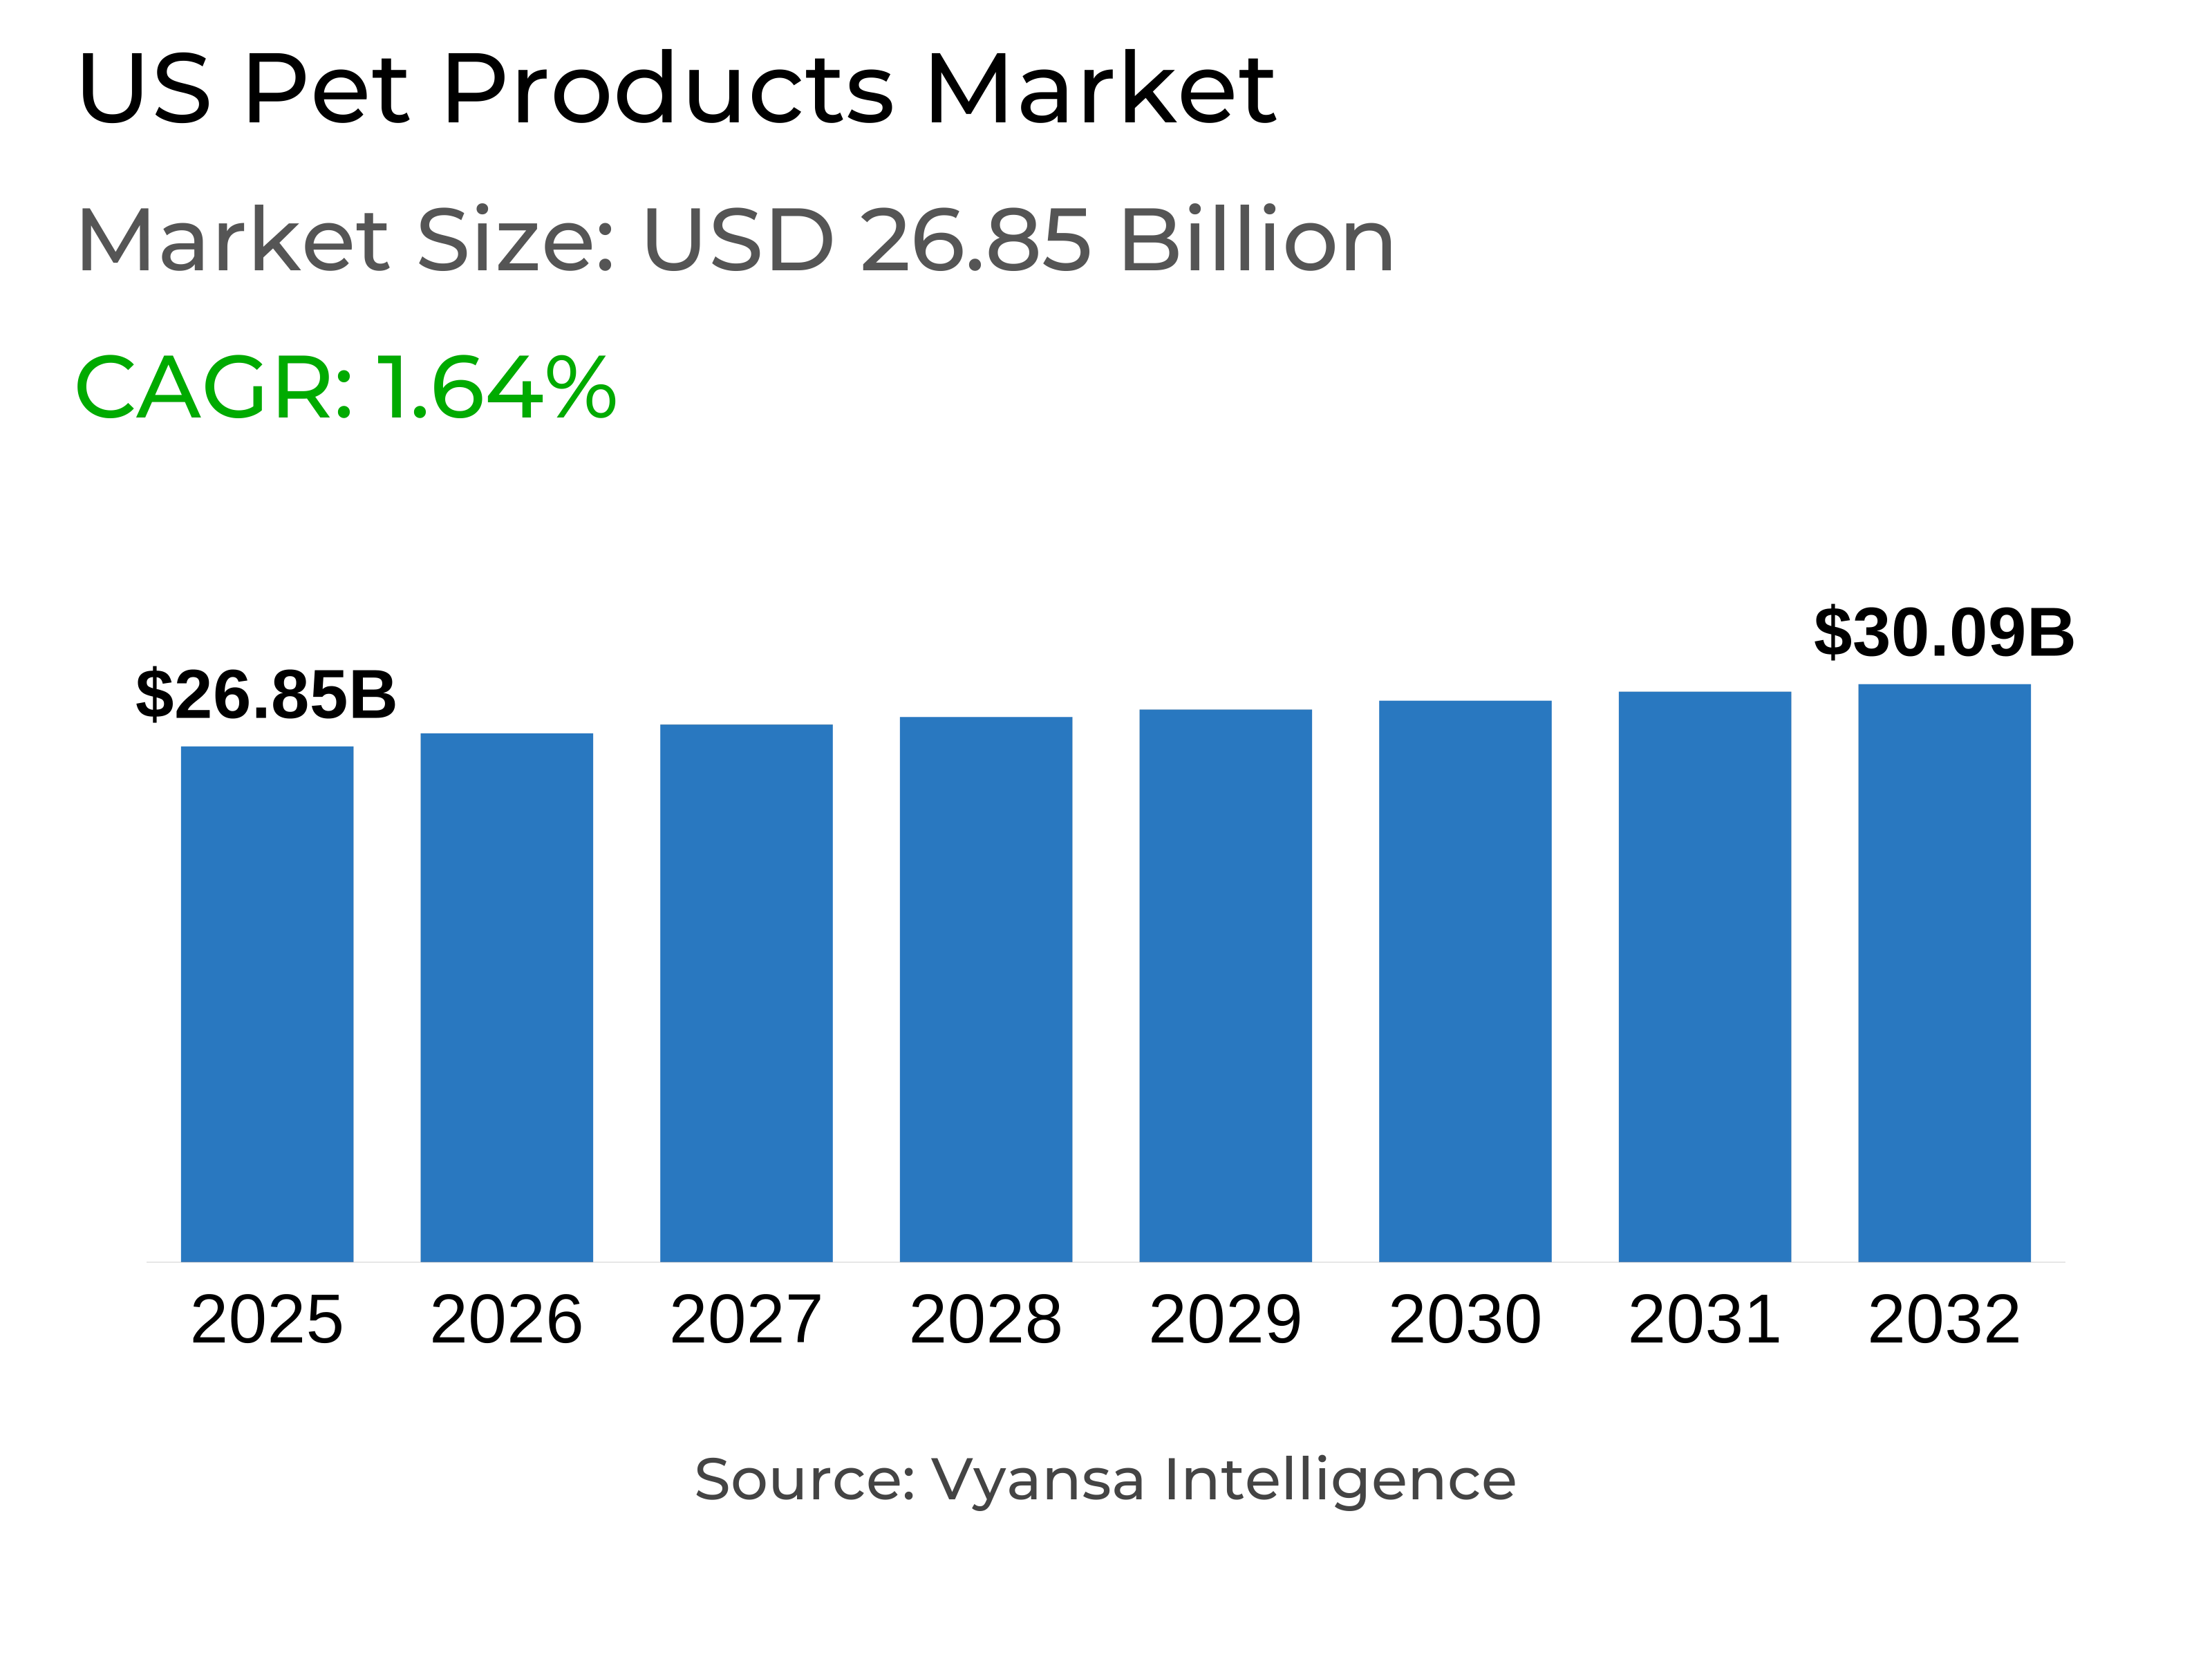
US Pet Products Market Statistics and Insights, 2026
- Market Size Statistics
- Pet Products in US is estimated at $ 26.85 Billion.
- The market size is expected to grow to $ 30.09 Billion by 2032.
- Market to register a CAGR of around 1.64% during 2026-32.
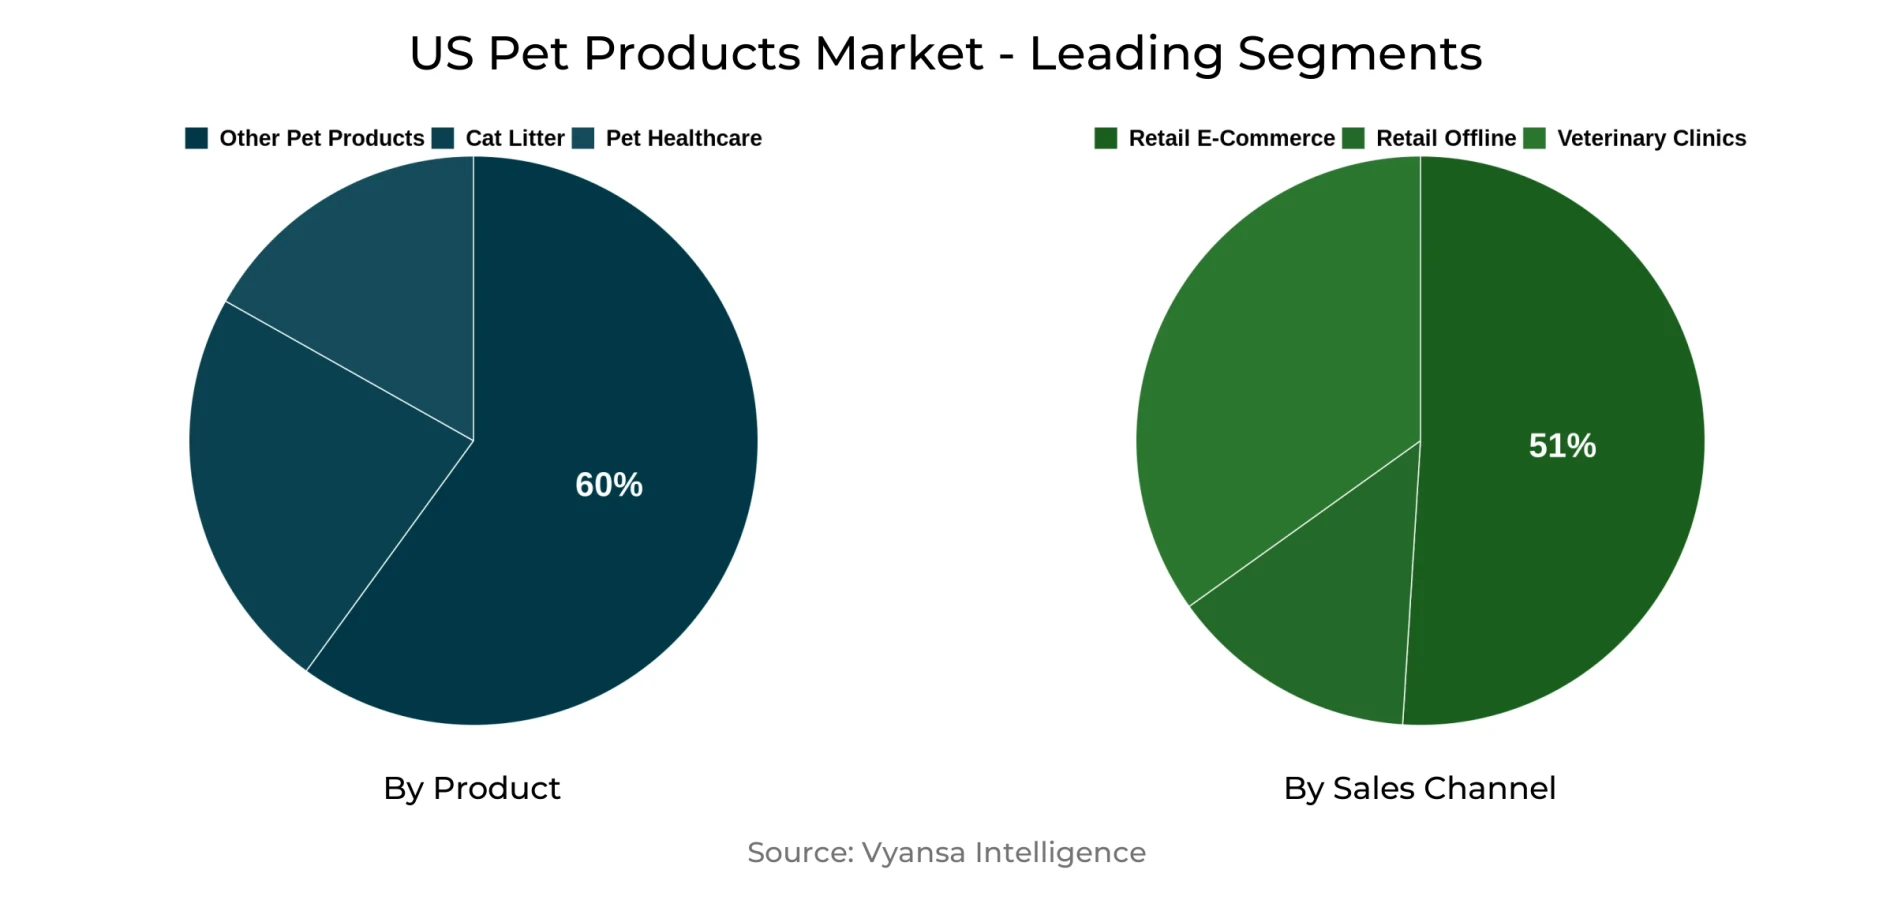
- Product Shares
- Other Pet Products grabbed market share of 60%.
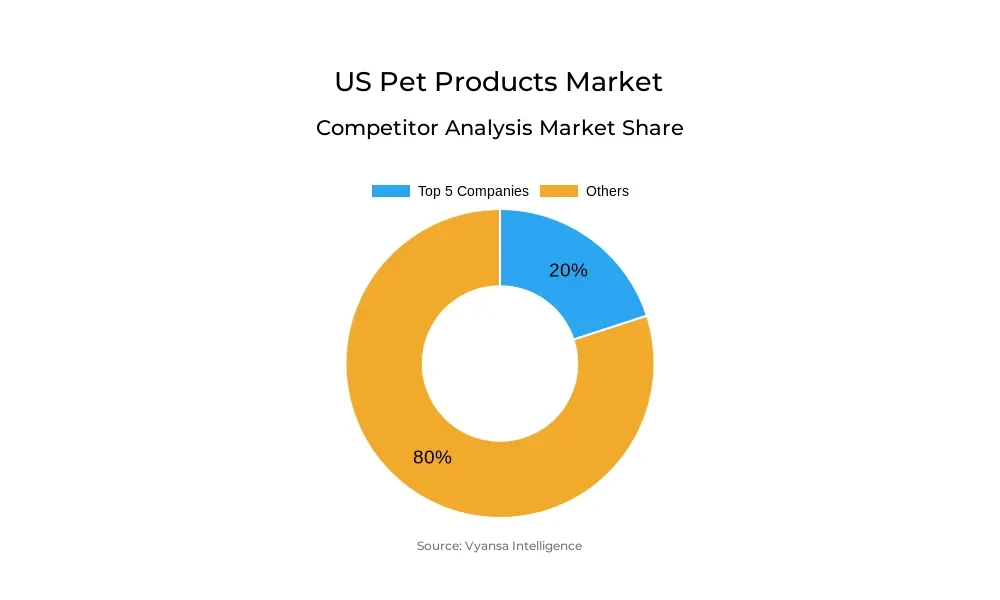
- Competition
- More than 20 companies are actively engaged in producing Pet Products in US.
- Top 5 companies acquired 20% of the market share.
- PetIQ LLC, Hartz Mountain Corp, Petmate Inc, Nestlé Purina PetCare Co, Central Garden & Pet Co etc., are few of the top companies.
- Sales Channel
- Retail E-Commerce grabbed 51% of the market.
US Pet Products Market Outlook
The US Pet Products Market is valued at USD 26.85 billion and is expected to grow steadily to USD 30.09 billion in 2032. Even with innovation across categories, overall growth is moderate as conservative spending and slow expansion of the pet population restrain demand. Accessory and bedding categories will likely experience slower performance, whereas cat litter and pet healthcare are growth drivers based on sustainable cat ownership and growing interest in preventative pet nutrition.
Innovation will be at the heart of opportunity in the market. Dietary supplements keep on getting smarter with functional ingredients, innovative formats, and wellness-driven claims imitating treats to lure pet owners. Brands are also fusing lines between lifestyle and function, from prebiotic balms to smart feeders. Such innovation not only deepens trust among end users but places products as meaningful solutions that address changing needs of pets and humans alike.
From the distribution perspective, retail e-commerce is in the lead with a 51% share, an indication of shifting buying habits. Subscriptions are leveraged by platforms such as Chewy and Amazon, while TikTok Shop and influencer-based content drive in-app buying. Lifestyle retail concepts are also increasing their presence, with stores from home improvement to grocery incorporating more pet products to reach new end user s.
In the future, there will be continued outside pressure from economic volatility, political change, and global supply-chain risk that will affect growth. Volatility of prices, deregulation, and ingredient availability could test consistency of product supply and end user confidence. Yet operators emphasizing functionality, innovation in packaging and form, and more intense digital engagement are likely to stay in the game and seize opportunities in a guarded but gradually growing market.
US Pet Products Market Challenge
Increased Uncertainty Constrains Expansion
Despite ongoing product innovation, value growth at constant 2025 prices remains subdued. Weak economic prospects, volatile trade policies, and changing government agendas force cautious behavior among end user s and businesses. Geopolitical threats such as war and climate-linked disruptions add to pressures on supply chains, while tariff, tax, and immigration policies increase the risk of recession and trade wars. They contribute to higher costs, lower product availability, and volatile end user demand.
However, Global supply chain pressures also concentrate domestic rivalry for key ingredients common to human and pet foods. Dietary supplements that depend on inputs like fish oil, kelp, honey, and animal byproducts confront serious cost challenges. Meanwhile, deregulation compromises food safety, sustainability, and environmental standards, breaking end user confidence. Budget cuts and relaxed restraints weaken regulation, reducing the capacity of firms to substantiate quality and corporate accountability along the market.
US Pet Products Market Trend
Functionality Drives Product Innovation
As the market becomes increasingly saturated, innovation in pet products is shifting toward greater functionality in packaging, formats, and ingredients. Companies create products for varied pets and lifestyles while maintaining end user interest. For example, increasing demand for cats results in new hybrid format products that integrate treats and supplements. Kradle's Wellness Licks, a salmon-flavored cat dietary supplement, employs a twist-base dispenser to provide pre-measured serving sizes, highlighting how functionality defines product success.
Furthermore, Changes in end user requirements drive mature category companies to venture into pet products. Elanco, the classic flea and tick treatment company, moves into dietary supplements with Pet Protect. With declining end user confidence in big business, uncomplicated product functionality and transparency are the emphasis. Keeping pace with shifting demographics and pet owner demands positions brands well in this changing world.
Unlock Market Intelligence
Explore the market potential with our data-driven report
US Pet Products Market Opportunity
Unlocking Opportunity in Offline Retail
Retail Offline will offer new avenues for US pet products growth over the next few years. General retailers and baby boutiques will increasingly incorporate pet-specific products into their ranges. Existing children's and baby products will also be used in stores to appeal to pet owners, with the use of product multi-functionality being highlighted through items like playpens and clothing. This enables retailers to stimulate slower-selling products while capitalising on strong humanisation among pet owners.
Big box retailers will increasingly look to innovative in-store presentation to stimulate interaction. For instance, initiatives such as lifestyle-themed co-promotions and individualized product presentations will feature pet toys, treats, and apparel, commonly placed near areas for children. It will enable stores to tie pet care to lifestyle shopping, with stable offline potential without excessive investment in special pet SKUs.
| Report Coverage | Details |
|---|---|
| Market Forecast | 2026-32 |
| USD Value 2025 | $ 26.85 Billion |
| USD Value 2032 | $ 30.09 Billion |
| CAGR 2026-2032 | 1.64% |
| Largest Category | Other Pet Products segment leads with 60% market share |
| Top Challenges | Increased Uncertainty Constrains Expansion |
| Top Trends | Functionality Drives Product Innovation |
| Top Opportunities | Unlocking Opportunity in Offline Retail |
| Key Players | PetIQ LLC, Hartz Mountain Corp, Petmate Inc, Nestlé Purina PetCare Co, Central Garden & Pet Co, Bayer Corp, Church & Dwight Co Inc, Clorox Co, The, Barkbox Inc, Spectrum Brands Holdings Inc and Others. |
Unlock Market Intelligence
Explore the market potential with our data-driven report
US Pet Products Market Segmentation Analysis
By Sales Channel
- Retail Offline
- Retail E-Commerce
- Veterinary Clinics
The most saturated segment in the sales channel is retail e-commerce, which took 51% of the US pet products market. It is highly driven by subscription and membership models, with platforms like Chewy and Amazon defining end user loyalty. Another main driver has been social media influence, where actual end user s and lifestyle influencers subtly feature products without explicit endorsements, building genuine connections with the masses.
Furthermore, e-commerce expansion is being sustained by shopping capabilities in-app. TikTok is a prominent platform that allows sellers to livestream and directly interact with end user s. Free shipping, live flash sales, and interactive shopping experiences are some advantages that further drive the popularity of purchasing online, making sure that e-commerce keeps leading in the distribution of pet products in the projection period.
Top Companies in US Pet Products Market
The top companies operating in the market include PetIQ LLC, Hartz Mountain Corp, Petmate Inc, Nestlé Purina PetCare Co, Central Garden & Pet Co, Bayer Corp, Church & Dwight Co Inc, Clorox Co, The, Barkbox Inc, Spectrum Brands Holdings Inc, etc., are the top players operating in the US Pet Products Market.
Frequently Asked Questions
Related Report
1. Market Segmentation
1.1. Research Scope
1.2. Research Methodology
1.3. Definitions and Assumptions
2. Executive Summary
3. US Pet Products Market Policies, Regulations, and Standards
4. US Pet Products Market Dynamics
4.1. Growth Factors
4.2. Challenges
4.3. Trends
4.4. Opportunities
5. US Pet Products Market Statistics, 2022-2032F
5.1. Market Size & Growth Outlook
5.1.1.By Revenues in US$ Million
5.2. Market Segmentation & Growth Outlook
5.2.1.By Product
5.2.1.1. Cat Litter- Market Insights and Forecast 2022-2032, USD Million
5.2.1.2. Pet Healthcare- Market Insights and Forecast 2022-2032, USD Million
5.2.1.2.1. Flea/Tick Treatments- Market Insights and Forecast 2022-2032, USD Million
5.2.1.2.2. Pet Dietary Supplements- Market Insights and Forecast 2022-2032, USD Million
5.2.1.2.3. Worming Treatments- Market Insights and Forecast 2022-2032, USD Million
5.2.1.2.4. Others- Market Insights and Forecast 2022-2032, USD Million
5.2.1.3. Other Pet Products- Market Insights and Forecast 2022-2032, USD Million
5.2.1.3.1. Beauty Products- Market Insights and Forecast 2022-2032, USD Million
5.2.1.3.2. Accessories- Market Insights and Forecast 2022-2032, USD Million
5.2.1.3.3. Others- Market Insights and Forecast 2022-2032, USD Million
5.2.2.By Sales Channel
5.2.2.1. Retail Offline- Market Insights and Forecast 2022-2032, USD Million
5.2.2.2. Retail E-Commerce- Market Insights and Forecast 2022-2032, USD Million
5.2.2.3. Veterinary Clinics- Market Insights and Forecast 2022-2032, USD Million
5.2.3.By Competitors
5.2.3.1. Competition Characteristics
5.2.3.2. Market Share & Analysis
6. US Cat Litter Products Market Statistics, 2022-2032F
6.1. Market Size & Growth Outlook
6.1.1.By Revenues in US$ Million
6.2. Market Segmentation & Growth Outlook
6.2.1.By Sales Channel- Market Insights and Forecast 2022-2032, USD Million
7. US Pet Healthcare Market Statistics, 2022-2032F
7.1. Market Size & Growth Outlook
7.1.1.By Revenues in US$ Million
7.2. Market Segmentation & Growth Outlook
7.2.1.By Product- Market Insights and Forecast 2022-2032, USD Million
7.2.2.By Sales Channel- Market Insights and Forecast 2022-2032, USD Million
8. US Other Pet Products Market Statistics, 2022-2032F
8.1. Market Size & Growth Outlook
8.1.1.By Revenues in US$ Million
8.2. Market Segmentation & Growth Outlook
8.2.1.By Product- Market Insights and Forecast 2022-2032, USD Million
8.2.2.By Sales Channel- Market Insights and Forecast 2022-2032, USD Million
9. Competitive Outlook
9.1. Company Profiles
9.1.1.Nestlé Purina PetCare Co
9.1.1.1. Business Description
9.1.1.2. Product Portfolio
9.1.1.3. Collaborations & Alliances
9.1.1.4. Recent Developments
9.1.1.5. Financial Details
9.1.1.6. Others
9.1.2.Central Garden & Pet Co
9.1.2.1. Business Description
9.1.2.2. Product Portfolio
9.1.2.3. Collaborations & Alliances
9.1.2.4. Recent Developments
9.1.2.5. Financial Details
9.1.2.6. Others
9.1.3.Bayer Corp
9.1.3.1. Business Description
9.1.3.2. Product Portfolio
9.1.3.3. Collaborations & Alliances
9.1.3.4. Recent Developments
9.1.3.5. Financial Details
9.1.3.6. Others
9.1.4.Church & Dwight Co Inc
9.1.4.1. Business Description
9.1.4.2. Product Portfolio
9.1.4.3. Collaborations & Alliances
9.1.4.4. Recent Developments
9.1.4.5. Financial Details
9.1.4.6. Others
9.1.5.Clorox Co, The
9.1.5.1. Business Description
9.1.5.2. Product Portfolio
9.1.5.3. Collaborations & Alliances
9.1.5.4. Recent Developments
9.1.5.5. Financial Details
9.1.5.6. Others
9.1.6.PetIQ LLC
9.1.6.1. Business Description
9.1.6.2. Product Portfolio
9.1.6.3. Collaborations & Alliances
9.1.6.4. Recent Developments
9.1.6.5. Financial Details
9.1.6.6. Others
9.1.7.Hartz Mountain Corp
9.1.7.1. Business Description
9.1.7.2. Product Portfolio
9.1.7.3. Collaborations & Alliances
9.1.7.4. Recent Developments
9.1.7.5. Financial Details
9.1.7.6. Others
9.1.8.Petmate Inc
9.1.8.1. Business Description
9.1.8.2. Product Portfolio
9.1.8.3. Collaborations & Alliances
9.1.8.4. Recent Developments
9.1.8.5. Financial Details
9.1.8.6. Others
9.1.9.Barkbox Inc
9.1.9.1. Business Description
9.1.9.2. Product Portfolio
9.1.9.3. Collaborations & Alliances
9.1.9.4. Recent Developments
9.1.9.5. Financial Details
9.1.9.6. Others
9.1.10. Spectrum Brands Holdings Inc
9.1.10.1. Business Description
9.1.10.2. Product Portfolio
9.1.10.3. Collaborations & Alliances
9.1.10.4. Recent Developments
9.1.10.5. Financial Details
9.1.10.6. Others
10. Disclaimer
| Segment | Sub-Segment |
|---|---|
| By Product |
|
| By Sales Channel |
|
Research Methodology
This study followed a structured approach comprising four key phases to assess the size and scope of the electro-oxidation market. The process began with thorough secondary research to collect data on the target market, related markets, and broader industry context. These findings, along with preliminary assumptions and estimates, were then validated through extensive primary research involving industry experts from across the value chain. To calculate the overall market size, both top-down and bottom-up methodologies were employed. Finally, market segmentation and data triangulation techniques were applied to refine and validate segment-level estimations.
Secondary Research
The secondary research phase involved gathering data from a wide range of credible and published sources. This step helped in identifying industry trends, defining market segmentation, and understanding the market landscape and value chain.
Sources consulted during this phase included:
- Company annual reports, investor presentations, and press releases
- Industry white papers and certified publications
- Trade directories and market-recognized databases
- Articles from authoritative authors and reputable journals
- Gold and silver standard websites
Secondary research was critical in mapping out the industry's value chain and monetary flow, identifying key market segments, understanding regional variations, and tracking significant industry developments.
Other key sources:
- Financial disclosures
- Industry associations and trade bodies
- News outlets and business magazines
- Academic journals and research studies
- Paid industry databases
Primary Research
To validate secondary data and gain deeper market insights, primary research was conducted with key stakeholders across both the supply and demand sides of the market.
On the demand side, participants included decision-makers and influencers from end-user industries—such as CIOs, CTOs, and CSOs—who provided first-hand perspectives on market needs, product usage, and future expectations.
On the supply side, interviews were conducted with manufacturers, industry associations, and institutional participants to gather insights into current offerings, product pipelines, and market challenges.
Primary interviews provided critical inputs such as:
- Market size and revenue data
- Product and service breakdowns
- Market forecasts
- Regional and application-specific trends
Stakeholders consulted included:
- Leading OEM and solution providers
- Channel and distribution partners
- End users across various applications
- Independent consultants and industry specialists
Market Size Estimation and Data Triangulation
- Identifying Key Market Participants (Secondary Research)
- Goal: To identify the major players or companies in the target market. This typically involves using publicly available data sources such as industry reports, market research publications, and financial statements of companies.
- Tools: Reports from firms like Gartner, Forrester, Euromonitor, Statista, IBISWorld, and others. Public financial statements, news articles, and press releases from top market players.
- Extracting Earnings of Key Market Participants
- Goal: To estimate the earnings generated from the product or service being analyzed. This step helps in understanding the revenue potential of each market player in a specific geography.
- Methods: Earnings data can be gathered from:
- Publicly available financial reports (for listed companies).
- Interviews and primary data sources from professionals, such as Directors, VPs, SVPs, etc. This is especially useful for understanding more nuanced, internal data that isn't publicly disclosed.
- Annual reports and investor presentations of key players.
- Data Collation and Development of a Relevant Data Model
- Goal: To collate inputs from both primary and secondary sources into a structured, data-driven model for market estimation. This model will incorporate key market KPIs and any independent variables relevant to the market.
- Key KPIs: These could include:
- Market size, growth rate, and demand drivers.
- Industry-specific metrics like market share, average revenue per customer (ARPC), or average deal size.
- External variables, such as economic growth rates, inflation rates, or commodity prices, that could affect the market.
- Data Modeling: Based on this data, the market forecasts are developed for the next 5 years. A combination of trend analysis, scenario modeling, and statistical regression might be used to generate projections.
- Scenario Analysis
- Goal: To test different assumptions and validate how sensitive the market is to changes in key variables (e.g., market demand, regulatory changes, technological disruptions).
- Types of Scenarios:
- Base Case: Based on current assumptions and historical data.
- Best-Case Scenario: Assuming favorable market conditions, regulatory environments, and technological advancements.
- Worst-Case Scenario: Accounting for adverse factors, such as economic downturns, stricter regulations, or unexpected disruptions.


