US Pet Care Market Report: Trends, Growth and Forecast (2026-2032)
By Product (Pet Food (Dry Food, Wet Food, Treats & Mixers), Pet Products (Cat Litter, Pet Healthcare (Veterinary Diets, Probiotics and Supplements, Tele-health Services)), Services (Veterinary Clinics, Pet Insurance, Boarding, Day-Care, and Training), Grooming and Hygiene (Shampoos and Conditioners, Brushes and Combs, Clippers and Scissors)), By Pet Type (Dog, Cat, Others), By Sales Channel (Retail Offline, Retail E-Commerce, Veterinary Clinics) ... Read more

|
Major Players
|
US Pet Care Market Statistics and Insights, 2026
- Market Size Statistics
- Pet Care in US is estimated at $ 87.6 Billion.
- The market size is expected to grow to $ 102.26 Billion by 2032.
- Market to register a CAGR of around 2.24% during 2026-32.
- Product Shares
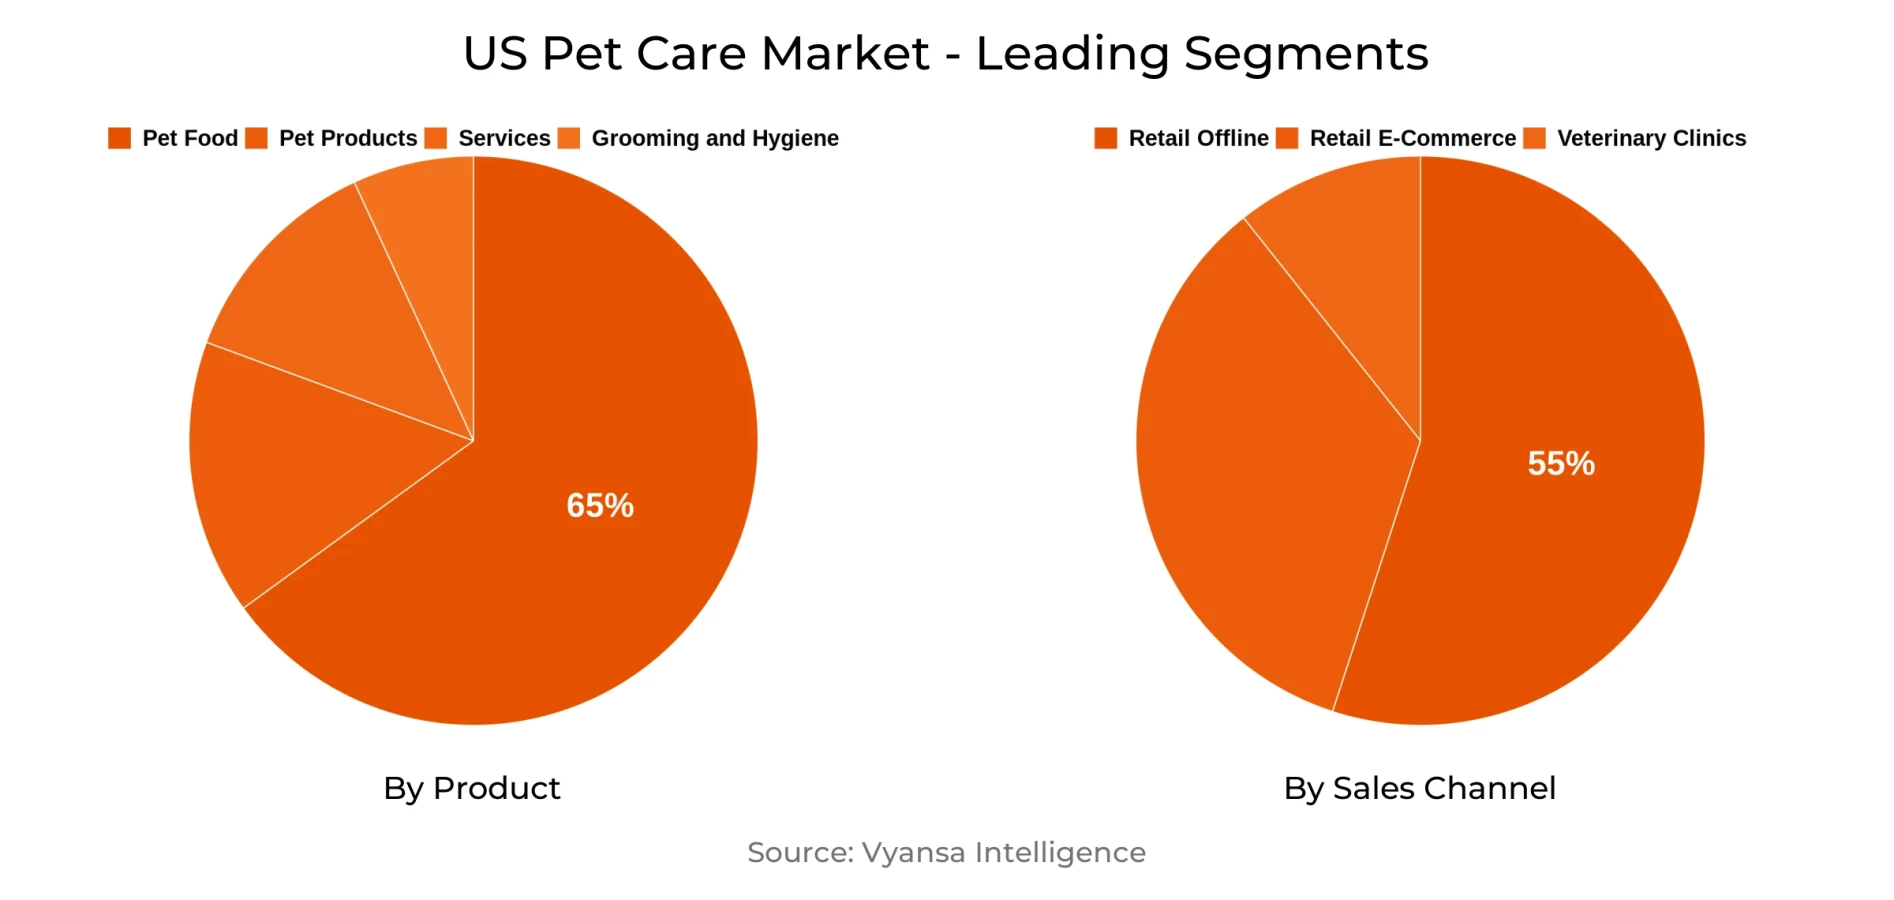
- Pet Food grabbed market share of 65%.
- Pet Food to witness a volume CAGR of around 1.11%.
- Competition
- More than 20 companies are actively engaged in producing Pet Care in US.
- Top 5 companies acquired 55% of the market share.
- Post Consumer Brands LLC, Royal Canin SAS, Nutro Co, The, Nestlé Purina PetCare Co, Mars Inc etc., are few of the top companies.
- Sales Channel
- Retail Offline grabbed 55% of the market.
US Pet Care Market Outlook
The US pet care market, which is currently worth approximately USD 87.6 billion, is expected to rise steadily and touch approximately USD 102.26 billion by 2032. Expansion will be moderate, driven by political uncertainties, climate-related disruptions, and changing consumer behavior. Although inflation pressures and supply chain threats are anticipated to endure, the entrenched emotional relationship between end users and their pets will continue to fuel demand, especially in dog food and cat food. Demographic trends toward wealthier households also are stabilizing the pet population even while economic pressure confines new acquisition.
Pet food will continue to be the largest category, with an estimated volume CAGR of approximately 1.11%. end users are seeking fresh, raw, and functional offerings, but recalls and food safety issues are redefining brand trust. Consequently, multifunctional products that support nutrition with health benefits, supplements that also serve as treats—have become increasingly popular. Category blurring will continue to be a characteristic trend, with pet dietary supplements, toppers, and snacks converging into adaptive formats that accommodate consumer budgets and lifestyles.
Retailing trends will also affect market performance. Retail Offline stores still command around 55% of the market through supermarkets, specialty pet stores, and lifestyle-based boutiques providing tailored experiences. Meanwhile, Retail E-commerce is predicted to further grow its advantage on the back of subscription services, online drug stores, and social media-led engagement. Services like telehealth are being added by platforms such as Chewy and Walmart+. Livestream selling and influencer-led marketing enhance the digital community's presence in pet care.
Forward-looking, sustainability, food safety, and functional health solutions will form the core of innovation. Clear claims and partnerships will become increasingly leveraged to win over End users, as political and economic volatility tests traditional growth models. Under headwinds, the market will be supported by ongoing humanisation and premiumisation, so it will stay stable through 2032.

US Pet Care Market Trend
Increased Demand for Multifunctional Pet Products
End users are getting more careful about spendings while still demanding the best for their pets. Rather than forgoing purchases, they increasingly opt for multifunctional items that fulfill several functions. For instance, treats that double as dietary supplements or toppers that can be served as part of a meal are on the rise. This transition is an indicator of how End users seek value in all their purchases, so pets continue to receive quality care despite budget constraints.
This also fuels more demand for transparent and credible claims regarding product benefits. Ingredients like collagen, kelp, and mushrooms are in fashion, but end users would like to know precisely how these contribute to their pet's wellbeing. Consequently, products with multiple functions that have open labelling and substantiated benefits are emerging as a major growth stimulator in the market.
US Pet Care Market Opportunity
Growing Retail E-commerce and Digital Engagement
Retail E-commerce will continue to be a dominant pet care channel, with brands able to reach End users more directly and on a more personal basis. Social media will be at the heart of this, with influencers, live streaming sales, and community-based content facilitating trust and increased loyalty. The shift online will enable firms to access younger audiences and connect on an emotional level with end users who find more convenience and relevance in their shopping.
The prospect will also expand with additional services like subscription discounts, repeat delivery advantage, and customized gifting. Growth of online pharmacies for prescription animal food will also fuel the channel, increasing the competition with the conventional clinics and retailers. All these will provide space to brands to use digital platforms not just to boost sales but to build long-term consumer relationships as well.
Unlock Market Intelligence
Explore the market potential with our data-driven report
US Pet Care Market Segmentation Analysis
By Sales Channel
- Retail Offline
- Retail E-Commerce
- Veterinary Clinics
The channel with the largest market share in the sales channel is retail offline, with a market share of approximately 55%. Supermarkets, specialty pet stores, and lifestyle boutiques remain to be the backbone of this channel, giving End users quick access to a broad range of products. Small independent stores, more so, are being fashionable areas for innovation, with premium brands that boast limited offline reach. These collaborations increase their appeal and solidify their positioning in fueling growth.
Retail Offline also leads the way in delivering experience-led services that cannot be matched by Retail E-commerce. Pet-friendly shopping spaces, photo moments, and customized guidance foster stronger consumer bonds. This turns offline stores into not just a location for buying but also destinations for interactive and customized experiences, which ensure their ongoing presence with the speed of growth in digital platforms.
Top Companies in US Pet Care Market
The top companies operating in the market include Post Consumer Brands LLC, Royal Canin SAS, Nutro Co, The, Nestlé Purina PetCare Co, Mars Inc, Hill's Pet Nutrition Inc, Blue Buffalo Co Ltd, Big Heart Pet Brands, Freshpet Inc, Wellness Pet LLC, etc., are the top players operating in the US Pet Care Market.
Frequently Asked Questions
Related Report
1. Market Segmentation
1.1. Research Scope
1.2. Research Methodology
1.3. Definitions and Assumptions
2. Executive Summary
3. US Pet Care Market Policies, Regulations, and Standards
4. US Pet Care Market Dynamics
4.1. Growth Factors
4.2. Challenges
4.3. Trends
4.4. Opportunities
5. US Pet Care Market Statistics, 2022-2032F
5.1. Market Size & Growth Outlook
5.1.1.By Revenues in US$ Million
5.2. Market Segmentation & Growth Outlook
5.2.1.By Product
5.2.1.1. Pet Food- Market Insights and Forecast 2022-2032, USD Million
5.2.1.1.1. Dry Food- Market Insights and Forecast 2022-2032, USD Million
5.2.1.1.2. Wet Food- Market Insights and Forecast 2022-2032, USD Million
5.2.1.1.3. Treats & Mixers- Market Insights and Forecast 2022-2032, USD Million
5.2.1.2. Pet Products- Market Insights and Forecast 2022-2032, USD Million
5.2.1.2.1. Cat Litter- Market Insights and Forecast 2022-2032, USD Million
5.2.1.2.2. Pet Healthcare- Market Insights and Forecast 2022-2032, USD Million
5.2.1.2.2.1. Veterinary Diets- Market Insights and Forecast 2022-2032, USD Million
5.2.1.2.2.2. Probiotics and Supplements- Market Insights and Forecast 2022-2032, USD Million
5.2.1.2.2.3. Tele-health Services- Market Insights and Forecast 2022-2032, USD Million
5.2.1.3. Services- Market Insights and Forecast 2022-2032, USD Million
5.2.1.3.1. Veterinary Clinics- Market Insights and Forecast 2022-2032, USD Million
5.2.1.3.2. Pet Insurance- Market Insights and Forecast 2022-2032, USD Million
5.2.1.3.3. Boarding, Day-Care, and Training- Market Insights and Forecast 2022-2032, USD Million
5.2.1.4. Grooming and Hygiene- Market Insights and Forecast 2022-2032, USD Million
5.2.1.4.1. Shampoos and Conditioners- Market Insights and Forecast 2022-2032, USD Million
5.2.1.4.2. Brushes and Combs- Market Insights and Forecast 2022-2032, USD Million
5.2.1.4.3. Clippers and Scissors- Market Insights and Forecast 2022-2032, USD Million
5.2.2.By Pet Type
5.2.2.1. Dog- Market Insights and Forecast 2022-2032, USD Million
5.2.2.2. Cat- Market Insights and Forecast 2022-2032, USD Million
5.2.2.3. Others- Market Insights and Forecast 2022-2032, USD Million
5.2.3.By Sales Channel
5.2.3.1. Retail Offline- Market Insights and Forecast 2022-2032, USD Million
5.2.3.2. Retail E-Commerce- Market Insights and Forecast 2022-2032, USD Million
5.2.3.3. Veterinary Clinics- Market Insights and Forecast 2022-2032, USD Million
5.2.4.By Competitors
5.2.4.1. Competition Characteristics
5.2.4.2. Market Share & Analysis
6. US Pet Food Market Statistics, 2022-2032F
6.1. Market Size & Growth Outlook
6.1.1.By Revenues in US$ Million
6.1.2.By Quantity Sold in Kilo Tons
6.2. Market Segmentation & Growth Outlook
6.2.1.By Product- Market Insights and Forecast 2022-2032, USD Million
6.2.2.By Pet Type- Market Insights and Forecast 2022-2032, USD Million
6.2.3.By Sales Channel- Market Insights and Forecast 2022-2032, USD Million
7. US Pet Product Market Statistics, 2022-2032F
7.1. Market Size & Growth Outlook
7.1.1.By Revenues in US$ Million
7.2. Market Segmentation & Growth Outlook
7.2.1.By Product- Market Insights and Forecast 2022-2032, USD Million
7.2.2.By Pet Type- Market Insights and Forecast 2022-2032, USD Million
7.2.3.By Sales Channel- Market Insights and Forecast 2022-2032, USD Million
8. US Pet Care Service Market Statistics, 2022-2032F
8.1. Market Size & Growth Outlook
8.1.1.By Revenues in US$ Million
8.2. Market Segmentation & Growth Outlook
8.2.1.By Services- Market Insights and Forecast 2022-2032, USD Million
8.2.2.By Pet Type- Market Insights and Forecast 2022-2032, USD Million
8.2.3.By Sales Channel- Market Insights and Forecast 2022-2032, USD Million
9. US Grooming and Hygiene Pet Care Market Statistics, 2022-2032F
9.1. Market Size & Growth Outlook
9.1.1.By Revenues in US$ Million
9.2. Market Segmentation & Growth Outlook
9.2.1.By Product- Market Insights and Forecast 2022-2032, USD Million
9.2.2.By Pet Type- Market Insights and Forecast 2022-2032, USD Million
9.2.3.By Sales Channel- Market Insights and Forecast 2022-2032, USD Million
10. Competitive Outlook
10.1. Company Profiles
10.1.1. Nestlé Purina PetCare Co
10.1.1.1. Business Description
10.1.1.2. Product Portfolio
10.1.1.3. Collaborations & Alliances
10.1.1.4. Recent Developments
10.1.1.5. Financial Details
10.1.1.6. Others
10.1.2. Mars Inc
10.1.2.1. Business Description
10.1.2.2. Product Portfolio
10.1.2.3. Collaborations & Alliances
10.1.2.4. Recent Developments
10.1.2.5. Financial Details
10.1.2.6. Others
10.1.3. Hill's Pet Nutrition Inc
10.1.3.1. Business Description
10.1.3.2. Product Portfolio
10.1.3.3. Collaborations & Alliances
10.1.3.4. Recent Developments
10.1.3.5. Financial Details
10.1.3.6. Others
10.1.4. Blue Buffalo Co Ltd
10.1.4.1. Business Description
10.1.4.2. Product Portfolio
10.1.4.3. Collaborations & Alliances
10.1.4.4. Recent Developments
10.1.4.5. Financial Details
10.1.4.6. Others
10.1.5. Big Heart Pet Brands
10.1.5.1. Business Description
10.1.5.2. Product Portfolio
10.1.5.3. Collaborations & Alliances
10.1.5.4. Recent Developments
10.1.5.5. Financial Details
10.1.5.6. Others
10.1.6. Post Consumer Brands LLC
10.1.6.1. Business Description
10.1.6.2. Product Portfolio
10.1.6.3. Collaborations & Alliances
10.1.6.4. Recent Developments
10.1.6.5. Financial Details
10.1.6.6. Others
10.1.7. Royal Canin SAS
10.1.7.1. Business Description
10.1.7.2. Product Portfolio
10.1.7.3. Collaborations & Alliances
10.1.7.4. Recent Developments
10.1.7.5. Financial Details
10.1.7.6. Others
10.1.8. Nutro Co, The
10.1.8.1. Business Description
10.1.8.2. Product Portfolio
10.1.8.3. Collaborations & Alliances
10.1.8.4. Recent Developments
10.1.8.5. Financial Details
10.1.8.6. Others
10.1.9. Freshpet Inc
10.1.9.1. Business Description
10.1.9.2. Product Portfolio
10.1.9.3. Collaborations & Alliances
10.1.9.4. Recent Developments
10.1.9.5. Financial Details
10.1.9.6. Others
10.1.10. Wellness Pet LLC
10.1.10.1.Business Description
10.1.10.2.Product Portfolio
10.1.10.3.Collaborations & Alliances
10.1.10.4.Recent Developments
10.1.10.5.Financial Details
10.1.10.6.Others
11. Disclaimer
| Segment | Sub-Segment |
|---|---|
| By Product |
|
| By Pet Type |
|
| By Sales Channel |
|
Research Methodology
This study followed a structured approach comprising four key phases to assess the size and scope of the electro-oxidation market. The process began with thorough secondary research to collect data on the target market, related markets, and broader industry context. These findings, along with preliminary assumptions and estimates, were then validated through extensive primary research involving industry experts from across the value chain. To calculate the overall market size, both top-down and bottom-up methodologies were employed. Finally, market segmentation and data triangulation techniques were applied to refine and validate segment-level estimations.
Secondary Research
The secondary research phase involved gathering data from a wide range of credible and published sources. This step helped in identifying industry trends, defining market segmentation, and understanding the market landscape and value chain.
Sources consulted during this phase included:
- Company annual reports, investor presentations, and press releases
- Industry white papers and certified publications
- Trade directories and market-recognized databases
- Articles from authoritative authors and reputable journals
- Gold and silver standard websites
Secondary research was critical in mapping out the industry's value chain and monetary flow, identifying key market segments, understanding regional variations, and tracking significant industry developments.
Other key sources:
- Financial disclosures
- Industry associations and trade bodies
- News outlets and business magazines
- Academic journals and research studies
- Paid industry databases
Primary Research
To validate secondary data and gain deeper market insights, primary research was conducted with key stakeholders across both the supply and demand sides of the market.
On the demand side, participants included decision-makers and influencers from end-user industries—such as CIOs, CTOs, and CSOs—who provided first-hand perspectives on market needs, product usage, and future expectations.
On the supply side, interviews were conducted with manufacturers, industry associations, and institutional participants to gather insights into current offerings, product pipelines, and market challenges.
Primary interviews provided critical inputs such as:
- Market size and revenue data
- Product and service breakdowns
- Market forecasts
- Regional and application-specific trends
Stakeholders consulted included:
- Leading OEM and solution providers
- Channel and distribution partners
- End users across various applications
- Independent consultants and industry specialists
Market Size Estimation and Data Triangulation
- Identifying Key Market Participants (Secondary Research)
- Goal: To identify the major players or companies in the target market. This typically involves using publicly available data sources such as industry reports, market research publications, and financial statements of companies.
- Tools: Reports from firms like Gartner, Forrester, Euromonitor, Statista, IBISWorld, and others. Public financial statements, news articles, and press releases from top market players.
- Extracting Earnings of Key Market Participants
- Goal: To estimate the earnings generated from the product or service being analyzed. This step helps in understanding the revenue potential of each market player in a specific geography.
- Methods: Earnings data can be gathered from:
- Publicly available financial reports (for listed companies).
- Interviews and primary data sources from professionals, such as Directors, VPs, SVPs, etc. This is especially useful for understanding more nuanced, internal data that isn't publicly disclosed.
- Annual reports and investor presentations of key players.
- Data Collation and Development of a Relevant Data Model
- Goal: To collate inputs from both primary and secondary sources into a structured, data-driven model for market estimation. This model will incorporate key market KPIs and any independent variables relevant to the market.
- Key KPIs: These could include:
- Market size, growth rate, and demand drivers.
- Industry-specific metrics like market share, average revenue per customer (ARPC), or average deal size.
- External variables, such as economic growth rates, inflation rates, or commodity prices, that could affect the market.
- Data Modeling: Based on this data, the market forecasts are developed for the next 5 years. A combination of trend analysis, scenario modeling, and statistical regression might be used to generate projections.
- Scenario Analysis
- Goal: To test different assumptions and validate how sensitive the market is to changes in key variables (e.g., market demand, regulatory changes, technological disruptions).
- Types of Scenarios:
- Base Case: Based on current assumptions and historical data.
- Best-Case Scenario: Assuming favorable market conditions, regulatory environments, and technological advancements.
- Worst-Case Scenario: Accounting for adverse factors, such as economic downturns, stricter regulations, or unexpected disruptions.


