US Cards and Payments Market Report: Trends, Growth and Forecast (2026-2032)
By Instrument Type (Cards (Debit Card, Charge Card, ATM Card, Pre-Paid Card, Credit Card, Store Card), Mobile Wallets, Cheques, Others), By Card Type (Contact Smart Card, Contactless Smart Card, Non-Smart Card), By Type of Payments (B2B, B2C, C2C, C2B (E-commerce Shopping, Payment at POS Terminals)), By Transaction Type (Domestic, Foreign), By Application (Food & Groceries, Health & Pharmacies, Travel & Tourism, Hospitality, Others (Media & Entertainment)) ... Read more
|
Major Players
|
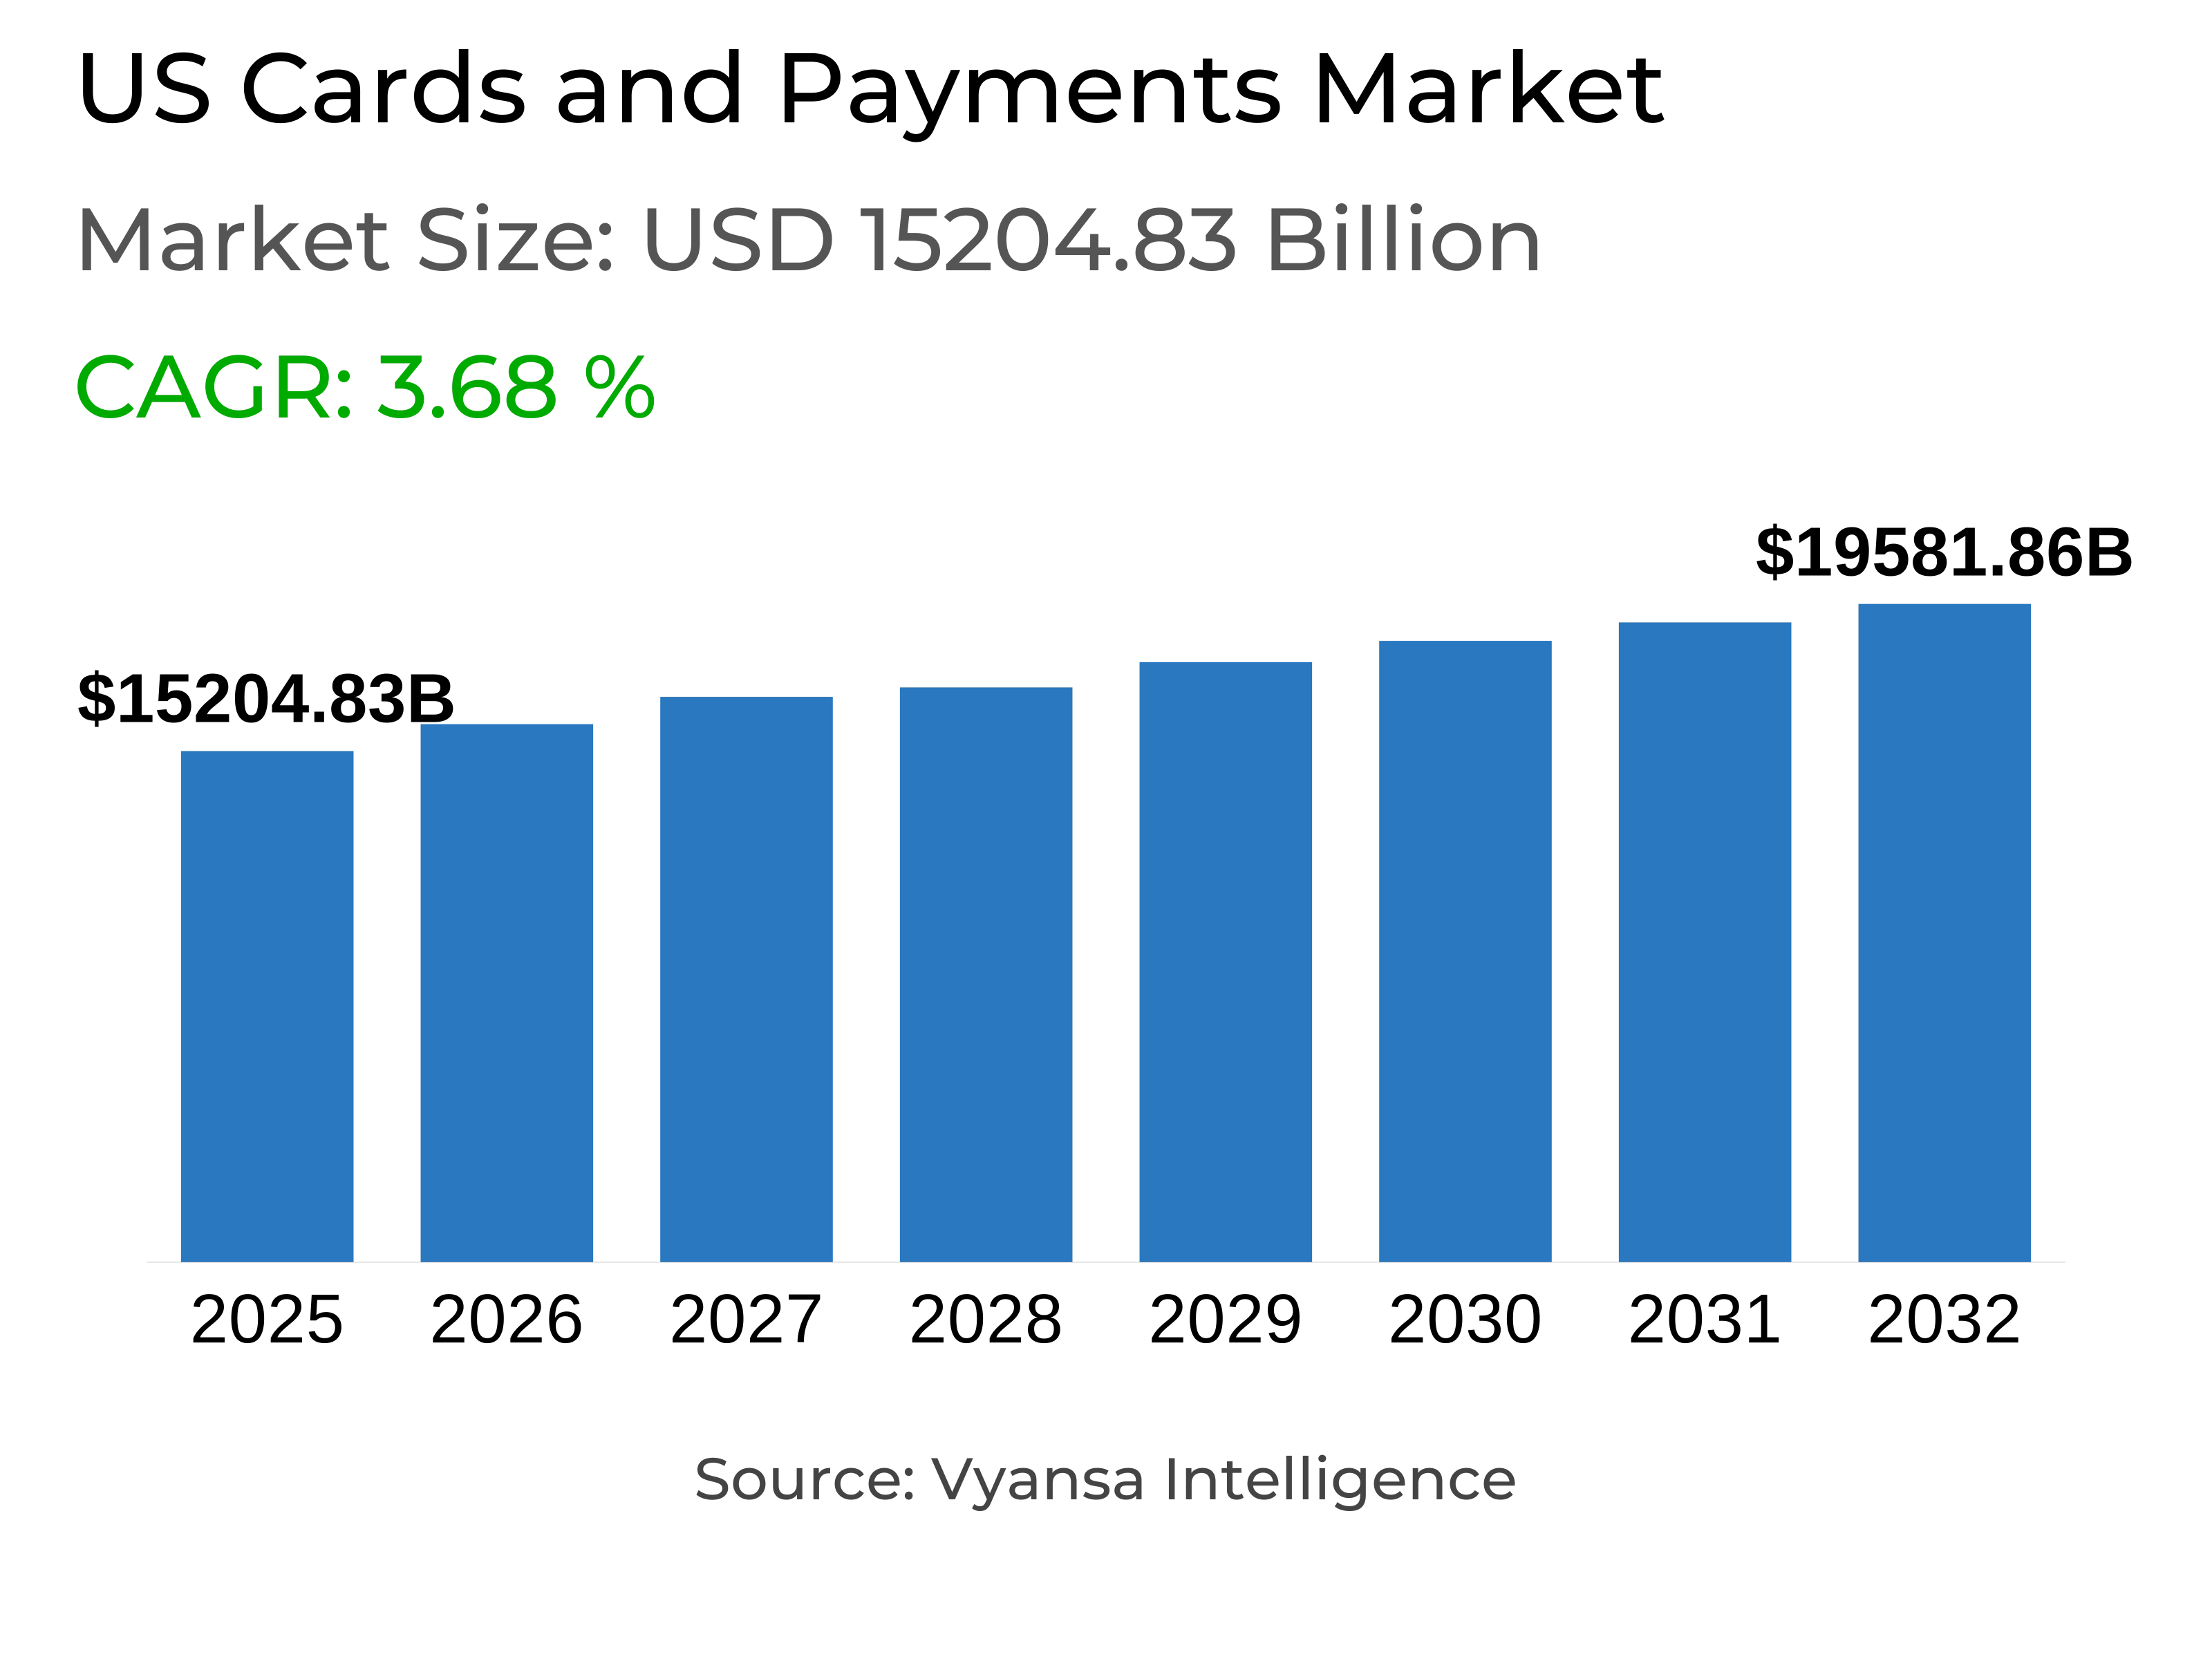
US Cards and Payments Market Statistics and Insights, 2026
- Market Size Statistics
- Cards and Payments in US is estimated at $ 15204.83 Billion.
- The market size is expected to grow to $ 19581.86 Billion by 2032.
- Market to register a CAGR of around 3.68% during 2026-32.
- Instrument Type Shares
- Cards grabbed market share of 85%.
- Cards to witness a volume CAGR of around 2.82%.
- Competition
- More than 20 companies are actively engaged in producing Cards and Payments in US.
- Top 5 companies acquired 40% of the market share.
- Citigroup Inc, US Bancorp, Discover Financial Services Inc, JP Morgan Chase & Co, American Express Co etc., are few of the top companies.
- Card Type
- Contactless Smart Card grabbed 90% of the market.
US Cards and Payments Market Outlook
The US payments and cards market at USD 15,204.83 billion is likely to grow to approximately USD 19581.86 billion by 2032, driven by sustained end users adoption and constant innovation in the financial infrastructure. With cards likely to achieve a volume CAGR of approximately 2.82%, the market will keep reinforcing its dominance over cash, mirroring entrenched end users preference for card- and digital-based payments.
Credit cards continue to be the hub of competition in the US, with zero-fee entry-level cards drawing mass end users and cobranded cards with strong continuance in categories like airlines and hotels. Premium credit cards, with services such as lounge access and concierge services, continue to perform well among high-end users. In parallel, contactless smart cards, accounting for almost 90% of the market, reflect end users' love for convenience, speed, and security in transactions.
Regulatory framework will also be a determinative factor. The new Trump administration is moving in the direction of deregulation, a contrast to the earlier emphasis on end users protection and regulation. The change is bound to redefine the payments space, especially in segments such as cryptocurrency, where a more accommodative approach could unlock new opportunities despite ongoing volatility. In the meantime, the imminent takeover of Discover Financial Services by Capital One would change the competitive dynamics to form one of the strongest competitors in the US and increase international network reach.
Ahead, though economic uncertainty may be created by external pressures such as tariffs, immigration policy shifts, and inflation threats, the underlying opportunities for the cards and payments market remain solid. The US should continue to be one of the world's most card-dominated markets, with banks and other financial institutions concentrating on rewards, loyalty, and digital innovation to capture end users spend and sustain growth momentum.

US Cards and Payments Market Growth Driver
Slowing Inflation and Interest Rate Reductions Spurring Card Spend
The consistent drop in inflation and the following interest rate reductions serve as a significant spur to the expansion of financial cards and transactions in America. When inflation drops, the Federal Reserve tweaks its monetary policy, lowering the cost of borrowing. This makes credit cards and loans slightly cheaper for end users, which leads them to use financial cards for daily expenditure more and more. With reduced pressure on family finances, end users feel comfortable in stepping up use of electronic payment methods against cash.
Meanwhile, solid job growth and low unemployment further entrench this trend. With increased disposable income and less financial pressure, end users are more likely to embrace and actively employ various payment card types. This situation provides good opportunities for issuers to grow their businesses since falling inflation and interest rate reductions specifically stimulate the overall demand for card transactions.
US Cards and Payments Market Trend
Increased Demand for Cobranded Credit Cards
Cobranded credit cards are increasingly becoming a decisive trend in the US, representing a competitive class higher than standard credit cards. The nation boasts one of the most advanced markets for such products, especially in the airline and hotel sectors. With its highly concentrated hotels market and the inclusion of numerous global and local brands, the US represents solid footing for cobranded card products. end users are rewarded with rewards, loyalty points, and travel benefits, which make these cards a desirable option.
Cobranded cards by airlines also prosper, as they are backed by a multitude of international and domestic airlines that serve in the US. From legacy major airlines to low-cost airlines, credit cobranded cards are sold aggressively to passengers, who are promoted even on flight levels. This extensive penetration is reflective of the increasing end users demand for specialized rewards, making cobranded cards a significant element of the payment ecosystem.
Unlock Market Intelligence
Explore the market potential with our data-driven report
US Cards and Payments Market Segmentation Analysis

By Instrument Type
- Cards
- Mobile Wallets
- Cheques
- Others
The segment with the highest market share under the Instrument Type is cards, with a market share of 85% of the US payment and cards market. Credit cards are the most revolutionary concept in this segment, with heavy competition between providers as a result of interchange fee caps on debit cards and with payments already heavily switched to financial cards. Low-end credit cards continue to be very popular, with zero annual fees and easy offerings appealing to a wide end users base.
These products also enable end users to reap rewards programmes that rebate partial interchange fees paid by merchants, in effect, putting cash back in their hands. Enjoying comfortable rewards rates and high penetration, credit cards will continue to have robust growth momentum, driven by product design and end users benefit innovations. In the future, the card segment is likely to expand at a volume CAGR of approximately 2.82%, continuing to be the dominant payment tool.
Top Companies in US Cards and Payments Market
The top companies operating in the market include Citigroup Inc, US Bancorp, Discover Financial Services Inc, JP Morgan Chase & Co, American Express Co, Bank of America Corp, Wells Fargo & Co, Capital One Financial Corp, Barclaycard International, Synchrony Financial, etc., are the top players operating in the US Cards and Payments Market.
Frequently Asked Questions
Related Report
1. Market Segmentation
1.1. Research Scope
1.2. Research Methodology
1.3. Definitions and Assumptions
2. Executive Summary
3. US Cards and Payments Market Policies, Regulations, and Standards
4. US Cards and Payments Market Dynamics
4.1. Growth Factors
4.2. Challenges
4.3. Trends
4.4. Opportunities
5. US Cards and Payments Market Statistics, 2022-2032F
5.1. Market Size & Growth Outlook
5.1.1. By Revenues in US$ Million
5.2. Market Segmentation & Growth Outlook
5.2.1. By Instrument Type
5.2.1.1. Cards- Market Insights and Forecast 2022-2032, USD Million
5.2.1.1.1. Debit Card- Market Insights and Forecast 2022-2032, USD Million
5.2.1.1.2. Charge Card- Market Insights and Forecast 2022-2032, USD Million
5.2.1.1.3. ATM Card- Market Insights and Forecast 2022-2032, USD Million
5.2.1.1.4. Pre-Paid Card- Market Insights and Forecast 2022-2032, USD Million
5.2.1.1.5. Credit Card- Market Insights and Forecast 2022-2032, USD Million
5.2.1.1.6. Store Card- Market Insights and Forecast 2022-2032, USD Million
5.2.1.2. Mobile Wallets- Market Insights and Forecast 2022-2032, USD Million
5.2.1.3. Cheques- Market Insights and Forecast 2022-2032, USD Million
5.2.1.4. Others- Market Insights and Forecast 2022-2032, USD Million
5.2.2. By Card Type
5.2.2.1. Contact Smart Card- Market Insights and Forecast 2022-2032, USD Million
5.2.2.2. Contactless Smart Card- Market Insights and Forecast 2022-2032, USD Million
5.2.2.3. Non-Smart Card- Market Insights and Forecast 2022-2032, USD Million
5.2.3. By Type of Payments
5.2.3.1. B2B- Market Insights and Forecast 2022-2032, USD Million
5.2.3.2. B2C- Market Insights and Forecast 2022-2032, USD Million
5.2.3.3. C2C- Market Insights and Forecast 2022-2032, USD Million
5.2.3.4. C2B- Market Insights and Forecast 2022-2032, USD Million
5.2.3.4.1. E-commerce Shopping- Market Insights and Forecast 2022-2032, USD Million
5.2.3.4.2. Payment at POS Terminals- Market Insights and Forecast 2022-2032, USD Million
5.2.4. By Transaction Type
5.2.4.1. Domestic- Market Insights and Forecast 2022-2032, USD Million
5.2.4.2. Foreign- Market Insights and Forecast 2022-2032, USD Million
5.2.5. By Application
5.2.5.1. Food & Groceries- Market Insights and Forecast 2022-2032, USD Million
5.2.5.2. Health & Pharmacies- Market Insights and Forecast 2022-2032, USD Million
5.2.5.3. Travel & Tourism- Market Insights and Forecast 2022-2032, USD Million
5.2.5.4. Hospitality- Market Insights and Forecast 2022-2032, USD Million
5.2.5.5. Others (Media & Entertainment)- Market Insights and Forecast 2022-2032, USD Million
5.2.6. By Competitors
5.2.6.1. Competition Characteristics
5.2.6.2. Market Share & Analysis
6. US Cards Market Statistics, 2022-2032F
6.1. Market Size & Growth Outlook
6.1.1. By Revenues in US$ Million
6.2. Market Segmentation & Growth Outlook
6.2.1. By Card Type- Market Insights and Forecast 2022-2032, USD Million
6.2.2. By Type of Payments- Market Insights and Forecast 2022-2032, USD Million
6.2.3. By Transaction Type- Market Insights and Forecast 2022-2032, USD Million
6.2.4. By Application- Market Insights and Forecast 2022-2032, USD Million
7. US Mobile Wallets Market Statistics, 2022-2032F
7.1. Market Size & Growth Outlook
7.1.1. By Revenues in US$ Million
7.2. Market Segmentation & Growth Outlook
7.2.1. By Type of Payments- Market Insights and Forecast 2022-2032, USD Million
7.2.2. By Transaction Type- Market Insights and Forecast 2022-2032, USD Million
7.2.3. By Application- Market Insights and Forecast 2022-2032, USD Million
8. US Cheques Market Statistics, 2022-2032F
8.1. Market Size & Growth Outlook
8.1.1. By Revenues in US$ Million
8.2. Market Segmentation & Growth Outlook
8.2.1. By Type of Payments- Market Insights and Forecast 2022-2032, USD Million
8.2.2. By Transaction Type- Market Insights and Forecast 2022-2032, USD Million
8.2.3. By Application- Market Insights and Forecast 2022-2032, USD Million
9. Competitive Outlook
9.1. Company Profiles
9.1.1. JP Morgan Chase & Co
9.1.1.1. Business Description
9.1.1.2. Product Portfolio
9.1.1.3. Collaborations & Alliances
9.1.1.4. Recent Developments
9.1.1.5. Financial Details
9.1.1.6. Others
9.1.2. American Express Co
9.1.2.1. Business Description
9.1.2.2. Product Portfolio
9.1.2.3. Collaborations & Alliances
9.1.2.4. Recent Developments
9.1.2.5. Financial Details
9.1.2.6. Others
9.1.3. Bank of America Corp
9.1.3.1. Business Description
9.1.3.2. Product Portfolio
9.1.3.3. Collaborations & Alliances
9.1.3.4. Recent Developments
9.1.3.5. Financial Details
9.1.3.6. Others
9.1.4. Wells Fargo & Co
9.1.4.1. Business Description
9.1.4.2. Product Portfolio
9.1.4.3. Collaborations & Alliances
9.1.4.4. Recent Developments
9.1.4.5. Financial Details
9.1.4.6. Others
9.1.5. Citigroup Inc
9.1.5.1. Business Description
9.1.5.2. Product Portfolio
9.1.5.3. Collaborations & Alliances
9.1.5.4. Recent Developments
9.1.5.5. Financial Details
9.1.5.6. Others
9.1.6. Capital One Financial Corp
9.1.6.1. Business Description
9.1.6.2. Product Portfolio
9.1.6.3. Collaborations & Alliances
9.1.6.4. Recent Developments
9.1.6.5. Financial Details
9.1.6.6. Others
9.1.7. US Bancorp
9.1.7.1. Business Description
9.1.7.2. Product Portfolio
9.1.7.3. Collaborations & Alliances
9.1.7.4. Recent Developments
9.1.7.5. Financial Details
9.1.7.6. Others
9.1.8. Discover Financial Services Inc
9.1.8.1. Business Description
9.1.8.2. Product Portfolio
9.1.8.3. Collaborations & Alliances
9.1.8.4. Recent Developments
9.1.8.5. Financial Details
9.1.8.6. Others
9.1.9. Synchrony Financial
9.1.9.1. Business Description
9.1.9.2. Product Portfolio
9.1.9.3. Collaborations & Alliances
9.1.9.4. Recent Developments
9.1.9.5. Financial Details
9.1.9.6. Others
9.1.10. USAA Savings Bank
9.1.10.1. Business Description
9.1.10.2. Product Portfolio
9.1.10.3. Collaborations & Alliances
9.1.10.4. Recent Developments
9.1.10.5. Financial Details
9.1.10.6. Others
10. Disclaimer
| Segment | Sub-Segment |
|---|---|
| By Instrument Type |
|
| By Card Type |
|
| By Type of Payments |
|
| By Transaction Type |
|
| By Application |
|
Research Methodology
This study followed a structured approach comprising four key phases to assess the size and scope of the electro-oxidation market. The process began with thorough secondary research to collect data on the target market, related markets, and broader industry context. These findings, along with preliminary assumptions and estimates, were then validated through extensive primary research involving industry experts from across the value chain. To calculate the overall market size, both top-down and bottom-up methodologies were employed. Finally, market segmentation and data triangulation techniques were applied to refine and validate segment-level estimations.
Secondary Research
The secondary research phase involved gathering data from a wide range of credible and published sources. This step helped in identifying industry trends, defining market segmentation, and understanding the market landscape and value chain.
Sources consulted during this phase included:
- Company annual reports, investor presentations, and press releases
- Industry white papers and certified publications
- Trade directories and market-recognized databases
- Articles from authoritative authors and reputable journals
- Gold and silver standard websites
Secondary research was critical in mapping out the industry's value chain and monetary flow, identifying key market segments, understanding regional variations, and tracking significant industry developments.
Other key sources:
- Financial disclosures
- Industry associations and trade bodies
- News outlets and business magazines
- Academic journals and research studies
- Paid industry databases
Primary Research
To validate secondary data and gain deeper market insights, primary research was conducted with key stakeholders across both the supply and demand sides of the market.
On the demand side, participants included decision-makers and influencers from end-user industries—such as CIOs, CTOs, and CSOs—who provided first-hand perspectives on market needs, product usage, and future expectations.
On the supply side, interviews were conducted with manufacturers, industry associations, and institutional participants to gather insights into current offerings, product pipelines, and market challenges.
Primary interviews provided critical inputs such as:
- Market size and revenue data
- Product and service breakdowns
- Market forecasts
- Regional and application-specific trends
Stakeholders consulted included:
- Leading OEM and solution providers
- Channel and distribution partners
- End users across various applications
- Independent consultants and industry specialists
Market Size Estimation and Data Triangulation
- Identifying Key Market Participants (Secondary Research)
- Goal: To identify the major players or companies in the target market. This typically involves using publicly available data sources such as industry reports, market research publications, and financial statements of companies.
- Tools: Reports from firms like Gartner, Forrester, Euromonitor, Statista, IBISWorld, and others. Public financial statements, news articles, and press releases from top market players.
- Extracting Earnings of Key Market Participants
- Goal: To estimate the earnings generated from the product or service being analyzed. This step helps in understanding the revenue potential of each market player in a specific geography.
- Methods: Earnings data can be gathered from:
- Publicly available financial reports (for listed companies).
- Interviews and primary data sources from professionals, such as Directors, VPs, SVPs, etc. This is especially useful for understanding more nuanced, internal data that isn't publicly disclosed.
- Annual reports and investor presentations of key players.
- Data Collation and Development of a Relevant Data Model
- Goal: To collate inputs from both primary and secondary sources into a structured, data-driven model for market estimation. This model will incorporate key market KPIs and any independent variables relevant to the market.
- Key KPIs: These could include:
- Market size, growth rate, and demand drivers.
- Industry-specific metrics like market share, average revenue per customer (ARPC), or average deal size.
- External variables, such as economic growth rates, inflation rates, or commodity prices, that could affect the market.
- Data Modeling: Based on this data, the market forecasts are developed for the next 5 years. A combination of trend analysis, scenario modeling, and statistical regression might be used to generate projections.
- Scenario Analysis
- Goal: To test different assumptions and validate how sensitive the market is to changes in key variables (e.g., market demand, regulatory changes, technological disruptions).
- Types of Scenarios:
- Base Case: Based on current assumptions and historical data.
- Best-Case Scenario: Assuming favorable market conditions, regulatory environments, and technological advancements.
- Worst-Case Scenario: Accounting for adverse factors, such as economic downturns, stricter regulations, or unexpected disruptions.


