UK Water Pump Market Report: Trends, Growth and Forecast (2026-2032)
By Pump Type (Centrifugal Pumps (Overhung Pumps (Vertical Line, Horizontal End Suction), Split Case Pumps (Single/Two Stage, Multi Stage), Vertical Pumps (Turbine, Axial, Mixed Flow), Submersible Pumps (Solid Handling, Non-Solid Handling)), Positive Displacement Pump (Diaphragm Pumps, Piston Pumps, Gear Pumps, Lobe Pumps, Progressive Cavity Pumps, Screw Pumps, Vane Pumps, Peristaltic Pumps, Others)), By End User (Oil & Gas, Power, Residential, Agriculture & Irrigation, Commercial Building, HVAC, Chemical, Water & Wastewater, Food & Beverage, Others) ... Read more

|
Major Players
|
UK Water Pump Market Statistics and Insights, 2026
- Market Size Statistics
- Water Pump in UK is estimated at $ 1.66 Billion.
- The market size is expected to grow to $ 1.88 Billion by 2032.
- Market to register a CAGR of around 1.79% during 2026-32.
- Pump Type Segment
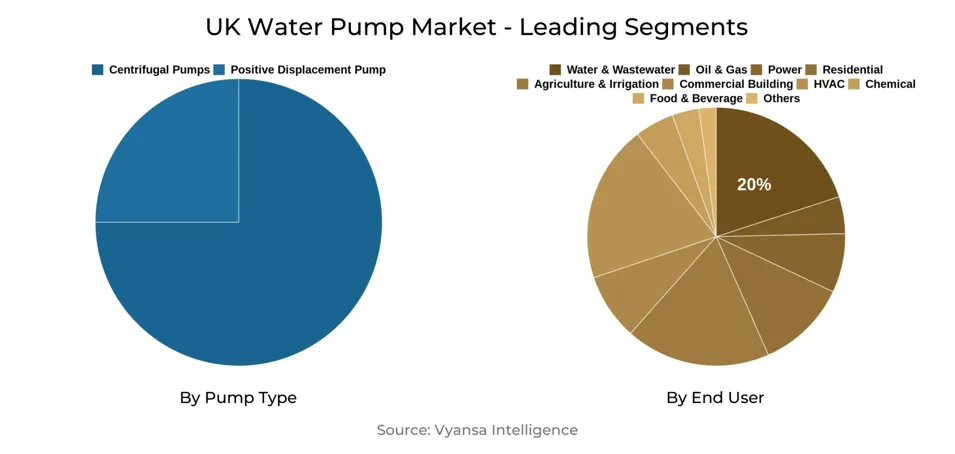
- Centrifugal Pumps continues to dominate the market.
- Competition
- More than 10 companies are actively engaged in producing Water Pump in UK.
- Top 5 companies acquired the maximum share of the market.
- ITT, IDEX, Dover, Flowserve, Sulzer AG etc., are few of the top companies.
- End User
- Water & Wastewater grabbed 20% of the market.
UK Water Pump Market Outlook
UK water pump industry worth $1.66 billion is experiencing sustained growth fueled by huge infrastructure spending and modemization schemes. Government and water companies have promised £104 billion in 2025-2030 for modernization, including new reservoirs, treatment plant upgrades, and leak reduction schemes. These initiatives have a direct impact on robust demand for pumping systems at both water supply and wastewater treatment plants.
In spite of this growth trend, the industry struggles due to aging infrastructure. Replacing just 0.05% of pipe networks every year, as opposed to 0.5% in the rest of Europe, the UK still grapples with elevated leakage levels of 2,690 megalitres per day. This inefficiency places added operational stress on pumps, and severe weather conditions put additional strain on the network. Yet these are opportunities for modern pumping technologies to enhance efficiency and resilience.
Digital innovation is reshaping the market environment. £1.8 billion of smart water meter installations and digital twin and AI-driven monitoring systems are increasing efficiency in treatment and distribution networks. Examples of success, including Scottish Water's 60% gains in energy efficiency at pumping stations, demonstrate how technology uptake is improving the performance of pump systems and consistent with sustainability objectives.
The UK market for water pumps is expected to stand at $1.88 billion by 2032, driven by energy efficiency standards, climatic resilience demands, and continuing modernization initiatives. Centrifugal pumps continue to be the largest segment because of their adaptability, while the Water & Wastewater industry has the highest end-user percentage at 20%. With necessary investment in clean water supply as well as wastewater treatment, the industry provides stable demand, putting smart and advanced pump solutions at the forefront of market growth.

UK Water Pump Market Growth Driver
The UK water industry is witnessing unprecedented growth pace through record-breaking investment in infrastructure. The Environment Agency has this year been allocated its biggest ever budget of £189 million to address water pollution, a 64% rise from 2023-2024. This boom is supplemented by the cumulative investment of water companies' £104 billion between 2025-2030, almost doubling spending on the last five years. These investments include 30 key water supply initiatives, including nine new reservoirs with construction under way over the next 15 years.
The infrastructure development has a direct impact on the water pump industry as treatment plants see comprehensive capacity expansions. For example, Southern Water has finished £4 million upgrades to treatment works in East Hampshire, doubling capacity at one of them to receive 50,000 liters of wastewater. In addition, £6 billion is earmarked specifically for fighting nutrient pollution upgrade, with £5 billion going towards water supply expansion and with significant demand for sophisticated pumping solutions in treatment works and distribution networks.
UK Water Pump Market Challenge
The UK water industry is presently struggling with degrading infrastructure that has a direct bearing on the operation and efficiency of pump systems. Existing statistics indicate that water companies only change 0.05% of their pipe networks every year, which implies that existing infrastructure would take 2,000 years to replace at current levels. This replacement rate is paltry compared to European averages of 0.5% per annum, with pipes lasting about 200 years. Thames Water is a prime example of this problem, with 36% of its mains network being over 100 years old.
Aging infrastructure causes cascading operational challenges for water pump systems. England and Wales now lose 2,690 megalitres of treated water each day to leakage, which is equivalent to supplying nearly 3.34 million people's daily household use. These chronic leaks make pump systems labor harder and run less efficiently, and severe weather conditions amplify the issue by placing further strain on aging infrastructure. To add, the lack of skills adds to these headaches, with 26% of survey participants citing recruitment issues as the industry's greatest challenge, possibly hindering maintenance and upgrade that can optimize pump systems.
Unlock Market Intelligence
Explore the market potential with our data-driven report
UK Water Pump Market Trend
The UK water industry is moving quickly to adopt digital transformation technologies to support operational efficiency and monitoring. The deployment of smart water meters has gained strong momentum, with 38 million smart and advanced meters being deployed in Great Britain by end-2024, which is 66% of total meters. Water companies have committed £1.8 billion for smart meter deployments in AMP8 (2025-2030) for both household and non-household installations to provide accurate consumption data and minimize operational losses.
Digital twin technology is transforming the management of water infrastructure, with Thames Water spearheading a £334,800 industry-funded initiative to create universal data standards for digital twin adoption. The virtual twins support real-time monitoring of systems and predictive maintenance operations. The technology achieved tried-and-tested success with Northumbrian Water's £20 million smart sewer scheme that recorded an 80% fall in storm overflow spills through the use of AI. In addition, Scottish Water achieved energy efficiency gains of as much as 60% at 200 pumping stations through digital optimization technologies, which highlights the industry's emphasis on sustainable, technology-based operations.
UK Water Pump Market Opportunity
The UK's dedication to water industry change creates major opportunities for high-technology pumping solutions and equipment. Government plans include £104 billion of infrastructure investment between 2025-2030, including dedicated funding for key capacity additions and efficiency enhancements. This involves commitments to supply an additional 424 million extra litres per day by 2030, the building of 10 new reservoirs, and the upgrading of more than 140 wastewater treatment works to achieve very strict nutrient removal standards.
Energy efficiency requirements drive demand for intelligent pumping systems, as the water treatment sector accounts for 36% of the total energy used by the water industry. Smart meter rollouts worth £1.8 billion create opportunities for integrated monitoring solutions and demand management systems. The regulatory push for leakage reduction targets - including a 17% cut by 2030 - necessitates sophisticated leak detection and pressure management technologies. Moreover, investment in climate resilience and coping with extraordinary weather conditions provides opportunities for adaptive pump systems that can address variable flow conditions and increased capacity demands.
| Report Coverage | Details |
|---|---|
| Market Forecast | 2026-32 |
| USD Value 2025 | $ 1.66 Billion |
| USD Value 2032 | $ 1.88 Billion |
| CAGR 2026-2032 | 1.79% |
| Largest Category | Centrifugal Pumps segment leads the market |
| Top Drivers | Massive Infrastructure Investment Drives Market Growth |
| Top Challenges | Ageing Network Infrastructure Creates Complex Operational Challenges |
| Top Trends | Digital Innovation Accelerates Smart Water Management Solutions |
| Top Opportunities | Infrastructure Modernization Creates Substantial Growth Opportunities |
| Key Players | ITT, IDEX, Dover, Flowserve, Sulzer AG, KSB, Xylem, Grundfos, Ebara, SPX Flow and Others. |
Unlock Market Intelligence
Explore the market potential with our data-driven report
UK Water Pump Market Segmentation Analysis
By Pump Type
- Centrifugal Pumps
- Positive Displacement Pump
The most popular segment under Pump Type with the largest market share is Centrifugal Pumps, which remain the leading pumps in the market. This is due to their broad use across water supply, wastewater treatment, and industrial applications, where they move vast amounts of water at affordable prices. Being reliable, uncomplicated, and versatile, they are the go-to pump in various industries ranging from municipal water systems to industries with high-flow applications.
Centrifugal pumps retain their leading position as a result of their best performance characteristics in the UK's vast water infrastructure system. The segment is supported by continuous investments in infrastructure, such as £104 billion worth of water sector upgrades between 2025-2030, which significantly depend on centrifugal pumping technology for water distribution and treatment processes. Their sustained leadership in the market is also supported by their compatibility with smart monitoring systems and energy-efficient variable speed drives, which meet the industry's digitalization plans.
By End User
- Oil & Gas
- Power
- Residential
- Agriculture & Irrigation
- Commercial Building
- HVAC
- Chemical
- Water & Wastewater
- Food & Beverage
- Others
The most penetrated market under End User is Water & Wastewater, which captured 20% of the market. It is the largest application area because of massive investments made by the government in water treatment facilities and the continuous demand for clean water supply and waste water management throughout the UK. The segment enjoys historic levels of infrastructure investments, such as £12 billion designated for storm overflow upgrade and £6 billion for nutrient pollution fighting upgrade.
Water & Wastewater segment's leadership is supported by regulatory mandates and capacity addition schemes. The most rapidly growing End User segment is HVAC, with a CAGR of 4.62%, led by increased emphasis on energy-efficient heating and cooling technologies. Yet, Water & Wastewater ensures its market dominance with ongoing modernization requirements, such as improvements to more than 140 works to comply with rigorous environmental standards and construction of large new facilities to address expanding populations. The industry's consistent demand is driven by basic service requirements and infrastructure resilience enhancements driven by climate change adaptation.
Top Companies in UK Water Pump Market
The top companies operating in the market include ITT, IDEX, Dover, Flowserve, Sulzer AG, KSB, Xylem, Grundfos, Ebara, SPX Flow, etc., are the top players operating in the UK Water Pump Market.
Frequently Asked Questions
Related Report
1. Market Segmentation
1.1. Research Scope
1.2. Research Methodology
1.3. Definitions and Assumptions
2. Executive Summary
3. UK Water Pump Market Policies, Regulations, and Standards
4. UK Water Pump Market Dynamics
4.1. Growth Factors
4.2. Challenges
4.3. Trends
4.4. Opportunities
5. UK Water Pump Market Statistics, 2022-2032F
5.1. Market Size & Growth Outlook
5.1.1.By Revenues in US$ Million
5.1.2.By Units Sold in Million Units
5.2. Market Segmentation & Growth Outlook
5.2.1.By Pump Type
5.2.1.1. Centrifugal Pumps- Market Insights and Forecast 2022-2032, USD Million
5.2.1.1.1. Overhung Pumps- Market Insights and Forecast 2022-2032, USD Million
5.2.1.1.1.1. Vertical Line- Market Insights and Forecast 2022-2032, USD Million
5.2.1.1.1.2. Horizontal End Suction- Market Insights and Forecast 2022-2032, USD Million
5.2.1.1.2. Split Case Pumps- Market Insights and Forecast 2022-2032, USD Million
5.2.1.1.2.1. Single/Two Stage- Market Insights and Forecast 2022-2032, USD Million
5.2.1.1.2.2. Multi Stage- Market Insights and Forecast 2022-2032, USD Million
5.2.1.1.3. Vertical Pumps- Market Insights and Forecast 2022-2032, USD Million
5.2.1.1.3.1. Turbine- Market Insights and Forecast 2022-2032, USD Million
5.2.1.1.3.2. Axial- Market Insights and Forecast 2022-2032, USD Million
5.2.1.1.3.3. Mixed Flow- Market Insights and Forecast 2022-2032, USD Million
5.2.1.1.4. Submersible Pumps- Market Insights and Forecast 2022-2032, USD Million
5.2.1.1.4.1. Solid Handling- Market Insights and Forecast 2022-2032, USD Million
5.2.1.1.4.2. Non-Solid Handling- Market Insights and Forecast 2022-2032, USD Million
5.2.1.2. Positive Displacement Pump- Market Insights and Forecast 2022-2032, USD Million
5.2.1.2.1. Diaphragm Pumps- Market Insights and Forecast 2022-2032, USD Million
5.2.1.2.2. Piston Pumps- Market Insights and Forecast 2022-2032, USD Million
5.2.1.2.3. Gear Pumps- Market Insights and Forecast 2022-2032, USD Million
5.2.1.2.4. Lobe Pumps- Market Insights and Forecast 2022-2032, USD Million
5.2.1.2.5. Progressive Cavity Pumps- Market Insights and Forecast 2022-2032, USD Million
5.2.1.2.6. Screw Pumps- Market Insights and Forecast 2022-2032, USD Million
5.2.1.2.7. Vane Pumps- Market Insights and Forecast 2022-2032, USD Million
5.2.1.2.8. Peristaltic Pumps- Market Insights and Forecast 2022-2032, USD Million
5.2.1.2.9. Others- Market Insights and Forecast 2022-2032, USD Million
5.2.2.By End User
5.2.2.1. Oil & Gas- Market Insights and Forecast 2022-2032, USD Million
5.2.2.2. Power- Market Insights and Forecast 2022-2032, USD Million
5.2.2.3. Residential- Market Insights and Forecast 2022-2032, USD Million
5.2.2.4. Agriculture & Irrigation- Market Insights and Forecast 2022-2032, USD Million
5.2.2.5. Commercial Building- Market Insights and Forecast 2022-2032, USD Million
5.2.2.6. HVAC- Market Insights and Forecast 2022-2032, USD Million
5.2.2.7. Chemical- Market Insights and Forecast 2022-2032, USD Million
5.2.2.8. Water & Wastewater- Market Insights and Forecast 2022-2032, USD Million
5.2.2.9. Food & Beverage- Market Insights and Forecast 2022-2032, USD Million
5.2.2.10. Others- Market Insights and Forecast 2022-2032, USD Million
5.2.3.By Competitors
5.2.3.1. Competition Characteristics
5.2.3.2. Market Share & Analysis
6. UK Centrifugal Pump Water Pump Market Statistics, 2022-2032F
6.1. Market Size & Growth Outlook
6.1.1.By Revenues in US$ Million
6.1.2.By Units Sold in Million Units
6.2. Market Segmentation & Growth Outlook
6.2.1.By Pump Type- Market Insights and Forecast 2022-2032, USD Million
6.2.2.By End User- Market Insights and Forecast 2022-2032, USD Million
7. UK Positive Displacement Pump Water Pump Market Statistics, 2022-2032F
7.1. Market Size & Growth Outlook
7.1.1.By Revenues in US$ Million
7.1.2.By Units Sold in Million Units
7.2. Market Segmentation & Growth Outlook
7.2.1.By Pump Type- Market Insights and Forecast 2022-2032, USD Million
7.2.2.By End User- Market Insights and Forecast 2022-2032, USD Million
8. Competitive Outlook
8.1. Company Profiles
8.1.1.Flowserve
8.1.1.1. Business Description
8.1.1.2. Product Portfolio
8.1.1.3. Collaborations & Alliances
8.1.1.4. Recent Developments
8.1.1.5. Financial Details
8.1.1.6. Others
8.1.2.Sulzer AG
8.1.2.1. Business Description
8.1.2.2. Product Portfolio
8.1.2.3. Collaborations & Alliances
8.1.2.4. Recent Developments
8.1.2.5. Financial Details
8.1.2.6. Others
8.1.3.KSB
8.1.3.1. Business Description
8.1.3.2. Product Portfolio
8.1.3.3. Collaborations & Alliances
8.1.3.4. Recent Developments
8.1.3.5. Financial Details
8.1.3.6. Others
8.1.4.Xylem
8.1.4.1. Business Description
8.1.4.2. Product Portfolio
8.1.4.3. Collaborations & Alliances
8.1.4.4. Recent Developments
8.1.4.5. Financial Details
8.1.4.6. Others
8.1.5.Grundfos
8.1.5.1. Business Description
8.1.5.2. Product Portfolio
8.1.5.3. Collaborations & Alliances
8.1.5.4. Recent Developments
8.1.5.5. Financial Details
8.1.5.6. Others
8.1.6.ITT
8.1.6.1. Business Description
8.1.6.2. Product Portfolio
8.1.6.3. Collaborations & Alliances
8.1.6.4. Recent Developments
8.1.6.5. Financial Details
8.1.6.6. Others
8.1.7.IDEX
8.1.7.1. Business Description
8.1.7.2. Product Portfolio
8.1.7.3. Collaborations & Alliances
8.1.7.4. Recent Developments
8.1.7.5. Financial Details
8.1.7.6. Others
8.1.8.Dover
8.1.8.1. Business Description
8.1.8.2. Product Portfolio
8.1.8.3. Collaborations & Alliances
8.1.8.4. Recent Developments
8.1.8.5. Financial Details
8.1.8.6. Others
8.1.9.Ebara
8.1.9.1. Business Description
8.1.9.2. Product Portfolio
8.1.9.3. Collaborations & Alliances
8.1.9.4. Recent Developments
8.1.9.5. Financial Details
8.1.9.6. Others
8.1.10. SPX Flow
8.1.10.1. Business Description
8.1.10.2. Product Portfolio
8.1.10.3. Collaborations & Alliances
8.1.10.4. Recent Developments
8.1.10.5. Financial Details
8.1.10.6. Others
9. Disclaimer
| Segment | Sub-Segment |
|---|---|
| By Pump Type |
|
| By End User |
|
Research Methodology
This study followed a structured approach comprising four key phases to assess the size and scope of the electro-oxidation market. The process began with thorough secondary research to collect data on the target market, related markets, and broader industry context. These findings, along with preliminary assumptions and estimates, were then validated through extensive primary research involving industry experts from across the value chain. To calculate the overall market size, both top-down and bottom-up methodologies were employed. Finally, market segmentation and data triangulation techniques were applied to refine and validate segment-level estimations.
Secondary Research
The secondary research phase involved gathering data from a wide range of credible and published sources. This step helped in identifying industry trends, defining market segmentation, and understanding the market landscape and value chain.
Sources consulted during this phase included:
- Company annual reports, investor presentations, and press releases
- Industry white papers and certified publications
- Trade directories and market-recognized databases
- Articles from authoritative authors and reputable journals
- Gold and silver standard websites
Secondary research was critical in mapping out the industry's value chain and monetary flow, identifying key market segments, understanding regional variations, and tracking significant industry developments.
Other key sources:
- Financial disclosures
- Industry associations and trade bodies
- News outlets and business magazines
- Academic journals and research studies
- Paid industry databases
Primary Research
To validate secondary data and gain deeper market insights, primary research was conducted with key stakeholders across both the supply and demand sides of the market.
On the demand side, participants included decision-makers and influencers from end-user industries—such as CIOs, CTOs, and CSOs—who provided first-hand perspectives on market needs, product usage, and future expectations.
On the supply side, interviews were conducted with manufacturers, industry associations, and institutional participants to gather insights into current offerings, product pipelines, and market challenges.
Primary interviews provided critical inputs such as:
- Market size and revenue data
- Product and service breakdowns
- Market forecasts
- Regional and application-specific trends
Stakeholders consulted included:
- Leading OEM and solution providers
- Channel and distribution partners
- End users across various applications
- Independent consultants and industry specialists
Market Size Estimation and Data Triangulation
- Identifying Key Market Participants (Secondary Research)
- Goal: To identify the major players or companies in the target market. This typically involves using publicly available data sources such as industry reports, market research publications, and financial statements of companies.
- Tools: Reports from firms like Gartner, Forrester, Euromonitor, Statista, IBISWorld, and others. Public financial statements, news articles, and press releases from top market players.
- Extracting Earnings of Key Market Participants
- Goal: To estimate the earnings generated from the product or service being analyzed. This step helps in understanding the revenue potential of each market player in a specific geography.
- Methods: Earnings data can be gathered from:
- Publicly available financial reports (for listed companies).
- Interviews and primary data sources from professionals, such as Directors, VPs, SVPs, etc. This is especially useful for understanding more nuanced, internal data that isn't publicly disclosed.
- Annual reports and investor presentations of key players.
- Data Collation and Development of a Relevant Data Model
- Goal: To collate inputs from both primary and secondary sources into a structured, data-driven model for market estimation. This model will incorporate key market KPIs and any independent variables relevant to the market.
- Key KPIs: These could include:
- Market size, growth rate, and demand drivers.
- Industry-specific metrics like market share, average revenue per customer (ARPC), or average deal size.
- External variables, such as economic growth rates, inflation rates, or commodity prices, that could affect the market.
- Data Modeling: Based on this data, the market forecasts are developed for the next 5 years. A combination of trend analysis, scenario modeling, and statistical regression might be used to generate projections.
- Scenario Analysis
- Goal: To test different assumptions and validate how sensitive the market is to changes in key variables (e.g., market demand, regulatory changes, technological disruptions).
- Types of Scenarios:
- Base Case: Based on current assumptions and historical data.
- Best-Case Scenario: Assuming favorable market conditions, regulatory environments, and technological advancements.
- Worst-Case Scenario: Accounting for adverse factors, such as economic downturns, stricter regulations, or unexpected disruptions.


