UK Energy Drink Market Report: Trends, Growth and Forecast (2025-2030)
By Product Type (Alcoholic, Non-Alcoholic), By Consumption (Drinks, Shots, Mixers), By Nature (Conventional, Natural/Organic), By Flavour (Flavoured, Unflavoured), By Packaging (Bottles, Metal Cans, Pouches, Others), By Packaging Size (Small, Medium, Large), By End User (Teenagers, Adults, Geriatric), By Sales Channel (On-Trade, Off-Trade) ... Read more
|
Major Players
|
UK Energy Drink Market Statistics, 2025
- Market Size Statistics
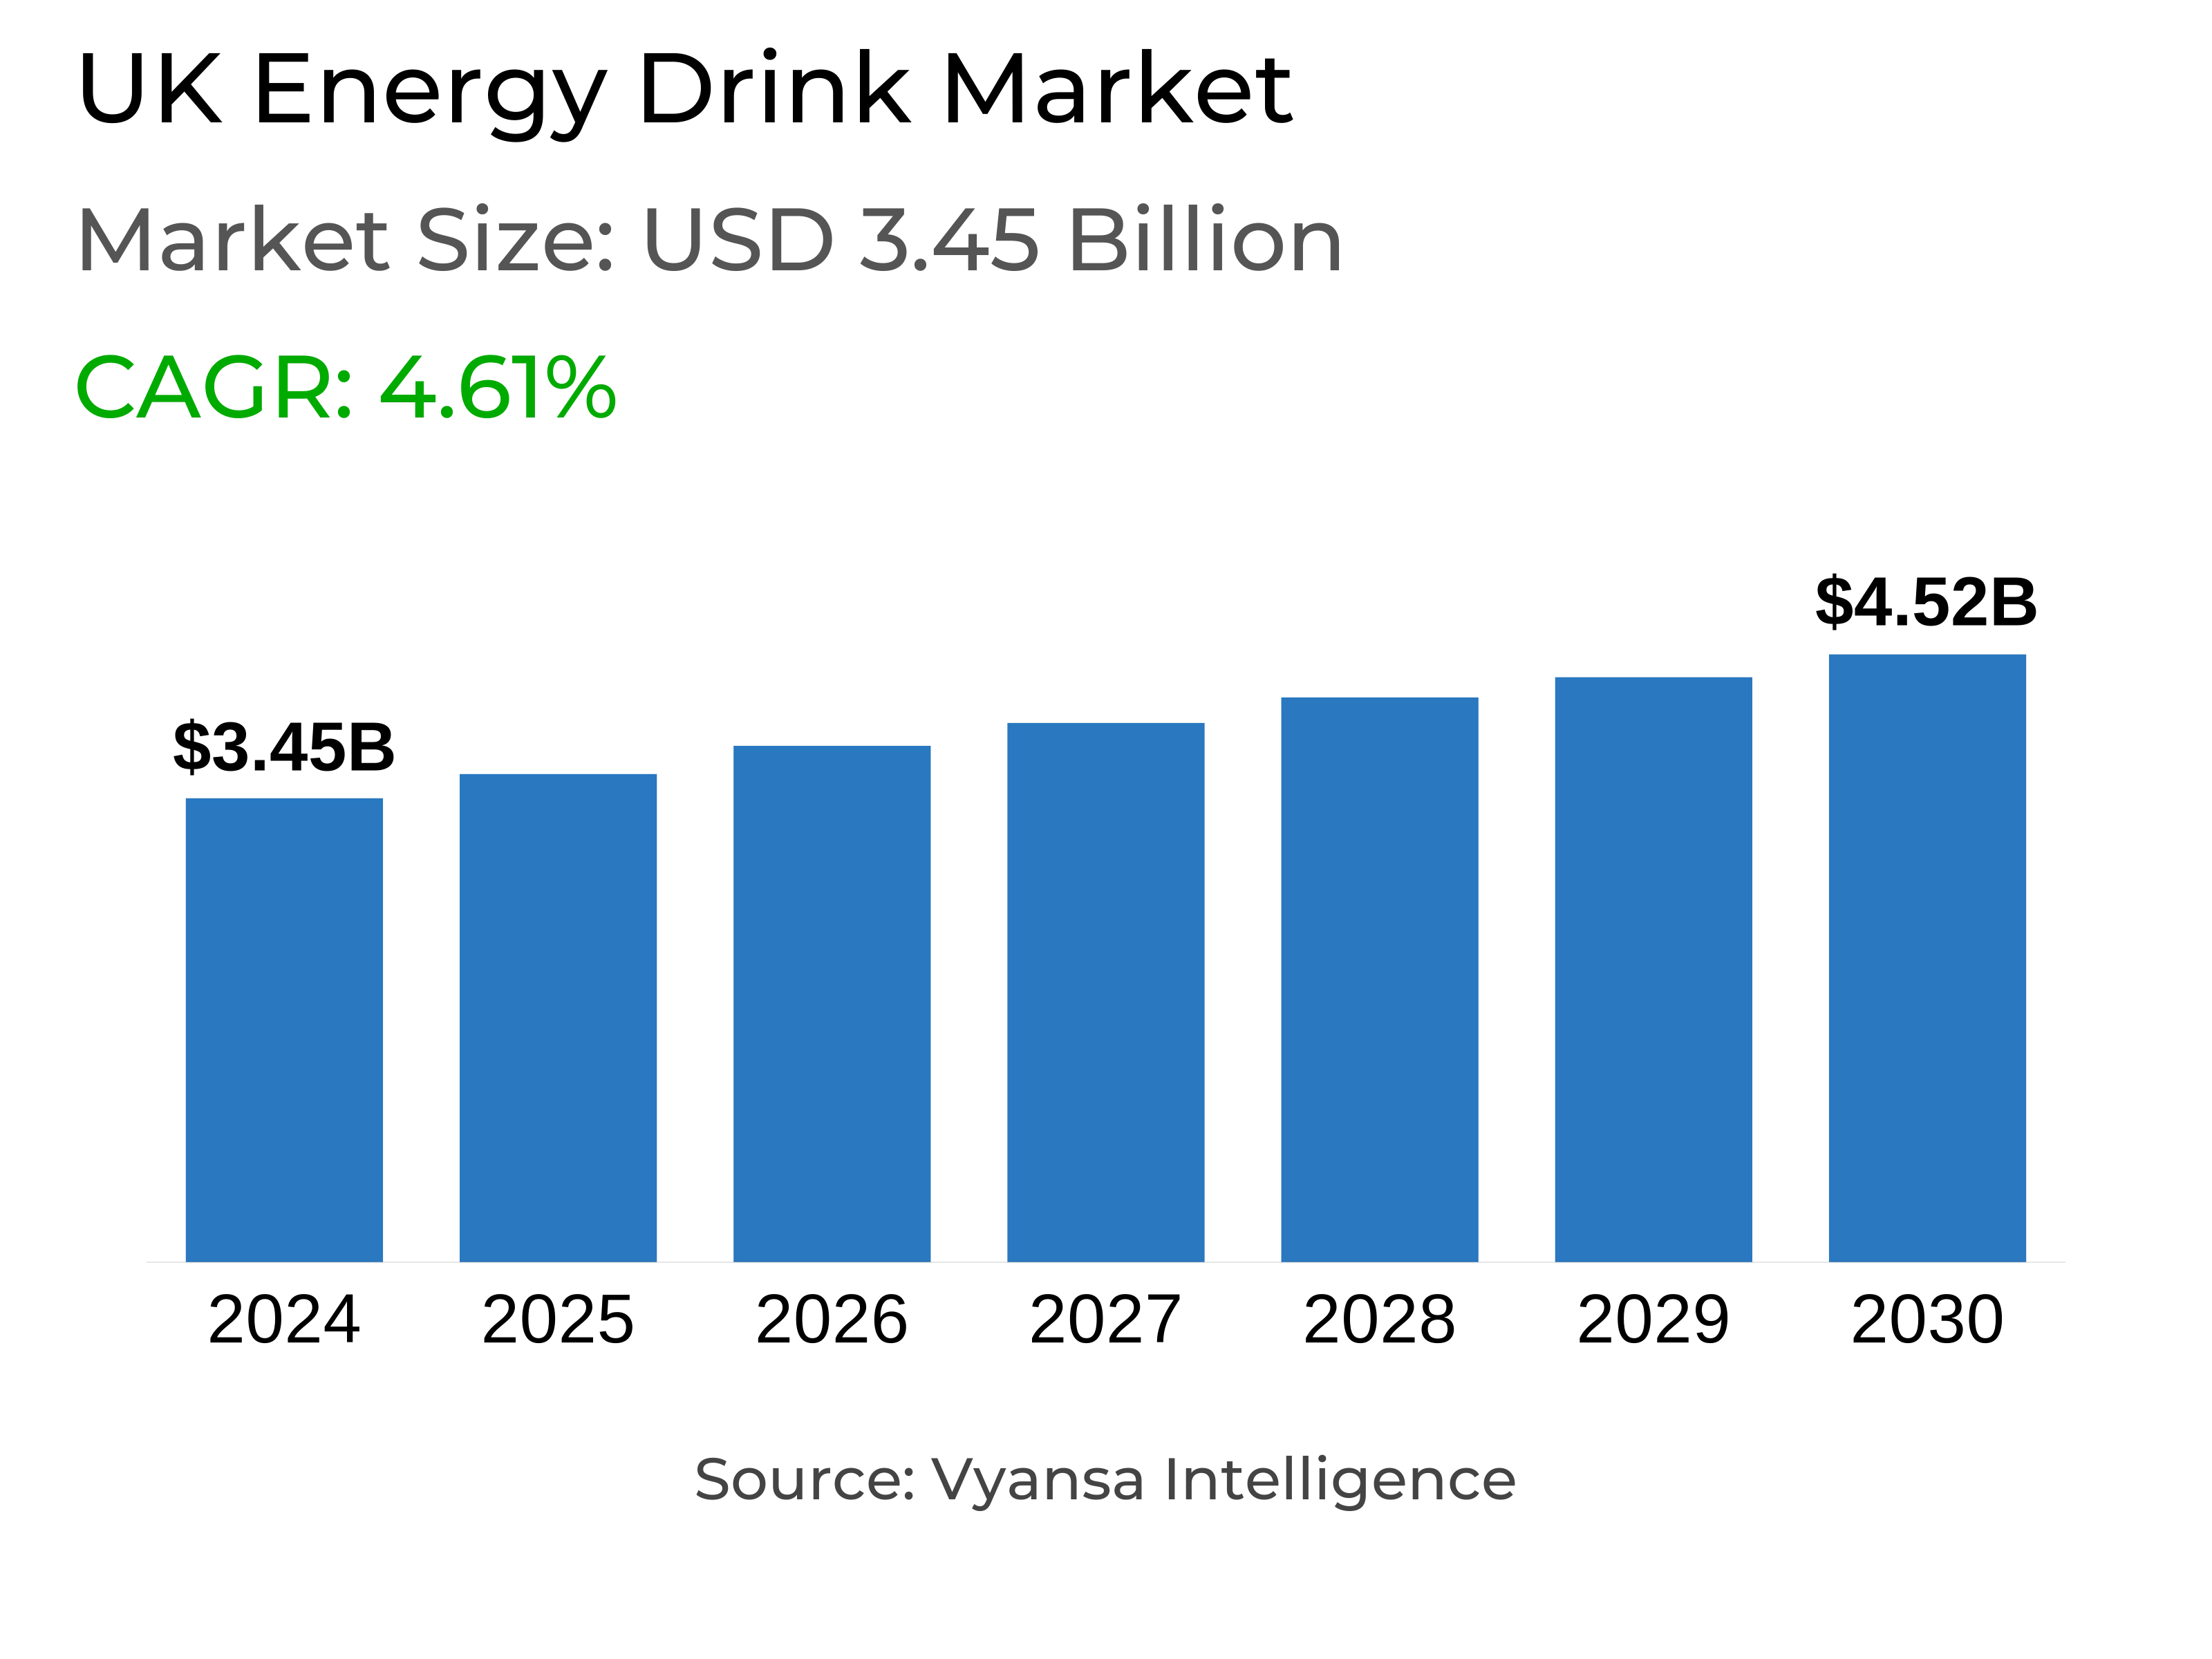
- Energy Drink in UK is estimated at $ 3.45 Billion.
- The market size is expected to grow to $ 4.52 Billion by 2030.
- Market to register a CAGR of around 4.61% during 2025-30.
- Product Shares
- Non Alcoholic Energy Drinks grabbed market share of 95%.
- Non Alcoholic Energy Drinks to witness a volume CAGR of around 3.88%.
- Competition
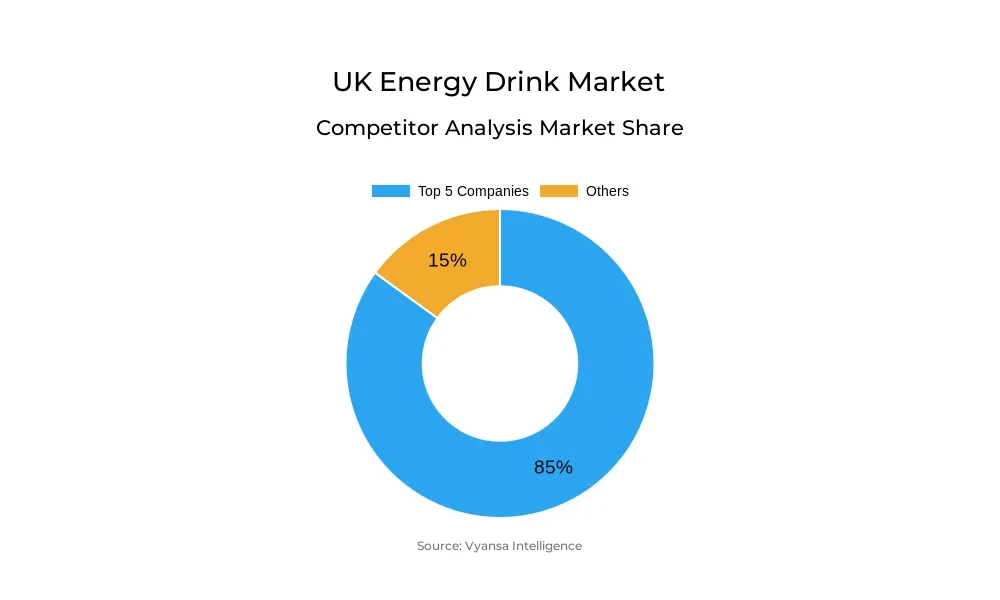
- More than 15 companies are actively engaged in producing Energy Drink in UK.
- Top 5 companies acquired 85% of the market share.
- AMS Sourcing BV, Britvic Plc, Tenzing Ltd, Red Bull Co Ltd, Coca-Cola Enterprises Ltd etc., are few of the top companies.
- Sales Channel
- Off-Trade grabbed 70% of the market.
UK Energy Drink Market Outlook
The UK energy drink market is forecasted to maintain its robust growth pattern through the years 2025 to 2030, even with prevailing economic issues like weak buying power and inflation. Consumers continue to be willing to pay for the functional aspects of energy drinks, particularly as the category has the ability to provide an instant energy boost for individuals on the go or exercising. Simultaneously, a trend towards home consumption is becoming increasingly prevalent, with bulk shopping from supermarkets and the convenience of multipacks allowing the consumer to spend less.
Innovation will be one of the major drivers of growth during the forecast period. Younger shoppers, particularly Generation Z, continue to look for new tastes, ingredients, and limited editions. Major brands such as Monster Energy and Red Bull will introduce more season and low sugar varieties to keep consumers engaged and recruit new consumers. Smaller brands are also gaining popularity through cleaner labels, natural ingredients, and sugar-free varieties, which appeal to the expanding health-oriented consumer base.
The distinctions between energy drinks and other functional drinks will continue to erode. Buyers are searching more and more for beverages that provide more than plain hydration—energy, health, and convenience. The trend will drive innovation in terms of both product format and ingredients, including emerging RTD coffee-energy combinations and functional juices.
Lastly, marketing tactics will hold the key to consumer interaction. Limited releases, influencer collaborations, and aggressive social media presence will be critical in terms of attracting consumer interest and fostering brand loyalty. Personal branding and community events, including those produced by Red Bull, are likely to continue serving as the heart of long-term accomplishment.
UK Energy Drink Market Growth Driver
Local consumers, particularly Generation Z, are in a quest for innovation in energy beverages at all times. This generation is also very drawn to new offerings, distinct tastes, and limited-edition variants. With the market experiencing an influx of new brands, innovation becomes an essential weapon for businesses to position themselves and remain competitive. Offering beverages with new ingredients, packaging, and functional aspects assists brands in reaching more consumers and responding to shifting tastes.
Sustained innovation keeps consumer interest active and underpins growth for nascent brands. Monster Energy, for instance, has achieved success through regular new releases like Juiced Bad Apple and Reserve OrangeDreamsicle in 2024. Red Bull also treaded along similar lines with sugar-free variants like Curuba & Elderflower and the Pink Edition. Even smaller brands like Boost are following suit by offering lower sugar versions, indicating how category-wide growth is being propelled by innovation.
UK Energy Drink Market Trend
Health and well-being issues are driving UK consumers towards lower-sugar and cleaner-label energy drinks. Following increasing awareness about consuming too much sugar, consumers now seek energy drinks with clean ingredients and extra vitamins. This trend is assisting in revamping the traditional perception that energy drinks are high in sugar and unhealthy. Brands that provide clean and low-sugar options are gaining popularity, particularly among those who do not want the jolt of sudden sugar or caffeine.
New and upcoming brands like PerfectTed, Tenzing, Virtue, and Reign Storm are responding to the demand by marketing cleaner energy choices. Even established players are hopping on the bandwagon. Red Bull launched a fresh sugar-free flavor—Pink Edition Sugar Free—during summer 2024, which, although restricted in availability, will expand across retail channels. More brands are likely to join in as the trend picks up.
Unlock Market Intelligence
Explore the market potential with our data-driven report
UK Energy Drink Market Opportunity
It is important to understand consumer tastes, but long-term brand success is based on successful retention. Limited-release energy drinks are becoming an effective vehicle to gain attention and build enthusiasm with distinctive, seasonal products. As the market competition increases, these introductions enable brands to establish loyalty and retain consumer interest. Red Bull introduced two limited-edition offerings in 2023, which went on to become permanent — now referred to as The Blue Edition and The Red Bull Ruby Edition — showcasing the value of thriving limited-time products in augmenting portfolios.
Personal branding and direct engagement with customers are also becoming increasingly essential for brand growth. In 2023, Prime Energy demonstrated how social media and personal branding drive buzz and sales. Red Bull continues to apply event sponsorships as a large part of its marketing, reinforcing its position of energy, innovation, and having fun while remaining in touch with its followers.
| Report Coverage | Details |
|---|---|
| Market Forecast | 2025-30 |
| USD Value 2024 | $ 3.45 Billion |
| USD Value 2030 | $ 4.52 Billion |
| CAGR 2025-2030 | 4.61% |
| Largest Category | Non Alcoholic Energy Drinks segment leads with 95% market share |
| Top Drivers | Rising Focus on Product Innovation to Attract a Diverse Consumer Base |
| Top Trends | Growing Traction Towards Clean Energy and Reduced Sugar Options |
| Top Opportunities | Brand Engagement & Limited Editions to Drive Consumer Loyalty |
| Key Players | AMS Sourcing BV, Britvic Plc, Tenzing Ltd, Red Bull Co Ltd, Coca-Cola Enterprises Ltd, Lucozade Ribena Suntory Ltd, Barr (AG) Plc, Boost Drinks Ltd, InterCarabao Ltd, Cott Beverages Ltd and Others. |
Unlock Market Intelligence
Explore the market potential with our data-driven report
UK Energy Drink Market Segmentation Analysis

The most dominant segment in terms of market share under the sales channel is Off-Trade, led primarily by offline channels like supermarkets and hypermarkets. The UK energy drink category has historically been an impulse purchase, being consumed off-the-shelf for an instant pick-me-up while on the move. But current trends indicate a movement towards in-home consumption due to inflation and higher prices. Frugal consumers are now purchasing multipacks in mass market grocery stores, where they are cheaper than in convenience stores or foodservice establishments. This is contributing to driving bulk buying and higher volumes of sales through off-line channels.
Off-Trade retail e-commerce has been on the decline within Off-Trade. Even though Monster Energy and Red Bull have 24-can packs available online, the spontaneous nature of energy drinks constrains their expansion via this segment. Buyers continue to prefer bricks-and-mortar points where they can find promotions and make impulsive purchases. Multipack formats such as Monster Energy Juiced Bad Apple and Rubicon Raw's Apple & Guava are driving supermarket take-home sales.
Top Companies in UK Energy Drink Market
The top companies operating in the market include AMS Sourcing BV, Britvic Plc, Tenzing Ltd, Red Bull Co Ltd, Coca-Cola Enterprises Ltd, Lucozade Ribena Suntory Ltd, Barr (AG) Plc, Boost Drinks Ltd, InterCarabao Ltd, Cott Beverages Ltd, etc., are the top players operating in the UK Energy Drink Market.
Frequently Asked Questions
Related Report
1. Market Segmentation
1.1. Research Scope
1.2. Research Methodology
1.3. Definitions and Assumptions
2. Executive Summary
3. UK Energy Drinks Market Policies, Regulations, and Standards
4. UK Energy Drinks Market Dynamics
4.1. Growth Factors
4.2. Challenges
4.3. Trends
4.4. Opportunities
5. UK Energy Drinks Market Statistics, 2020-2030F
5.1. Market Size & Growth Outlook
5.1.1.By Revenues in US$ Million
5.1.2.By Quantity Sold (Million Liters)
5.2. Market Segmentation & Growth Outlook
5.2.1.By Product Type
5.2.1.1. Alcoholic- Market Insights and Forecast 2020-2030, USD Million
5.2.1.2. Non-Alcoholic- Market Insights and Forecast 2020-2030, USD Million
5.2.2.By Consumption
5.2.2.1. Drinks- Market Insights and Forecast 2020-2030, USD Million
5.2.2.2. Shots- Market Insights and Forecast 2020-2030, USD Million
5.2.2.3. Mixers- Market Insights and Forecast 2020-2030, USD Million
5.2.3.By Nature
5.2.3.1. Conventional- Market Insights and Forecast 2020-2030, USD Million
5.2.3.2. Natural/Organic- Market Insights and Forecast 2020-2030, USD Million
5.2.4.By Flavour
5.2.4.1. Flavoured- Market Insights and Forecast 2020-2030, USD Million
5.2.4.2. Unflavoured- Market Insights and Forecast 2020-2030, USD Million
5.2.5.By Packaging
5.2.5.1. Bottles- Market Insights and Forecast 2020-2030, USD Million
5.2.5.1.1. PET Bottles- Market Insights and Forecast 2020-2030, USD Million
5.2.5.1.2. Glass Bottles- Market Insights and Forecast 2020-2030, USD Million
5.2.5.2. Metal Cans- Market Insights and Forecast 2020-2030, USD Million
5.2.5.3. Pouches- Market Insights and Forecast 2020-2030, USD Million
5.2.5.4. Others- Market Insights and Forecast 2020-2030, USD Million
5.2.6.By Packaging Size
5.2.6.1. Small- Market Insights and Forecast 2020-2030, USD Million
5.2.6.2. Medium- Market Insights and Forecast 2020-2030, USD Million
5.2.6.3. Large- Market Insights and Forecast 2020-2030, USD Million
5.2.7.By End User
5.2.7.1. Teenagers- Market Insights and Forecast 2020-2030, USD Million
5.2.7.2. Adults- Market Insights and Forecast 2020-2030, USD Million
5.2.7.3. Geriatric- Market Insights and Forecast 2020-2030, USD Million
5.2.8.By Sales Channel
5.2.8.1. On-Trade- Market Insights and Forecast 2020-2030, USD Million
5.2.8.2. Off-Trade- Market Insights and Forecast 2020-2030, USD Million
5.2.9.By Competitors
5.2.9.1. Competition Characteristics
5.2.9.2. Market Share & Analysis
6. UK Alcoholic Energy Drinks Market Outlook, 2020-2030F
6.1. Market Size & Growth Outlook
6.1.1.By Revenues in US$ Million
6.1.2.By Quantity Sold (Million Liters)
6.2. Market Segmentation & Growth Outlook
6.2.1.By Consumption- Market Insights and Forecast 2020-2030, USD Million
6.2.2.By Nature- Market Insights and Forecast 2020-2030, USD Million
6.2.3.By Flavour- Market Insights and Forecast 2020-2030, USD Million
6.2.4.By Packaging- Market Insights and Forecast 2020-2030, USD Million
6.2.5.By Packaging Size- Market Insights and Forecast 2020-2030, USD Million
6.2.6.By End Users- Market Insights and Forecast 2020-2030, USD Million
6.2.7.By Sales Channel- Market Insights and Forecast 2020-2030, USD Million
7. UK Non-Alcoholic Energy Drinks Market Outlook, 2020-2030F
7.1. Market Size & Growth Outlook
7.1.1.By Revenues in US$ Million
7.1.2.By Quantity Sold (Million Liters)
7.2. Market Segmentation & Growth Outlook
7.2.1.By Consumption- Market Insights and Forecast 2020-2030, USD Million
7.2.2.By Nature- Market Insights and Forecast 2020-2030, USD Million
7.2.3.By Flavour- Market Insights and Forecast 2020-2030, USD Million
7.2.4.By Packaging- Market Insights and Forecast 2020-2030, USD Million
7.2.5.By Packaging Size- Market Insights and Forecast 2020-2030, USD Million
7.2.6.By End Users- Market Insights and Forecast 2020-2030, USD Million
7.2.7.By Sales Channel- Market Insights and Forecast 2020-2030, USD Million
8. Competitive Outlook
8.1. Company Profiles
8.1.1.Red Bull Co Ltd
8.1.1.1. Business Description
8.1.1.2. Product Portfolio
8.1.1.3. Collaborations & Alliances
8.1.1.4. Recent Developments
8.1.1.5. Financial Details
8.1.1.6. Others
8.1.2.Coca-Cola Enterprises Ltd
8.1.2.1. Business Description
8.1.2.2. Product Portfolio
8.1.2.3. Collaborations & Alliances
8.1.2.4. Recent Developments
8.1.2.5. Financial Details
8.1.2.6. Others
8.1.3.Lucozade Ribena Suntory Ltd
8.1.3.1. Business Description
8.1.3.2. Product Portfolio
8.1.3.3. Collaborations & Alliances
8.1.3.4. Recent Developments
8.1.3.5. Financial Details
8.1.3.6. Others
8.1.4.Barr (AG) Plc
8.1.4.1. Business Description
8.1.4.2. Product Portfolio
8.1.4.3. Collaborations & Alliances
8.1.4.4. Recent Developments
8.1.4.5. Financial Details
8.1.4.6. Others
8.1.5.Boost Drinks Ltd
8.1.5.1. Business Description
8.1.5.2. Product Portfolio
8.1.5.3. Collaborations & Alliances
8.1.5.4. Recent Developments
8.1.5.5. Financial Details
8.1.5.6. Others
8.1.6.AMS Sourcing BV
8.1.6.1. Business Description
8.1.6.2. Product Portfolio
8.1.6.3. Collaborations & Alliances
8.1.6.4. Recent Developments
8.1.6.5. Financial Details
8.1.6.6. Others
8.1.7.Britvic Plc
8.1.7.1. Business Description
8.1.7.2. Product Portfolio
8.1.7.3. Collaborations & Alliances
8.1.7.4. Recent Developments
8.1.7.5. Financial Details
8.1.7.6. Others
8.1.8.Tenzing Ltd
8.1.8.1. Business Description
8.1.8.2. Product Portfolio
8.1.8.3. Collaborations & Alliances
8.1.8.4. Recent Developments
8.1.8.5. Financial Details
8.1.8.6. Others
8.1.9.InterCarabao Ltd
8.1.9.1. Business Description
8.1.9.2. Product Portfolio
8.1.9.3. Collaborations & Alliances
8.1.9.4. Recent Developments
8.1.9.5. Financial Details
8.1.9.6. Others
8.1.10. Cott Beverages Ltd
8.1.10.1. Business Description
8.1.10.2. Product Portfolio
8.1.10.3. Collaborations & Alliances
8.1.10.4. Recent Developments
8.1.10.5. Financial Details
8.1.10.6. Others
9. Disclaimer
| Segment | Sub-Segment |
|---|---|
| By Product Type |
|
| By Consumption |
|
| By Nature |
|
| By Flavour |
|
| By Packaging |
|
| By Packaging Size |
|
| By End User |
|
| By Sales Channel |
|
Research Methodology
This study followed a structured approach comprising four key phases to assess the size and scope of the electro-oxidation market. The process began with thorough secondary research to collect data on the target market, related markets, and broader industry context. These findings, along with preliminary assumptions and estimates, were then validated through extensive primary research involving industry experts from across the value chain. To calculate the overall market size, both top-down and bottom-up methodologies were employed. Finally, market segmentation and data triangulation techniques were applied to refine and validate segment-level estimations.
Secondary Research
The secondary research phase involved gathering data from a wide range of credible and published sources. This step helped in identifying industry trends, defining market segmentation, and understanding the market landscape and value chain.
Sources consulted during this phase included:
- Company annual reports, investor presentations, and press releases
- Industry white papers and certified publications
- Trade directories and market-recognized databases
- Articles from authoritative authors and reputable journals
- Gold and silver standard websites
Secondary research was critical in mapping out the industry's value chain and monetary flow, identifying key market segments, understanding regional variations, and tracking significant industry developments.
Other key sources:
- Financial disclosures
- Industry associations and trade bodies
- News outlets and business magazines
- Academic journals and research studies
- Paid industry databases
Primary Research
To validate secondary data and gain deeper market insights, primary research was conducted with key stakeholders across both the supply and demand sides of the market.
On the demand side, participants included decision-makers and influencers from end-user industries—such as CIOs, CTOs, and CSOs—who provided first-hand perspectives on market needs, product usage, and future expectations.
On the supply side, interviews were conducted with manufacturers, industry associations, and institutional participants to gather insights into current offerings, product pipelines, and market challenges.
Primary interviews provided critical inputs such as:
- Market size and revenue data
- Product and service breakdowns
- Market forecasts
- Regional and application-specific trends
Stakeholders consulted included:
- Leading OEM and solution providers
- Channel and distribution partners
- End users across various applications
- Independent consultants and industry specialists
Market Size Estimation and Data Triangulation
- Identifying Key Market Participants (Secondary Research)
- Goal: To identify the major players or companies in the target market. This typically involves using publicly available data sources such as industry reports, market research publications, and financial statements of companies.
- Tools: Reports from firms like Gartner, Forrester, Euromonitor, Statista, IBISWorld, and others. Public financial statements, news articles, and press releases from top market players.
- Extracting Earnings of Key Market Participants
- Goal: To estimate the earnings generated from the product or service being analyzed. This step helps in understanding the revenue potential of each market player in a specific geography.
- Methods: Earnings data can be gathered from:
- Publicly available financial reports (for listed companies).
- Interviews and primary data sources from professionals, such as Directors, VPs, SVPs, etc. This is especially useful for understanding more nuanced, internal data that isn't publicly disclosed.
- Annual reports and investor presentations of key players.
- Data Collation and Development of a Relevant Data Model
- Goal: To collate inputs from both primary and secondary sources into a structured, data-driven model for market estimation. This model will incorporate key market KPIs and any independent variables relevant to the market.
- Key KPIs: These could include:
- Market size, growth rate, and demand drivers.
- Industry-specific metrics like market share, average revenue per customer (ARPC), or average deal size.
- External variables, such as economic growth rates, inflation rates, or commodity prices, that could affect the market.
- Data Modeling: Based on this data, the market forecasts are developed for the next 5 years. A combination of trend analysis, scenario modeling, and statistical regression might be used to generate projections.
- Scenario Analysis
- Goal: To test different assumptions and validate how sensitive the market is to changes in key variables (e.g., market demand, regulatory changes, technological disruptions).
- Types of Scenarios:
- Base Case: Based on current assumptions and historical data.
- Best-Case Scenario: Assuming favorable market conditions, regulatory environments, and technological advancements.
- Worst-Case Scenario: Accounting for adverse factors, such as economic downturns, stricter regulations, or unexpected disruptions.


