Thailand Cards and Payments Market Report: Trends, Growth and Forecast (2026-2032)
By Instrument Type (Cards (Debit Card, Charge Card, ATM Card, Pre-Paid Card, Credit Card, Store Card), Mobile Wallets, Cheques, Others), By Card Type (Contact Smart Card, Contactless Smart Card, Non-Smart Card), By Type of Payments (B2B, B2C, C2C, C2B (E-commerce Shopping, Payment at POS Terminals)), By Transaction Type (Domestic, Foreign), By Application (Food & Groceries, Health & Pharmacies, Travel & Tourism, Hospitality, Others (Media & Entertainment)) ... Read more
|
Major Players
|
Thailand Cards and Payments Market Statistics and Insights, 2026
- Market Size Statistics
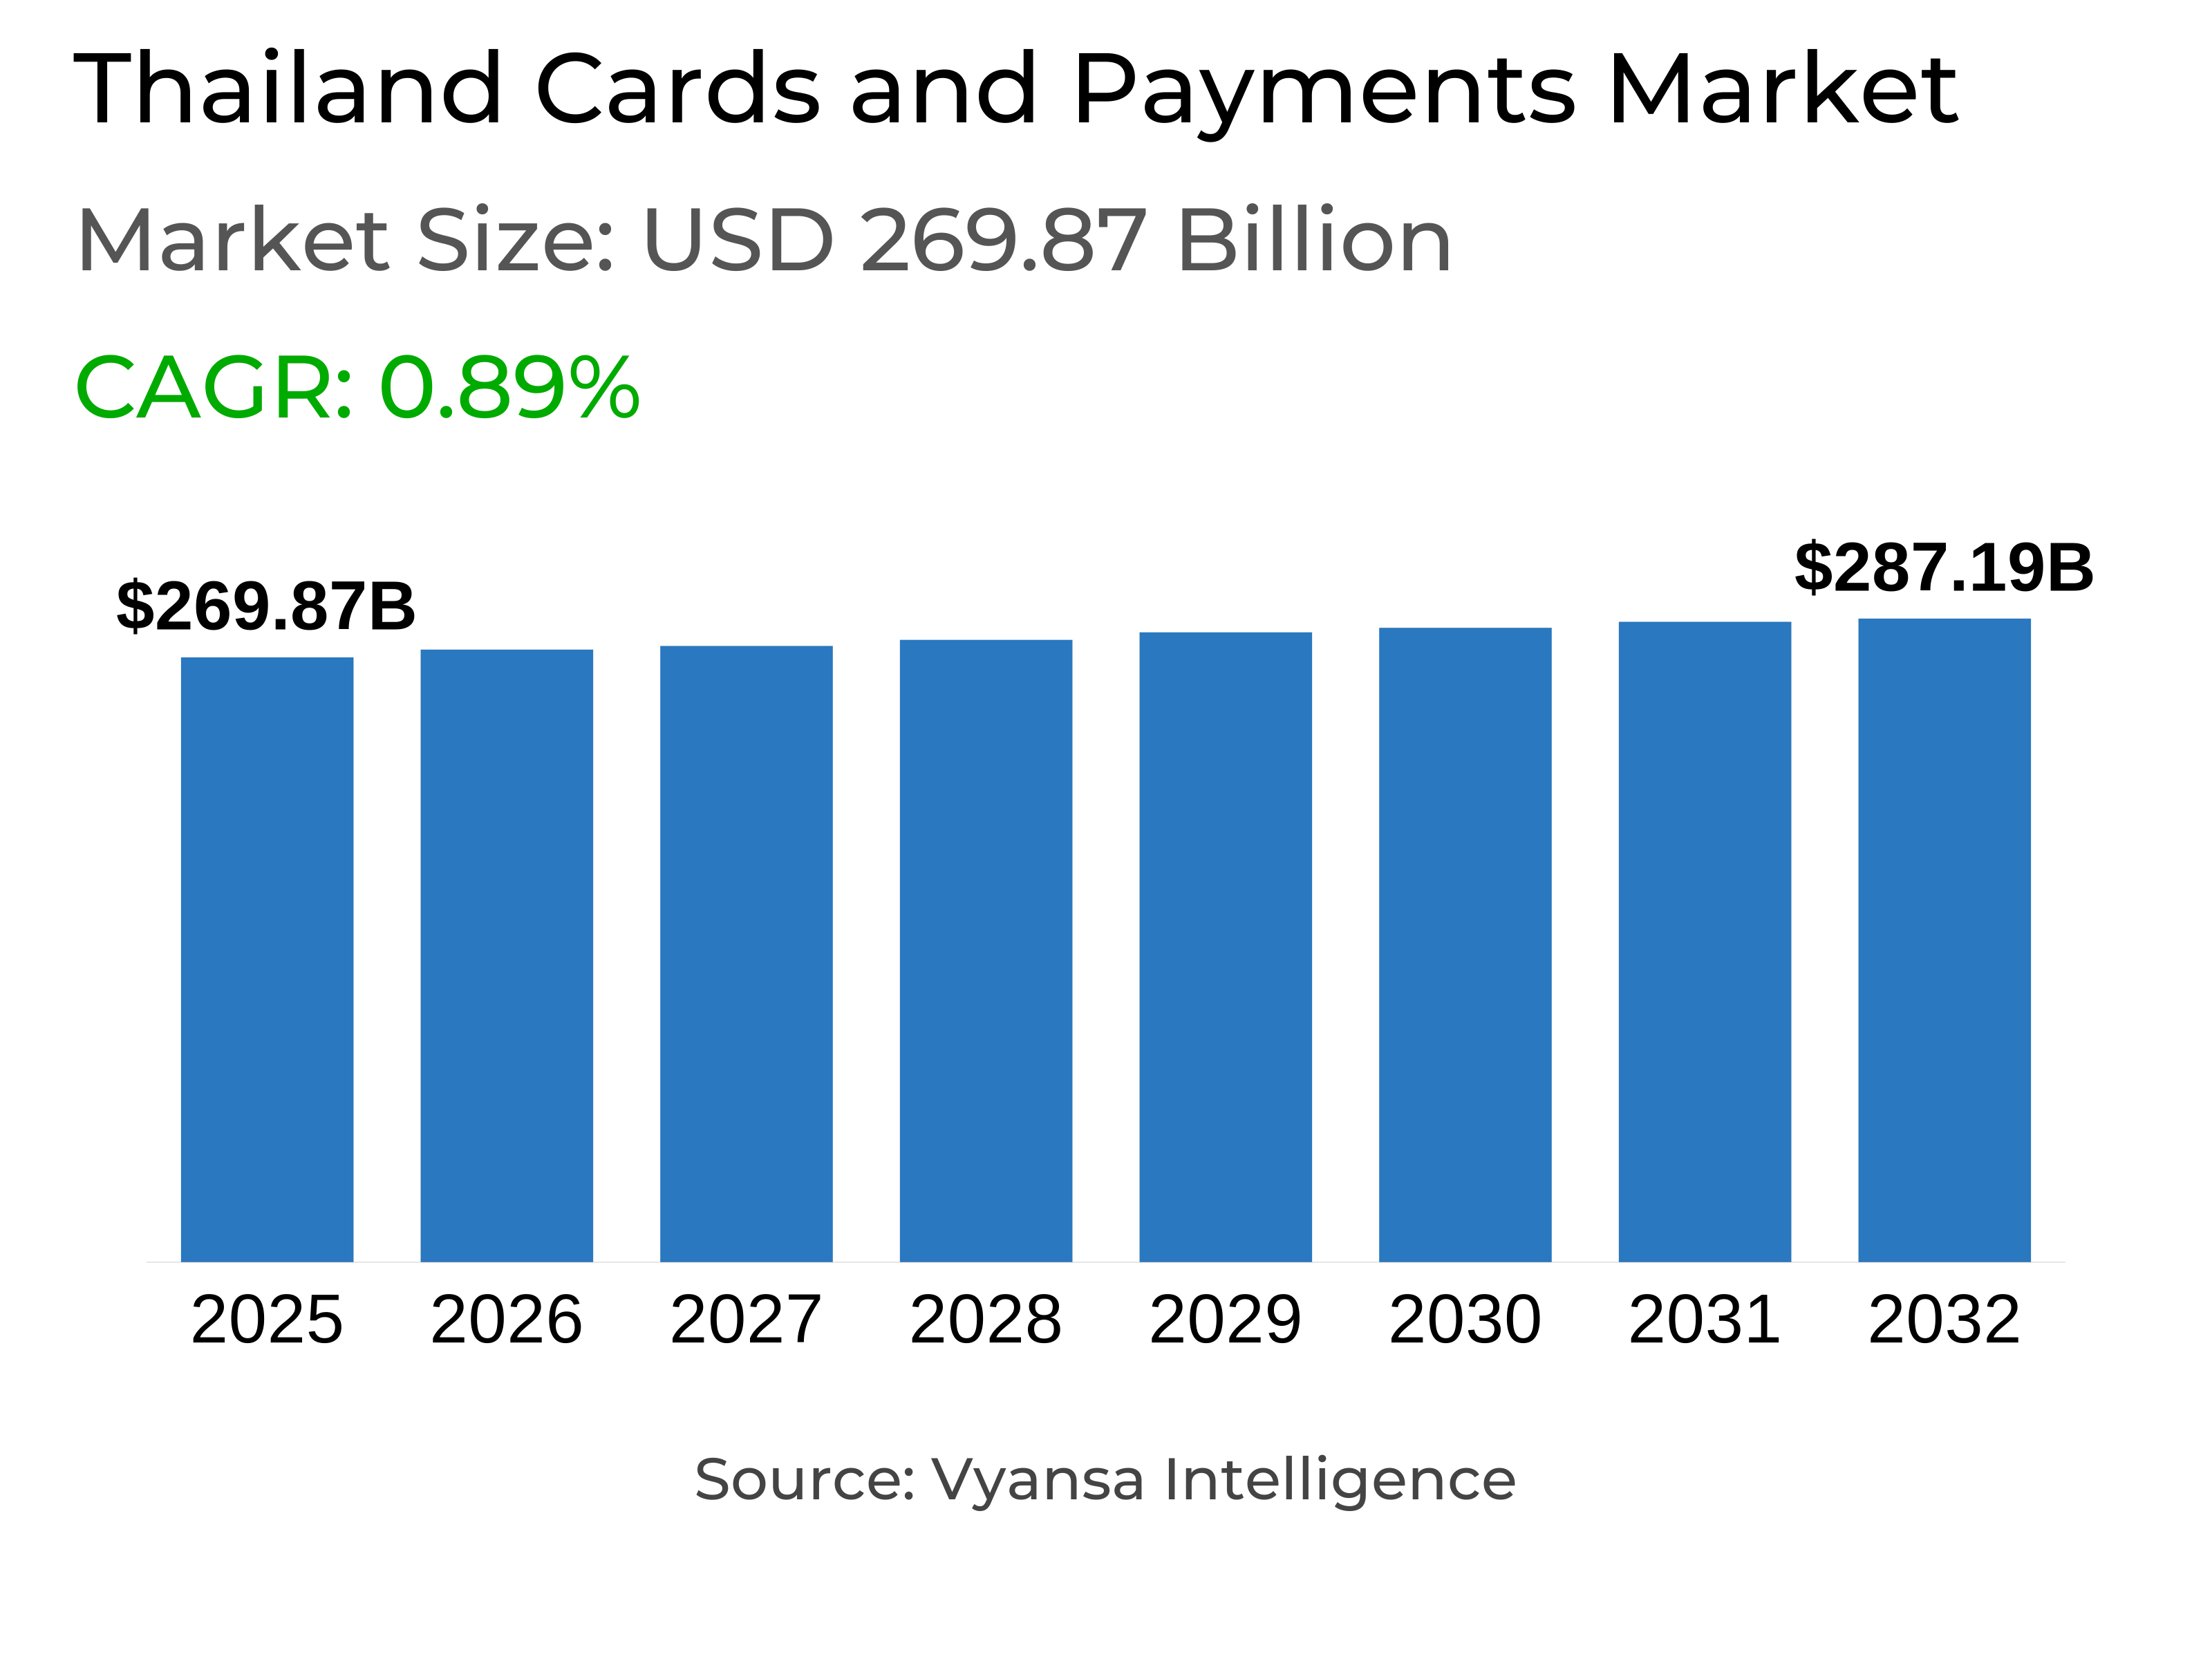
- Cards and Payments in Thailand is estimated at $ 269.87 Billion.
- The market size is expected to grow to $ 287.19 Billion by 2032.
- Market to register a CAGR of around 0.89% during 2026-32.
- Instrument Type Shares
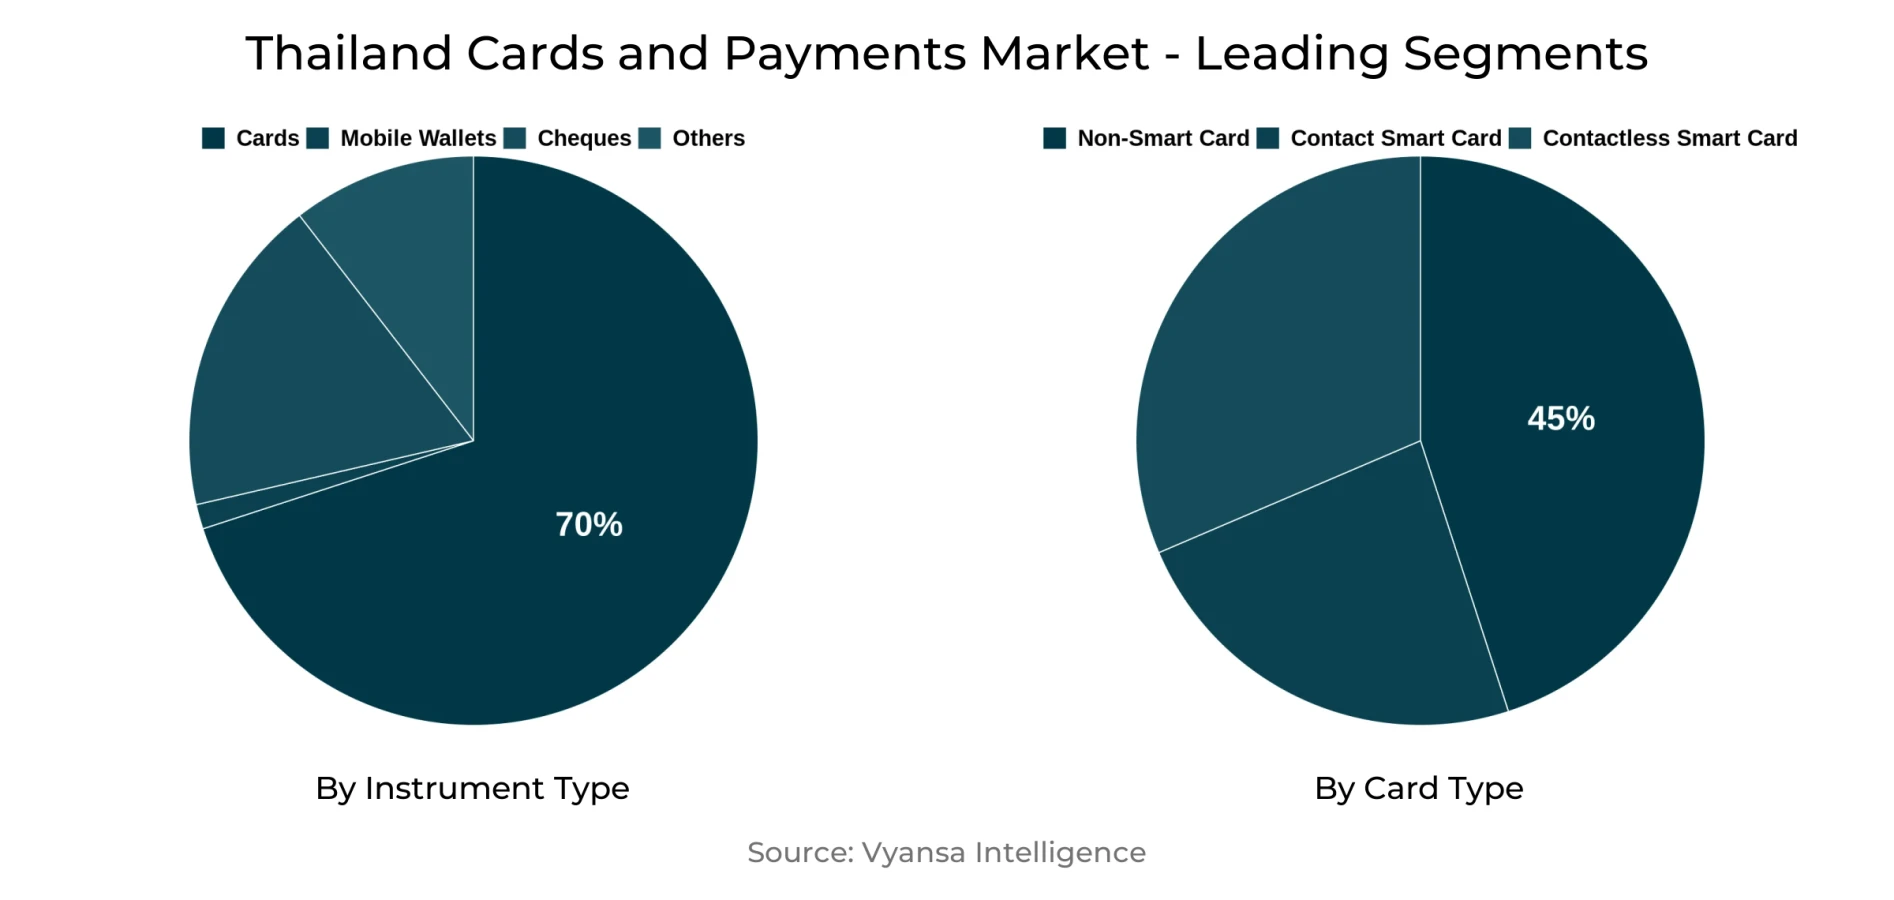
- Cards grabbed market share of 70%.
- Cards to witness a volume CAGR of around 1.1%.
- Competition
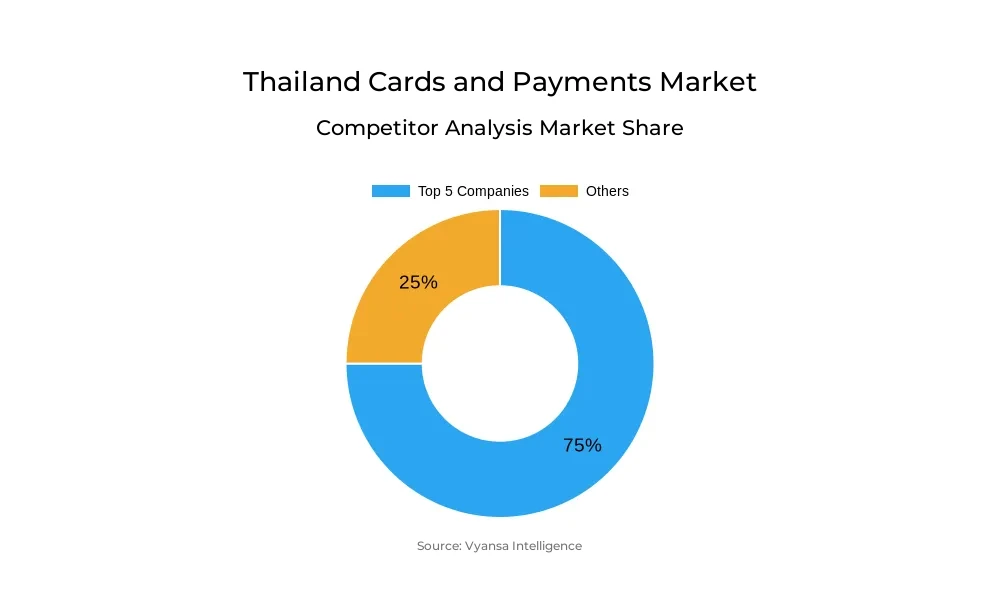
- More than 20 companies are actively engaged in producing Cards and Payments in Thailand.
- Top 5 companies acquired 75% of the market share.
- United Overseas Bank Ltd, Aeon Thana Sinsap (Thailand) PCL, TMBThanachart Bank PCL, Kasikorn Bank PCL, Bank of Ayudhya PCL etc., are few of the top companies.
- Card Type
- Non-Smart Card grabbed 45% of the market.
Thailand Cards and Payments Market Outlook
The Thailand cards and payments market is poised for smooth growth, with a projected size of $269.87 Billion in 2025, likely to touch $287.19 Billion by 2032. The market is being led by a sustained move towards digitalisation, with electronic direct/ACH transactions, mobile wallets, PromptPay, and QR code payments becoming increasingly popular. These channels are convenient, secure, and fast, backing the government drive for a cashless economy and increasing financial inclusion in the country.
Card payments will continue to be significant, with non-smart cards commanding about 45% of market share. Cards are set to expand at a moderate volume CAGR of 1.1%, following the continued dependence on established card services in conjunction with online alternatives. Credit cards remain the leading denomination for transactions, especially high-value transactions, and prepaid and virtual cards are likely to experience steady uptake, most notably among younger, technically competent end users.
Young end users, particularly millennials and Gen Z, will be at the forefront of payment trends. Their preference for frictionless, mobile-led payments, and Buy Now Pay Later (BNPL) offerings is driving innovation in both banks and fintechs. Major banks are investing in BNPL platforms and digital wallets, while virtual bank licences are being granted to enhance competition and accessibility for retail end users and SMEs.
Virtual banks, which will conduct business fully online without any physical branches, will reshape the market by offering lower-cost, efficient financial products. Collaborations between legacy banks and technology players are likely to drive digital adoption, cut costs, and improve product quality. Overall, Thailand cards and payments market is expected to grow progressively, and financial inclusion and digitalisation will remain the major drivers.
Thailand Cards and Payments Market Growth Driver
Fast Adoption of Digital Payments Driven by Government Initiatives
Digital payments are gaining ground as the payment method of choice in Thailand, fueled by the convenience, safety, and robust digital ecosystem they bring. Daily transactions are carried out using mobile wallet platforms, banking apps, PromptPay, and QR codes, facilitating quick payment and peer-to-peer transfer with ease. The Thailand government actively fosters this going cashless through promoting both demand and supply of digital payment facilities. Activities involve promoting the utilization of PromptPay and QR codes for individual transactions, rolling out PromptBiz for business usage, and incorporating digital payments into e-commerce platforms and public projects.
Private firms and commercial banks also have an important role in pushing digital adoption. Banks increase mobile applications and provide free-of-charge digital transactions, and fintech firms enhance mobile wallets and add digital payment services to their services. Combined, these efforts increase electronic payments availability, driving end users to abandon cash and adopt digital alternatives.
Thailand Cards and Payments Market Trend
Increasing Acceptance of Buy Now Pay Later (BNPL) Services
Buy Now Pay Later (BNPL) products are becoming the choice of end users in Thailand, particularly on online shopping platforms. Compared to credit cards, which tend to have more stringent approval mechanisms and higher charges, BNPL is about instant approval and forgiving lending standards and thus can be offered to more end users. This payment option enables end users to break up purchases into minor, tractable instalments, making credit accessible to people who may not be eligible for conventional loans. The flexibility and convenience of BNPL are fueling its widespread take-up by online end users and digitally conscious end users.
Banks and financial institutions are themselves investing or forming partnerships with BNPL platforms to address increasing demand. Partnerships like SCB10X with Traveloka, KpayLater with PTT, and Pay Next from True Money Wallet illustrate the growing emphasis on BNPL as a payment solution. The trend indicates a change in end user behavior towards different financing opportunities and flexible digital payments.
Unlock Market Intelligence
Explore the market potential with our data-driven report
Thailand Cards and Payments Market Opportunity
Growth of Virtual Banks and Digital-First Financial Services
The launch of virtual banks in Thailand has a major potential in the financial cards and payments market. Without physical branches, ATMs, or CDMs, virtual banks conduct business completely through digital channels. They deliver faster, more streamlined, and cheaper financial services. Virtual banks provide a wide array of services such as deposits, withdrawals, transfers, payments, loans, and investments, targeting primarily underserved retail end users and SMEs. This digital-first strategy enables flexible product development and customized solutions that address changing end user requirements.
A number of large partnerships, including KrungThailand Bank with AIS, Bangkok Bank with Sea Group, and SCBX with KakaoBank, are planning to initiate virtual banking operations. The Bank of Thailand will issue licenses to three operators, allowing these banks to drive competition, reduce costs, and improve financial services access. This change presents a chance to access new customer segments and hasten the move towards a complete cashless economy.
Unlock Market Intelligence
Explore the market potential with our data-driven report
Thailand Cards and Payments Market Segmentation Analysis
By Instrument Type
- Cards
- Mobile Wallets
- Cheques
- Others
The most dominant segmentation in terms of market share under the Instrument Type is Cards, and Cards account for 70% of the market in Thailand. Card payment transactions continued to demonstrate steady growth in 2024, driven by growing use of electronic payments and end user dependence on financial cards for everyday expenses. Credit cards dominated in transaction value, with ATM cards still being popular due to convenience and familiarity. Younger age groups, with increasing disposable incomes and technology-enabled behavior, also aided in card-based payment acceptance.
In the future, Cards are poised to experience a volume CAGR of 1.1% from 2026–32. As digital payments, mobile wallets, and QR-based transactions keep increasing, ATM cards will still be relevant because of their broad acceptance and critical position in the payment environment. The interaction between government measures, ease, and end user behavior will support consistent growth in the cards segment.
By Card Type
- Contact Smart Card
- Contactless Smart Card
- Non-Smart Card
The segmentation with the highest market share under Card Type is Non-Smart Cards, having controlled 45% of the market in 2024. Non-smart cards are popular because they are easy, have broad use, and are in line with present ATM networks. End users keep using them to withdraw cash and make typical card-based transactions, especially in regions where technology adoption continues to pick up pace.
In the future, Non-Smart Cards will continue to maintain a strong market share as acceptance of digital payments grows incrementally. As mobile wallets, PromptPay, and virtual banking services spearhead cashless payment growth, Non-Smart Cards will continue to be an important tool, ably assisted by their extensive acceptance and utility for everyday banking. Their continued usage means that traditional card payments will continue to comprise a large segment of the total market.
Top Companies in Thailand Cards and Payments Market
The top companies operating in the market include United Overseas Bank Ltd, Aeon Thana Sinsap (Thailand) PCL, TMBThanachart Bank PCL, Kasikorn Bank PCL, Bank of Ayudhya PCL, Krungthai Card Public Co Ltd, Siam Commercial Bank PCL, The, Bangkok Bank PCL, Krung Thai Bank PCL, Shell (Thailand) Co Ltd, etc., are the top players operating in the Thailand Cards and Payments Market.
Frequently Asked Questions
Related Report
1. Market Segmentation
1.1. Research Scope
1.2. Research Methodology
1.3. Definitions and Assumptions
2. Executive Summary
3. Thailand Cards and Payments Market Policies, Regulations, and Standards
4. Thailand Cards and Payments Market Dynamics
4.1. Growth Factors
4.2. Challenges
4.3. Trends
4.4. Opportunities
5. Thailand Cards and Payments Market Statistics, 2022-2032F
5.1. Market Size & Growth Outlook
5.1.1. By Revenues in US$ Million
5.2. Market Segmentation & Growth Outlook
5.2.1. By Instrument Type
5.2.1.1. Cards- Market Insights and Forecast 2022-2032, USD Million
5.2.1.1.1. Debit Card- Market Insights and Forecast 2022-2032, USD Million
5.2.1.1.2. Charge Card- Market Insights and Forecast 2022-2032, USD Million
5.2.1.1.3. ATM Card- Market Insights and Forecast 2022-2032, USD Million
5.2.1.1.4. Pre-Paid Card- Market Insights and Forecast 2022-2032, USD Million
5.2.1.1.5. Credit Card- Market Insights and Forecast 2022-2032, USD Million
5.2.1.1.6. Store Card- Market Insights and Forecast 2022-2032, USD Million
5.2.1.2. Mobile Wallets- Market Insights and Forecast 2022-2032, USD Million
5.2.1.3. Cheques- Market Insights and Forecast 2022-2032, USD Million
5.2.1.4. Others- Market Insights and Forecast 2022-2032, USD Million
5.2.2. By Card Type
5.2.2.1. Contact Smart Card- Market Insights and Forecast 2022-2032, USD Million
5.2.2.2. Contactless Smart Card- Market Insights and Forecast 2022-2032, USD Million
5.2.2.3. Non-Smart Card- Market Insights and Forecast 2022-2032, USD Million
5.2.3. By Type of Payments
5.2.3.1. B2B- Market Insights and Forecast 2022-2032, USD Million
5.2.3.2. B2C- Market Insights and Forecast 2022-2032, USD Million
5.2.3.3. C2C- Market Insights and Forecast 2022-2032, USD Million
5.2.3.4. C2B- Market Insights and Forecast 2022-2032, USD Million
5.2.3.4.1. E-commerce Shopping- Market Insights and Forecast 2022-2032, USD Million
5.2.3.4.2. Payment at POS Terminals- Market Insights and Forecast 2022-2032, USD Million
5.2.4. By Transaction Type
5.2.4.1. Domestic- Market Insights and Forecast 2022-2032, USD Million
5.2.4.2. Foreign- Market Insights and Forecast 2022-2032, USD Million
5.2.5. By Application
5.2.5.1. Food & Groceries- Market Insights and Forecast 2022-2032, USD Million
5.2.5.2. Health & Pharmacies- Market Insights and Forecast 2022-2032, USD Million
5.2.5.3. Travel & Tourism- Market Insights and Forecast 2022-2032, USD Million
5.2.5.4. Hospitality- Market Insights and Forecast 2022-2032, USD Million
5.2.5.5. Others (Media & Entertainment)- Market Insights and Forecast 2022-2032, USD Million
5.2.6. By Competitors
5.2.6.1. Competition Characteristics
5.2.6.2. Market Share & Analysis
6. Thailand Cards Market Statistics, 2022-2032F
6.1. Market Size & Growth Outlook
6.1.1. By Revenues in US$ Million
6.2. Market Segmentation & Growth Outlook
6.2.1. By Card Type- Market Insights and Forecast 2022-2032, USD Million
6.2.2. By Type of Payments- Market Insights and Forecast 2022-2032, USD Million
6.2.3. By Transaction Type- Market Insights and Forecast 2022-2032, USD Million
6.2.4. By Application- Market Insights and Forecast 2022-2032, USD Million
7. Thailand Mobile Wallets Market Statistics, 2022-2032F
7.1. Market Size & Growth Outlook
7.1.1. By Revenues in US$ Million
7.2. Market Segmentation & Growth Outlook
7.2.1. By Type of Payments- Market Insights and Forecast 2022-2032, USD Million
7.2.2. By Transaction Type- Market Insights and Forecast 2022-2032, USD Million
7.2.3. By Application- Market Insights and Forecast 2022-2032, USD Million
8. Thailand Cheques Market Statistics, 2022-2032F
8.1. Market Size & Growth Outlook
8.1.1. By Revenues in US$ Million
8.2. Market Segmentation & Growth Outlook
8.2.1. By Type of Payments- Market Insights and Forecast 2022-2032, USD Million
8.2.2. By Transaction Type- Market Insights and Forecast 2022-2032, USD Million
8.2.3. By Application- Market Insights and Forecast 2022-2032, USD Million
9. Competitive Outlook
9.1. Company Profiles
9.1.1. Kasikorn Bank PCL
9.1.1.1. Business Description
9.1.1.2. Product Portfolio
9.1.1.3. Collaborations & Alliances
9.1.1.4. Recent Developments
9.1.1.5. Financial Details
9.1.1.6. Others
9.1.2. Bank of Ayudhya PCL
9.1.2.1. Business Description
9.1.2.2. Product Portfolio
9.1.2.3. Collaborations & Alliances
9.1.2.4. Recent Developments
9.1.2.5. Financial Details
9.1.2.6. Others
9.1.3. Krungthai Card Public Co Ltd
9.1.3.1. Business Description
9.1.3.2. Product Portfolio
9.1.3.3. Collaborations & Alliances
9.1.3.4. Recent Developments
9.1.3.5. Financial Details
9.1.3.6. Others
9.1.4. Siam Commercial Bank PCL
9.1.4.1. Business Description
9.1.4.2. Product Portfolio
9.1.4.3. Collaborations & Alliances
9.1.4.4. Recent Developments
9.1.4.5. Financial Details
9.1.4.6. Others
9.1.5. The Bangkok Bank PCL
9.1.5.1. Business Description
9.1.5.2. Product Portfolio
9.1.5.3. Collaborations & Alliances
9.1.5.4. Recent Developments
9.1.5.5. Financial Details
9.1.5.6. Others
9.1.6. United Overseas Bank Ltd
9.1.6.1. Business Description
9.1.6.2. Product Portfolio
9.1.6.3. Collaborations & Alliances
9.1.6.4. Recent Developments
9.1.6.5. Financial Details
9.1.6.6. Others
9.1.7. Aeon Thana Sinsap (Thailand) PCL
9.1.7.1. Business Description
9.1.7.2. Product Portfolio
9.1.7.3. Collaborations & Alliances
9.1.7.4. Recent Developments
9.1.7.5. Financial Details
9.1.7.6. Others
9.1.8. TMBThanachart Bank PCL
9.1.8.1. Business Description
9.1.8.2. Product Portfolio
9.1.8.3. Collaborations & Alliances
9.1.8.4. Recent Developments
9.1.8.5. Financial Details
9.1.8.6. Others
9.1.9. Krung Thai Bank PCL
9.1.9.1. Business Description
9.1.9.2. Product Portfolio
9.1.9.3. Collaborations & Alliances
9.1.9.4. Recent Developments
9.1.9.5. Financial Details
9.1.9.6. Others
9.1.10. Shell (Thailand) Co Ltd
9.1.10.1. Business Description
9.1.10.2. Product Portfolio
9.1.10.3. Collaborations & Alliances
9.1.10.4. Recent Developments
9.1.10.5. Financial Details
9.1.10.6. Others
10. Disclaimer
| Segment | Sub-Segment |
|---|---|
| By Instrument Type |
|
| By Card Type |
|
| By Type of Payments |
|
| By Transaction Type |
|
| By Application |
|
Research Methodology
This study followed a structured approach comprising four key phases to assess the size and scope of the electro-oxidation market. The process began with thorough secondary research to collect data on the target market, related markets, and broader industry context. These findings, along with preliminary assumptions and estimates, were then validated through extensive primary research involving industry experts from across the value chain. To calculate the overall market size, both top-down and bottom-up methodologies were employed. Finally, market segmentation and data triangulation techniques were applied to refine and validate segment-level estimations.
Secondary Research
The secondary research phase involved gathering data from a wide range of credible and published sources. This step helped in identifying industry trends, defining market segmentation, and understanding the market landscape and value chain.
Sources consulted during this phase included:
- Company annual reports, investor presentations, and press releases
- Industry white papers and certified publications
- Trade directories and market-recognized databases
- Articles from authoritative authors and reputable journals
- Gold and silver standard websites
Secondary research was critical in mapping out the industry's value chain and monetary flow, identifying key market segments, understanding regional variations, and tracking significant industry developments.
Other key sources:
- Financial disclosures
- Industry associations and trade bodies
- News outlets and business magazines
- Academic journals and research studies
- Paid industry databases
Primary Research
To validate secondary data and gain deeper market insights, primary research was conducted with key stakeholders across both the supply and demand sides of the market.
On the demand side, participants included decision-makers and influencers from end-user industries—such as CIOs, CTOs, and CSOs—who provided first-hand perspectives on market needs, product usage, and future expectations.
On the supply side, interviews were conducted with manufacturers, industry associations, and institutional participants to gather insights into current offerings, product pipelines, and market challenges.
Primary interviews provided critical inputs such as:
- Market size and revenue data
- Product and service breakdowns
- Market forecasts
- Regional and application-specific trends
Stakeholders consulted included:
- Leading OEM and solution providers
- Channel and distribution partners
- End users across various applications
- Independent consultants and industry specialists
Market Size Estimation and Data Triangulation
- Identifying Key Market Participants (Secondary Research)
- Goal: To identify the major players or companies in the target market. This typically involves using publicly available data sources such as industry reports, market research publications, and financial statements of companies.
- Tools: Reports from firms like Gartner, Forrester, Euromonitor, Statista, IBISWorld, and others. Public financial statements, news articles, and press releases from top market players.
- Extracting Earnings of Key Market Participants
- Goal: To estimate the earnings generated from the product or service being analyzed. This step helps in understanding the revenue potential of each market player in a specific geography.
- Methods: Earnings data can be gathered from:
- Publicly available financial reports (for listed companies).
- Interviews and primary data sources from professionals, such as Directors, VPs, SVPs, etc. This is especially useful for understanding more nuanced, internal data that isn't publicly disclosed.
- Annual reports and investor presentations of key players.
- Data Collation and Development of a Relevant Data Model
- Goal: To collate inputs from both primary and secondary sources into a structured, data-driven model for market estimation. This model will incorporate key market KPIs and any independent variables relevant to the market.
- Key KPIs: These could include:
- Market size, growth rate, and demand drivers.
- Industry-specific metrics like market share, average revenue per customer (ARPC), or average deal size.
- External variables, such as economic growth rates, inflation rates, or commodity prices, that could affect the market.
- Data Modeling: Based on this data, the market forecasts are developed for the next 5 years. A combination of trend analysis, scenario modeling, and statistical regression might be used to generate projections.
- Scenario Analysis
- Goal: To test different assumptions and validate how sensitive the market is to changes in key variables (e.g., market demand, regulatory changes, technological disruptions).
- Types of Scenarios:
- Base Case: Based on current assumptions and historical data.
- Best-Case Scenario: Assuming favorable market conditions, regulatory environments, and technological advancements.
- Worst-Case Scenario: Accounting for adverse factors, such as economic downturns, stricter regulations, or unexpected disruptions.


