Sweden Alcoholic Drinks Market Report: Trends, Growth and Forecast (2026-2032)
By Type (Beer, Cider/Perry, RTDs, Spirits, c), By Alcohol Content (High, Medium, Low), By Flavor (Unflavored, Flavored), By Packaging Type (Glass Bottles, Tins, Plastic Bottles, Others), By Sales Channel (On-Trade, Off-Trade (Retail Offline, Retail Online)) ... Read more

|
Major Players
|
Sweden Alcoholic Drinks Market Statistics and Insights, 2026
- Market Size Statistics
- Alcoholic Drinks in Sweden is estimated at $ 10.75 Billion.
- The market size is expected to grow to $ 11.27 Billion by 2032.
- Market to register a CAGR of around 0.68% during 2026-32.
- Type Shares
- Wine grabbed market share of 40%.
- Wine to witness a volume CAGR of around 0.28%.
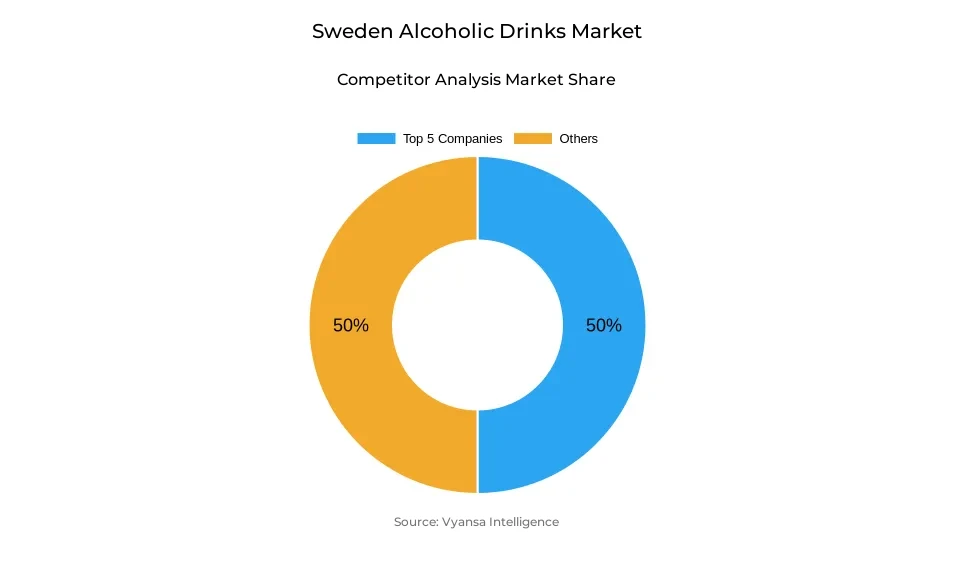
- Competition
- More than 10 companies are actively engaged in producing Alcoholic Drinks in Sweden.
- Top 5 companies acquired 50% of the market share.
- Heineken NV, Anora Group Oyj, Galatea Spirits AB, Spendrups Bryggeri AB, Carlsberg A/S etc., are few of the top companies.
- Sales Channel
- Off-Trade grabbed 55% of the market.
Sweden Alcoholic Drinks Market Outlook
Sweden alcoholic drinks market size is approximated to be $10.75 Billion in 2025 and is anticipated to grow to $11.27 Billion by 2032. Total volume growth will be moderate, with the wine segment being forecast to see a volume CAGR of approximately 0.28%. The market will continue to be shaped by shifting end user trends, such as increasing health consciousness and the trend towards lower alcohol and non-alcoholic drinks. Off-trade channels will be important, representing 55% of the market, led primarily by Systembolaget outlets, which account for the majority of retail sales of higher ABV drinks.
Health-conscious consumption will continue to influence product choice. end users, particularly younger end users, increasingly want lower-alcohol, non-alcoholic, and lower-calorie drinks. RTDs and non-alcoholic versions of beer, wine, and spirits will increase in significance as a result of innovation from major players like Heineken and craft brewers. Flavoured varieties, Radler beer, and alternative packaging formats will be of interest to end users wanting variety and new tastes.
Sustainability will increasingly become a part of the market, with green packaging, locally produced ingredients, and lower carbon footprints driving buying decisions. Systembolaget's carbon-neutral focus and environmentally friendly products will continue to drive this trend, pushing other competitors to follow suit.
Economic stress and taxation will remain shaping end user behavior, with cost-conscious end users preferring cheaper and lower-ABV alternatives. Meanwhile, premium and innovative products should continue to find favor with end users looking for something special. In general, the market should develop steadily in value during the forecast period, with product innovation, health focus, and sustainability shaping trends.
Sweden Alcoholic Drinks Market Growth Driver
Increased Demand for Premium Drinks
Rising end users demand for premium products is shaping the growth of the alcoholic drinks segment in Sweden. End users are now more inclined towards products that provide quality, authenticity, and experience. Craft beers, specialty spirits, and niche wines are becoming increasingly popular, with end users focusing more on taste and exclusivity instead of volume. This is a part of a bigger trend towards lifestyle-driven consumption.
Premiumisation trend is further underpinned by increasing health consciousness, which stimulates demand for low-alcohol and no-alcohol drinks. The younger age groups, especially Millennials and Gen Z, are interested in new, tasty, and convenient products. These tendencies make businesses tend to broaden their product ranges and launch new formats, thus positioning premium drinks as one of the key drivers of market development in Sweden.
Sweden Alcoholic Drinks Market Challenge
Price Sensitivity and Economic Pressures
Rising economic pressures are affecting consumer spending patterns, directly influencing purchasing behavior in the alcoholic drinks segment. With increasing living expenses, most end users are becoming more prudent in their purchases, tending to choose affordability over top brands. This has translated into stagnant sales of mainstream alcoholic drinks and more competition from low-cost alternatives.
Moreover, regulatory restrictions and taxation add to the challenge facing manufacturers and distributors. End users of younger age groups increasingly preferring moderation and low-strength products also restrict demand in established high-strength segments. All of these trends create challenges to businesses in reconciling affordability and quality with profitability while maintaining profitability in a price-sensitive market.
Unlock Market Intelligence
Explore the market potential with our data-driven report
Sweden Alcoholic Drinks Market Trend
Health and Sustainability Shaping Choices
The Sweden Alcoholic Drinks market is observing a definite trend towards health-conscious consumption. End users are increasingly choosing products with lower alcohol content or even non-alcoholic versions to harmonize social experiences with lifestyle ambitions. Low-calorie beers, non-alcoholic spirits, and functional drinks are increasingly dominating the market scene.
Sustainability is yet another robust driver of purchasing decisions. Shoppers proactively seek out environmentally friendly packaging, organic content, and responsibly sourced materials. This twofold focus on health and sustainability is compelling businesses to innovate and get in touch with end user values. The trend is redefining old habits of consumption and challenging manufacturers to spend on responsible and future-facing product portfolios.
Sweden Alcoholic Drinks Market Opportunity
Growth of Premium and Health-Focused Categories
Health-oriented and premium alcoholic beverages are expected to witness strong growth in the coming years. Manufacturers can gain advantage by increasing their range of low-alcohol, non-alcoholic, and innovative ready-to-drink products, which match the escalating preference for healthier alternatives and contemporary lifestyles.
Moreover, green end users will propel higher adoption of sustainable packaging and natural ingredients. Brands that invest in premiumisation, product innovation, and sustainability will be well placed to gain a larger end user base. Through personalisation, authenticity, and health-focused innovation, Sweden players will be able to achieve sustainable growth and bolster their footprint in a highly dynamic marketplace.
Unlock Market Intelligence
Explore the market potential with our data-driven report
Sweden Alcoholic Drinks Market Segmentation Analysis

By Type
- Beer
- Cider/Perry
- RTDs
- Spirits
- Wine
The segment with highest market share under type segment is wine, with a 40% share of Sweden Alcoholic Drinks market. Wine remains the end user choice of choice, backed by drinking culture and extensive variety offered by Systembolaget stores. Strong focus on sustainability is also augmenting the category, with projects like the elimination of heavy glass bottles being well-accepted by end users.
During the forecast period, wine shall experience a modest volume CAGR of approximately 0.28%. Product innovation, especially in low- and non-alcoholic variants, addressing the growing health and wellness trend, shall support growth further. Moreover, sustainable packaging alternatives and investment by dominant players shall ensure that end user interest remains strong, and wine continues to remain the biggest contributor in Sweden Alcoholic Drinks market.
By Sales Channel
- On-Trade
- Off-Trade
The segment with highest market share under sales channel is off-trade that accounted for 55% of Sweden alcohol beverage market. Off-trade is overwhelmingly controlled by the state-owned chain of stores, Systembolaget, which holds a monopoly on retailing products over 3.5% ABV. These stores provide excellent availability and range, thus becoming the focal point for buying wine and spirits in the country.
In spite of the rebound in on-trade volumes post-pandemic, off-trade still drives distribution. Nevertheless, end users have increasingly been subdued in their spending with the rise in inflation, tending towards cheaper Alcoholic Drinks in this channel. In the future, the off-trade channel will continue to hold the top position, underpinned by Systembolaget's emphasis on sustainability measures, including carbon-neutrality ambitions and sustainable packaging, that resonate with end users hopes for responsible and ethical retailing.
Top Companies in Sweden Alcoholic Drinks Market
The top companies operating in the market include Heineken NV, Anora Group Oyj, Galatea Spirits AB, Spendrups Bryggeri AB, Carlsberg A/S, Åbro Bryggeri AB, Kopparbergs Bryggeri AB, Krönleins Bryggeri AB, Molson Coors Brewing Co, Herrljunga Cider AB, etc., are the top players operating in the Sweden Alcoholic Drinks Market.
Frequently Asked Questions
Related Report
1. Market Segmentation
1.1. Research Scope
1.2. Research Methodology
1.3. Definitions and Assumptions
2. Executive Summary
3. Sweden Alcoholic Drinks Market Policies, Regulations, and Standards
4. Sweden Alcoholic Drinks Market Dynamics
4.1. Growth Factors
4.2. Challenges
4.3. Trends
4.4. Opportunities
5. Sweden Alcoholic Drinks Market Statistics, 2022-2032F
5.1. Market Size & Growth Outlook
5.1.1. By Revenues in US$ Million
5.1.2. By Quantity Sold in Million Litres
5.2. Market Segmentation & Growth Outlook
5.2.1. By Type
5.2.1.1. Beer- Market Insights and Forecast 2022-2032, USD Million
5.2.1.2. Cider/Perry- Market Insights and Forecast 2022-2032, USD Million
5.2.1.3. RTDs- Market Insights and Forecast 2022-2032, USD Million
5.2.1.4. Spirits- Market Insights and Forecast 2022-2032, USD Million
5.2.1.5. c- Market Insights and Forecast 2022-2032, USD Million
5.2.2. By Alcohol Content
5.2.2.1. High- Market Insights and Forecast 2022-2032, USD Million
5.2.2.2. Medium- Market Insights and Forecast 2022-2032, USD Million
5.2.2.3. Low- Market Insights and Forecast 2022-2032, USD Million
5.2.3. By Flavor
5.2.3.1. Unflavored- Market Insights and Forecast 2022-2032, USD Million
5.2.3.2. Flavored- Market Insights and Forecast 2022-2032, USD Million
5.2.4. By Packaging Type
5.2.4.1. Glass Bottles- Market Insights and Forecast 2022-2032, USD Million
5.2.4.2. Tins- Market Insights and Forecast 2022-2032, USD Million
5.2.4.3. Plastic Bottles- Market Insights and Forecast 2022-2032, USD Million
5.2.4.4. Others- Market Insights and Forecast 2022-2032, USD Million
5.2.5. By Sales Channel
5.2.5.1. On-Trade- Market Insights and Forecast 2022-2032, USD Million
5.2.5.2. Off-Trade- Market Insights and Forecast 2022-2032, USD Million
5.2.5.2.1. Retail Offline- Market Insights and Forecast 2022-2032, USD Million
5.2.5.2.2. Retail Online- Market Insights and Forecast 2022-2032, USD Million
5.2.6. By Competitors
5.2.6.1. Competition Characteristics
5.2.6.2. Market Share & Analysis
6. Sweden Beer Market Statistics, 2022-2032F
6.1. Market Size & Growth Outlook
6.1.1. By Revenues in US$ Million
6.1.2. By Quantity Sold in Million Litres
6.2. Market Segmentation & Growth Outlook
6.2.1. By Alcohol Content- Market Insights and Forecast 2022-2032, USD Million
6.2.2. By Flavor- Market Insights and Forecast 2022-2032, USD Million
6.2.3. By Packaging Type- Market Insights and Forecast 2022-2032, USD Million
6.2.4. By Sales Channel- Market Insights and Forecast 2022-2032, USD Million
7. Sweden Cider/Perry Market Statistics, 2022-2032F
7.1. Market Size & Growth Outlook
7.1.1. By Revenues in US$ Million
7.1.2. By Quantity Sold in Million Litres
7.2. Market Segmentation & Growth Outlook
7.2.1. By Alcohol Content- Market Insights and Forecast 2022-2032, USD Million
7.2.2. By Flavor- Market Insights and Forecast 2022-2032, USD Million
7.2.3. By Packaging Type- Market Insights and Forecast 2022-2032, USD Million
7.2.4. By Sales Channel- Market Insights and Forecast 2022-2032, USD Million
8. Sweden Ready-to-Drink Market Statistics, 2022-2032F
8.1. Market Size & Growth Outlook
8.1.1. By Revenues in US$ Million
8.1.2. By Quantity Sold in Million Litres
8.2. Market Segmentation & Growth Outlook
8.2.1. By Alcohol Content- Market Insights and Forecast 2022-2032, USD Million
8.2.2. By Flavor- Market Insights and Forecast 2022-2032, USD Million
8.2.3. By Packaging Type- Market Insights and Forecast 2022-2032, USD Million
8.2.4. By Sales Channel- Market Insights and Forecast 2022-2032, USD Million
9. Sweden Spirits Market Statistics, 2022-2032F
9.1. Market Size & Growth Outlook
9.1.1. By Revenues in US$ Million
9.1.2. By Quantity Sold in Million Litres
9.2. Market Segmentation & Growth Outlook
9.2.1. By Alcohol Content- Market Insights and Forecast 2022-2032, USD Million
9.2.2. By Flavor- Market Insights and Forecast 2022-2032, USD Million
9.2.3. By Packaging Type- Market Insights and Forecast 2022-2032, USD Million
9.2.4. By Sales Channel- Market Insights and Forecast 2022-2032, USD Million
10. Sweden Wine Market Statistics, 2022-2032F
10.1.Market Size & Growth Outlook
10.1.1. By Revenues in US$ Million
10.1.2. By Quantity Sold in Million Litres
10.2.Market Segmentation & Growth Outlook
10.2.1. By Alcohol Content- Market Insights and Forecast 2022-2032, USD Million
10.2.2. By Flavor- Market Insights and Forecast 2022-2032, USD Million
10.2.3. By Packaging Type- Market Insights and Forecast 2022-2032, USD Million
10.2.4. By Sales Channel- Market Insights and Forecast 2022-2032, USD Million
11. Competitive Outlook
11.1.Company Profiles
11.1.1. Spendrups Bryggeri AB
11.1.1.1. Business Description
11.1.1.2. Product Portfolio
11.1.1.3. Collaborations & Alliances
11.1.1.4. Recent Developments
11.1.1.5. Financial Details
11.1.1.6. Others
11.1.2. Carlsberg A/S
11.1.2.1. Business Description
11.1.2.2. Product Portfolio
11.1.2.3. Collaborations & Alliances
11.1.2.4. Recent Developments
11.1.2.5. Financial Details
11.1.2.6. Others
11.1.3. Åbro Bryggeri AB
11.1.3.1. Business Description
11.1.3.2. Product Portfolio
11.1.3.3. Collaborations & Alliances
11.1.3.4. Recent Developments
11.1.3.5. Financial Details
11.1.3.6. Others
11.1.4. Kopparbergs Bryggeri AB
11.1.4.1. Business Description
11.1.4.2. Product Portfolio
11.1.4.3. Collaborations & Alliances
11.1.4.4. Recent Developments
11.1.4.5. Financial Details
11.1.4.6. Others
11.1.5. Krönleins Bryggeri AB
11.1.5.1. Business Description
11.1.5.2. Product Portfolio
11.1.5.3. Collaborations & Alliances
11.1.5.4. Recent Developments
11.1.5.5. Financial Details
11.1.5.6. Others
11.1.6. Heineken NV
11.1.6.1. Business Description
11.1.6.2. Product Portfolio
11.1.6.3. Collaborations & Alliances
11.1.6.4. Recent Developments
11.1.6.5. Financial Details
11.1.6.6. Others
11.1.7. Anora Group Oyj
11.1.7.1. Business Description
11.1.7.2. Product Portfolio
11.1.7.3. Collaborations & Alliances
11.1.7.4. Recent Developments
11.1.7.5. Financial Details
11.1.7.6. Others
11.1.8. Galatea Spirits AB
11.1.8.1. Business Description
11.1.8.2. Product Portfolio
11.1.8.3. Collaborations & Alliances
11.1.8.4. Recent Developments
11.1.8.5. Financial Details
11.1.8.6. Others
11.1.9. Molson Coors Brewing Co
11.1.9.1. Business Description
11.1.9.2. Product Portfolio
11.1.9.3. Collaborations & Alliances
11.1.9.4. Recent Developments
11.1.9.5. Financial Details
11.1.9.6. Others
11.1.10. Herrljunga Cider AB
11.1.10.1. Business Description
11.1.10.2. Product Portfolio
11.1.10.3. Collaborations & Alliances
11.1.10.4. Recent Developments
11.1.10.5. Financial Details
11.1.10.6. Others
12. Disclaimer
| Segment | Sub-Segment |
|---|---|
| By Type |
|
| By Alcohol Content |
|
| By Flavor |
|
| By Packaging Type |
|
| By Sales Channel |
|
Research Methodology
This study followed a structured approach comprising four key phases to assess the size and scope of the electro-oxidation market. The process began with thorough secondary research to collect data on the target market, related markets, and broader industry context. These findings, along with preliminary assumptions and estimates, were then validated through extensive primary research involving industry experts from across the value chain. To calculate the overall market size, both top-down and bottom-up methodologies were employed. Finally, market segmentation and data triangulation techniques were applied to refine and validate segment-level estimations.
Secondary Research
The secondary research phase involved gathering data from a wide range of credible and published sources. This step helped in identifying industry trends, defining market segmentation, and understanding the market landscape and value chain.
Sources consulted during this phase included:
- Company annual reports, investor presentations, and press releases
- Industry white papers and certified publications
- Trade directories and market-recognized databases
- Articles from authoritative authors and reputable journals
- Gold and silver standard websites
Secondary research was critical in mapping out the industry's value chain and monetary flow, identifying key market segments, understanding regional variations, and tracking significant industry developments.
Other key sources:
- Financial disclosures
- Industry associations and trade bodies
- News outlets and business magazines
- Academic journals and research studies
- Paid industry databases
Primary Research
To validate secondary data and gain deeper market insights, primary research was conducted with key stakeholders across both the supply and demand sides of the market.
On the demand side, participants included decision-makers and influencers from end-user industries—such as CIOs, CTOs, and CSOs—who provided first-hand perspectives on market needs, product usage, and future expectations.
On the supply side, interviews were conducted with manufacturers, industry associations, and institutional participants to gather insights into current offerings, product pipelines, and market challenges.
Primary interviews provided critical inputs such as:
- Market size and revenue data
- Product and service breakdowns
- Market forecasts
- Regional and application-specific trends
Stakeholders consulted included:
- Leading OEM and solution providers
- Channel and distribution partners
- End users across various applications
- Independent consultants and industry specialists
Market Size Estimation and Data Triangulation
- Identifying Key Market Participants (Secondary Research)
- Goal: To identify the major players or companies in the target market. This typically involves using publicly available data sources such as industry reports, market research publications, and financial statements of companies.
- Tools: Reports from firms like Gartner, Forrester, Euromonitor, Statista, IBISWorld, and others. Public financial statements, news articles, and press releases from top market players.
- Extracting Earnings of Key Market Participants
- Goal: To estimate the earnings generated from the product or service being analyzed. This step helps in understanding the revenue potential of each market player in a specific geography.
- Methods: Earnings data can be gathered from:
- Publicly available financial reports (for listed companies).
- Interviews and primary data sources from professionals, such as Directors, VPs, SVPs, etc. This is especially useful for understanding more nuanced, internal data that isn't publicly disclosed.
- Annual reports and investor presentations of key players.
- Data Collation and Development of a Relevant Data Model
- Goal: To collate inputs from both primary and secondary sources into a structured, data-driven model for market estimation. This model will incorporate key market KPIs and any independent variables relevant to the market.
- Key KPIs: These could include:
- Market size, growth rate, and demand drivers.
- Industry-specific metrics like market share, average revenue per customer (ARPC), or average deal size.
- External variables, such as economic growth rates, inflation rates, or commodity prices, that could affect the market.
- Data Modeling: Based on this data, the market forecasts are developed for the next 5 years. A combination of trend analysis, scenario modeling, and statistical regression might be used to generate projections.
- Scenario Analysis
- Goal: To test different assumptions and validate how sensitive the market is to changes in key variables (e.g., market demand, regulatory changes, technological disruptions).
- Types of Scenarios:
- Base Case: Based on current assumptions and historical data.
- Best-Case Scenario: Assuming favorable market conditions, regulatory environments, and technological advancements.
- Worst-Case Scenario: Accounting for adverse factors, such as economic downturns, stricter regulations, or unexpected disruptions.


