Norway Sports Nutrition Market Report: Trends, Growth and Forecast (2026-2032)
Product Type (Sports Protein Products (Protein/Energy Bars, Sports Protein Powder, Sports Protein RTD), Sports Non-Protein Products), Sales Channel (Retail Offline, Retail Online), Ingredients (Vitamins and Minerals, Proteins and Amino Acids, Carbohydrates, Probiotics, Botanicals/Herbals, Others), Functionality (Energy, Muscle growth, Hydration, Weight Management, Others), End User (Bodybuilders, Athletes, Lifestyle Users) ... Read more
|
Major Players
|
Norway Sports Nutrition Market Statistics and Insights, 2026
- Market Size Statistics
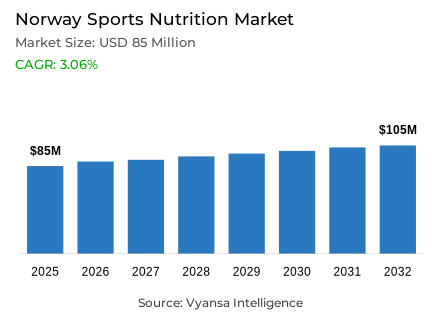
- Sports nutrition in Norway is estimated at USD 85 million.
- The market size is expected to grow to USD 105 million by 2032.
- Market to register a cagr of around 3.06% during 2026-32.
- Product Type Shares
- Sports protein products grabbed market share of 55%.
- Competition
- More than 10 companies are actively engaged in producing sports nutrition in Norway.
- Top 5 companies acquired around 75% of the market share.
- 24 Fitness AS; Feelgood Company AS; Nordic Sports Nutrition AB; Health & Sports Nutrition Group HSNG AB; Orkla Health AS etc., are few of the top companies.
- Sales Channel
- Retail online grabbed 60% of the market.
Norway Sports Nutrition Market Outlook
The Norway sports nutrition market is valued at around USD 85 million in 2025, the market is projected to reach around USD 105 million by 2032, representing a CAGR of around 3.06% during the forecast period. The sports nutrition market is set to grow steadily between 2026 and 2032, fueled by a rising interest in exercise, fitness, and healthy lifestyles This growth is supported by more end user incorporating both protein and non-protein products into their routines to enhance performance and support overall wellness.
Sports protein products will maintain the lead in the market, as they already occupy around 55% share. Protein powders, shakes, and bars plays a key role in strength building and recovery among end users, making this segment the most significant within the sports nutrition category. Their wide availability of protein products in stores along with regular consumption by both regular and casual gym end users ensure sustained demand for these products.
Retail online is set to remain the largest sales channel, accounting for around 60% of the market. The main reason for this dominance is, retail online shopping is easy and convenient for end users, especially for bulky products like protein powders and large packs of bars. Retail online platforms are providing wider selection for products and better prices, which keep retail online channels ahead of retail offline. The preference of retail online channels is expected to continue beyond the forecast period.
Competition will also play a role in shaping future growth. More than 10 companies are active in the sports nutrition market, with the top five players controlling around 75% of the market. The high concentration implies that the established brands will continue to influence pricing, product availability, and innovation, while smaller players are likely to focus on specialized offerings to attract particular end user groups.

Norway Sports Nutrition Market Growth DriverRising Interest in Exercise Supporting Market Growth
Sports nutrition continues to see a strong value growth, with more end users showing interest in maintaining their health and exercise outcomes. This category is one of the best performing in end user health, and is supported by the end user willingness to improve their performance through both protein and non-protein products. Increased consciousness about body health, and strong influence through social media, is also encouraging many end user to include these products in their fitness routines. Gyms have become important points of sale, further helping the category's visibility and accessibility among fitness minded end users.
Additionally, more than 83% of Norway's end user work out at least once a week, and 42.2% have trained in a gym over the last year, indicating an extremely active population that frequently seeks nutrition support to further improve their performance. The ongoing focus on fitness and performance enhancement is likely to boost the market, showing that the culture of regular exercise and health awareness is deeply influencing end user behaviour.
Norway Sports Nutrition Market ChallengeHigh Protein Dairy Products Restricting Market Expansion
Sports nutrition is expected to see strong growth, although the competition is slowing it from reaching its actual potential. Products such as flavoured milk drinks and high protein dairy items are attracting many end users who seek convenient protein options. While the interest in high protein intake remains stable, these dairy based products are more established and are widely available throughout the country, thus making it hard for sports nutrition products, such as protein bars and powders, to gain further momentum.
Traditional dairy products remain the most vital source of protein for end user. With various protein intake studies showing that most end users manage to meet their daily needs through conventional dairy products, rather than supplements. Moreover, according to the WHO, adults can meet their requirement of 0.8 g/kg a day through regular diets, leaving limited room for expansion of specialized products. This further pushes down the possibilities for sports protein products to become the part of end users daily routine.
Unlock Market Intelligence
Explore the market potential with our data-driven report
Norway Sports Nutrition Market TrendProtein Bars Becoming Convenient Everyday Snacks
Protein bars are performing well in Norway because they fit into multiple lifestyle needs. For the end users, they are no longer just post exercise supplements but also a quick and healthy snack between main courses or while on the go. Many even replace ordinary chocolate bars with protein bars as a healthier and convenient choice for nutrition. These habits are shaped by busy routines, frequent traveling, and a growing focus on balanced eating.
About 55.5% of Norway end user aged 16 and over are doing strength training, which is the main activity associated with protein use. Overall, 87% of the population exercises regularly. With such high level of participation in fitness activities, demand for convenient and portable nutrition like protein bars remains strong. Their easy availability through various sales channels continues to boost the strong position of these products in sports nutrition.
Norway Sports Nutrition Market OpportunityGrowing Shift Toward Plant Based Sports Nutrition
Another significant growth area within the sports nutrition sector is the increasing demand for plant based and vegan products. The end users are becoming aware of the benefits derived from plant sources of proteins and seeks those products that better align with their ethics and values regarding the environment. This shift is supported by the global rise of plant based diets and the preference for clean label, dairy free, and sustainable nutrition options. Such products appeal not only to regular gym-goers but also to a wider group of end users who are focused on overall wellness and balanced living.
Additionally, about 9% of Norway end users identify as vegetarian and 4% as vegan, although 53% consider themselves flexitarian, showing extensive interest in plant based eating habits. Besides this, the European plant based food sector grew by 49% between 2018 and 2020, reinforcing the prospects for plant based sports nutrition alternatives that support sustainability goals.
Unlock Market Intelligence
Explore the market potential with our data-driven report
Norway Sports Nutrition Market Segmentation Analysis
By Product Type
- Sports Protein Products
- Sports Non-Protein Products
Sports protein products hold the largest share, with around 55% of the overall segment sales. The category maintains its leading position due to the growing focus of end users on fitness, strength, and muscle recovery. The convenience of achieving nutritional goals is enhanced by the wide availability of protein powders, ready to drink shakes, and bars. With added nutrients and minerals, these products are suitable not only for athletes but also for everyday end users seeking a balanced diet.
Furthermore, several product types, such as energy and hydration products, are experiencing moderate growth because more end users participate in sports and outdoor activities. However, the sports protein products category continues to dominates the market due to its visible performance benefits, as well as easy accessibility through gyms, supermarkets, and retail online channels that hold the end users interest, therefore creating a consistent demand from health conscious end users.

By Sales Channel
- Retail Offline
- Retail Online
Retail online holds around 60% of the total sales share. This is because buying online is easier and more convenient for many end users. Retail online stores offers a wider option, with better prices and home delivery. For instance, products such as protein powders, creatine, and large packs of protein bars are often more economical online than in physical stores. This convenience has made retail online shopping more popular among end users who frequent gym goers and fitness lovers.
On the other hand, some end users still prefer retail offline, as they like to see and check products before purchasing. However, most sales happen online because it saves time and provides more options. Since these products generally have a long shelf life and can be heavy to carry, many of the end users find retail online shopping a more comfortable way to purchase them.
List of Companies Covered in Norway Sports Nutrition Market
The companies listed below are highly influential in the Norway sports nutrition market, with a significant market share and a strong impact on industry developments.
- 24 Fitness AS
- Feelgood Company AS
- Nordic Sports Nutrition AB
- Health & Sports Nutrition Group HSNG AB
- Orkla Health AS
- Proteinfabrikken AS
- Midsona Norge AS
- Herbalife Norway Products AS
- Tine SA
- Bonaventura Sales AS
Market News & Updates
- Herbalife Norway Products AS, 2024:
Herbalife Norway Products AS launched the global Herbalife V vegan protein line and expanded plant-based protein offerings with major fitness campaigns in 2024.
- Feelgood Company AS, 2025:
Feelgood Company AS acquired MM Sports in July 2025, expanding its sports-protein product portfolio and distribution reach.
Frequently Asked Questions
Related Report
1. Market Segmentation
1.1. Research Scope
1.2. Research Methodology
1.3. Definitions and Assumptions
2. Executive Summary
3. Norway Sports Nutrition Market Policies, Regulations, and Standards
4. Norway Sports Nutrition Market Dynamics
4.1. Growth Factors
4.2. Challenges
4.3. Trends
4.4. Opportunities
5. Norway Sports Nutrition Market Statistics, 2022-2032F
5.1. Market Size & Growth Outlook
5.1.1.By Revenues in USD Million
5.2. Market Segmentation & Growth Outlook
5.2.1.By Product Type
5.2.1.1. Sports Protein Products- Market Insights and Forecast 2022-2032, USD Million
5.2.1.1.1. Protein/Energy Bars- Market Insights and Forecast 2022-2032, USD Million
5.2.1.1.2. Sports Protein Powder- Market Insights and Forecast 2022-2032, USD Million
5.2.1.1.3. Sports Protein RTD- Market Insights and Forecast 2022-2032, USD Million
5.2.1.2. Sports Non-Protein Products- Market Insights and Forecast 2022-2032, USD Million
5.2.2.By Sales Channel
5.2.2.1. Retail Offline- Market Insights and Forecast 2022-2032, USD Million
5.2.2.2. Retail Online- Market Insights and Forecast 2022-2032, USD Million
5.2.3.By Ingredients
5.2.3.1. Vitamins and Minerals- Market Insights and Forecast 2022-2032, USD Million
5.2.3.2. Proteins and Amino Acids- Market Insights and Forecast 2022-2032, USD Million
5.2.3.3. Carbohydrates- Market Insights and Forecast 2022-2032, USD Million
5.2.3.4. Probiotics- Market Insights and Forecast 2022-2032, USD Million
5.2.3.5. Botanicals/Herbals- Market Insights and Forecast 2022-2032, USD Million
5.2.3.6. Others- Market Insights and Forecast 2022-2032, USD Million
5.2.4.By Functionality
5.2.4.1. Energy- Market Insights and Forecast 2022-2032, USD Million
5.2.4.2. Muscle growth- Market Insights and Forecast 2022-2032, USD Million
5.2.4.3. Hydration- Market Insights and Forecast 2022-2032, USD Million
5.2.4.4. Weight Management- Market Insights and Forecast 2022-2032, USD Million
5.2.4.5. Others- Market Insights and Forecast 2022-2032, USD Million
5.2.5.By End User
5.2.5.1. Bodybuilders- Market Insights and Forecast 2022-2032, USD Million
5.2.5.2. Athletes- Market Insights and Forecast 2022-2032, USD Million
5.2.5.3. Lifestyle Users- Market Insights and Forecast 2022-2032, USD Million
5.2.6.By Competitors
5.2.6.1. Competition Characteristics
5.2.6.2. Market Share & Analysis
6. Norway Protein Products Sports Nutrition Market Statistics, 2022-2032F
6.1. Market Size & Growth Outlook
6.1.1.By Revenues in USD Million
6.2. Market Segmentation & Growth Outlook
6.2.1.By Sales Channel- Market Insights and Forecast 2022-2032, USD Million
6.2.2.By Ingredients- Market Insights and Forecast 2022-2032, USD Million
6.2.3.By Functionality- Market Insights and Forecast 2022-2032, USD Million
6.2.4.By End User- Market Insights and Forecast 2022-2032, USD Million
7. Norway Non-Protein Products Sports Nutrition Market Statistics, 2022-2032F
7.1. Market Size & Growth Outlook
7.1.1.By Revenues in USD Million
7.2. Market Segmentation & Growth Outlook
7.2.1.By Sales Channel- Market Insights and Forecast 2022-2032, USD Million
7.2.2.By Ingredients- Market Insights and Forecast 2022-2032, USD Million
7.2.3.By Functionality- Market Insights and Forecast 2022-2032, USD Million
7.2.4.By End User- Market Insights and Forecast 2022-2032, USD Million
8. Competitive Outlook
8.1. Company Profiles
8.1.1.Health & Sports Nutrition Group HSNG AB
8.1.1.1. Business Description
8.1.1.2. Product Portfolio
8.1.1.3. Collaborations & Alliances
8.1.1.4. Recent Developments
8.1.1.5. Financial Details
8.1.1.6. Others
8.1.2.Orkla Health AS
8.1.2.1. Business Description
8.1.2.2. Product Portfolio
8.1.2.3. Collaborations & Alliances
8.1.2.4. Recent Developments
8.1.2.5. Financial Details
8.1.2.6. Others
8.1.3.Proteinfabrikken AS
8.1.3.1. Business Description
8.1.3.2. Product Portfolio
8.1.3.3. Collaborations & Alliances
8.1.3.4. Recent Developments
8.1.3.5. Financial Details
8.1.3.6. Others
8.1.4.Midsona Norge AS
8.1.4.1. Business Description
8.1.4.2. Product Portfolio
8.1.4.3. Collaborations & Alliances
8.1.4.4. Recent Developments
8.1.4.5. Financial Details
8.1.4.6. Others
8.1.5.Herbalife Norway Products AS
8.1.5.1. Business Description
8.1.5.2. Product Portfolio
8.1.5.3. Collaborations & Alliances
8.1.5.4. Recent Developments
8.1.5.5. Financial Details
8.1.5.6. Others
8.1.6.24 Fitness AS
8.1.6.1. Business Description
8.1.6.2. Product Portfolio
8.1.6.3. Collaborations & Alliances
8.1.6.4. Recent Developments
8.1.6.5. Financial Details
8.1.6.6. Others
8.1.7.Feelgood Company AS, The
8.1.7.1. Business Description
8.1.7.2. Product Portfolio
8.1.7.3. Collaborations & Alliances
8.1.7.4. Recent Developments
8.1.7.5. Financial Details
8.1.7.6. Others
8.1.8.Nordic Sports Nutrition AB
8.1.8.1. Business Description
8.1.8.2. Product Portfolio
8.1.8.3. Collaborations & Alliances
8.1.8.4. Recent Developments
8.1.8.5. Financial Details
8.1.8.6. Others
8.1.9.Tine SA
8.1.9.1. Business Description
8.1.9.2. Product Portfolio
8.1.9.3. Collaborations & Alliances
8.1.9.4. Recent Developments
8.1.9.5. Financial Details
8.1.9.6. Others
8.1.10. Bonaventura Sales AS
8.1.10.1. Business Description
8.1.10.2. Product Portfolio
8.1.10.3. Collaborations & Alliances
8.1.10.4. Recent Developments
8.1.10.5. Financial Details
8.1.10.6. Others
9. Disclaimer
| Segment | Sub-Segment |
|---|---|
| By Product Type |
|
| By Sales Channel |
|
| By Ingredients |
|
| By Functionality |
|
| By End User |
|
Research Methodology
This study followed a structured approach comprising four key phases to assess the size and scope of the electro-oxidation market. The process began with thorough secondary research to collect data on the target market, related markets, and broader industry context. These findings, along with preliminary assumptions and estimates, were then validated through extensive primary research involving industry experts from across the value chain. To calculate the overall market size, both top-down and bottom-up methodologies were employed. Finally, market segmentation and data triangulation techniques were applied to refine and validate segment-level estimations.
Secondary Research
The secondary research phase involved gathering data from a wide range of credible and published sources. This step helped in identifying industry trends, defining market segmentation, and understanding the market landscape and value chain.
Sources consulted during this phase included:
- Company annual reports, investor presentations, and press releases
- Industry white papers and certified publications
- Trade directories and market-recognized databases
- Articles from authoritative authors and reputable journals
- Gold and silver standard websites
Secondary research was critical in mapping out the industry's value chain and monetary flow, identifying key market segments, understanding regional variations, and tracking significant industry developments.
Other key sources:
- Financial disclosures
- Industry associations and trade bodies
- News outlets and business magazines
- Academic journals and research studies
- Paid industry databases
Primary Research
To validate secondary data and gain deeper market insights, primary research was conducted with key stakeholders across both the supply and demand sides of the market.
On the demand side, participants included decision-makers and influencers from end-user industries—such as CIOs, CTOs, and CSOs—who provided first-hand perspectives on market needs, product usage, and future expectations.
On the supply side, interviews were conducted with manufacturers, industry associations, and institutional participants to gather insights into current offerings, product pipelines, and market challenges.
Primary interviews provided critical inputs such as:
- Market size and revenue data
- Product and service breakdowns
- Market forecasts
- Regional and application-specific trends
Stakeholders consulted included:
- Leading OEM and solution providers
- Channel and distribution partners
- End users across various applications
- Independent consultants and industry specialists
Market Size Estimation and Data Triangulation
- Identifying Key Market Participants (Secondary Research)
- Goal: To identify the major players or companies in the target market. This typically involves using publicly available data sources such as industry reports, market research publications, and financial statements of companies.
- Tools: Reports from firms like Gartner, Forrester, Euromonitor, Statista, IBISWorld, and others. Public financial statements, news articles, and press releases from top market players.
- Extracting Earnings of Key Market Participants
- Goal: To estimate the earnings generated from the product or service being analyzed. This step helps in understanding the revenue potential of each market player in a specific geography.
- Methods: Earnings data can be gathered from:
- Publicly available financial reports (for listed companies).
- Interviews and primary data sources from professionals, such as Directors, VPs, SVPs, etc. This is especially useful for understanding more nuanced, internal data that isn't publicly disclosed.
- Annual reports and investor presentations of key players.
- Data Collation and Development of a Relevant Data Model
- Goal: To collate inputs from both primary and secondary sources into a structured, data-driven model for market estimation. This model will incorporate key market KPIs and any independent variables relevant to the market.
- Key KPIs: These could include:
- Market size, growth rate, and demand drivers.
- Industry-specific metrics like market share, average revenue per customer (ARPC), or average deal size.
- External variables, such as economic growth rates, inflation rates, or commodity prices, that could affect the market.
- Data Modeling: Based on this data, the market forecasts are developed for the next 5 years. A combination of trend analysis, scenario modeling, and statistical regression might be used to generate projections.
- Scenario Analysis
- Goal: To test different assumptions and validate how sensitive the market is to changes in key variables (e.g., market demand, regulatory changes, technological disruptions).
- Types of Scenarios:
- Base Case: Based on current assumptions and historical data.
- Best-Case Scenario: Assuming favorable market conditions, regulatory environments, and technological advancements.
- Worst-Case Scenario: Accounting for adverse factors, such as economic downturns, stricter regulations, or unexpected disruptions.


