South Africa Beer Market Report: Trends, Growth and Forecast (2026-2032)
Product Type (Dark Beer (Ale, Sorghum Beer, Weissbier/Weizen/Wheat Beer), Lager (Flavoured/Mixed Lager, Standard Lager (Premium Lager (Domestic Premium Lager, Imported Premium Lager), Mid-Priced Lager (Domestic Mid-Priced Lager, Imported Mid-Priced Lager), Economy Lager (Domestic Economy Lager, Imported Economy Lager))), Non/Low Alcohol Beer (Low Alcohol Beer, Non Alcoholic Beer), Stout, Others (Porter, Malt etc.)), Production (Macro Brewery, Micro Brewery, Craft Brewery), Packaging Type (Bottles, Cans, Others), Sales Channel (On-Trade, Off-Trade) ... Read more
|
Major Players
|
South Africa Beer Market Statistics and Insights, 2026
- Market Size Statistics
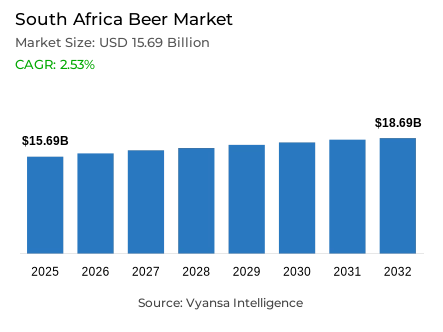
- Beer in South Africa is estimated at USD 15.69 billion.
- The market size is expected to grow to USD 18.69 billion by 2032.
- Market to register a cagr of around 2.53% during 2026-32.
- Product Type Shares
- Lager grabbed market share of 95%.
- Lager to witness a volume cagr of around 1.95%.
- Competition
- More than 5 companies are actively engaged in producing beer in South Africa.
- Top 5 companies acquired around 95% of the market share.
- United National Breweries (SA) Ltd; Brandhouse Beverages (Pty) Ltd; Delta Corp Ltd; South African Breweries Ltd; Heineken South Africa (Pty) Ltd etc., are few of the top companies.
- Sales Channel
- On-trade grabbed 55% of the market.
South Africa Beer Market Outlook
The South Africa beer market is worth $15.69 billion in 2025 and is expected to hit $18.69 billion in 2032 at a CAGR of approximately 2.53% during 2026–2032. Economic stabilisation, competitive pricing, and enhanced product visibility along distribution networks will support market performance. The nation's vast low-to-mid-income base will keep generating steady demand for cheaper beer variants, particularly domestic mid-range-priced lagers. The on-trade channel, accounting for 55% of all sales, will continue to be crucial in the growth of the market as bars, restaurants, and pubs regain good traffic following economic recovery.
Lager beers, which constitute nearly 95% of total market share, will still have a stronghold on the South Africa beer market, recording a volume CAGR of roughly 1.95%. Budget lagers – such as Carling Black Label and Castle – will remain dominant as they are inexpensive, exist as strong brands in the end users mind and are readily available. On the premium side of the market, imported brands like Corona and Stella Artois will continue to shift upwards as they attract affluent end users whom are attracted to their overseas appeal and branding muscle.
The heightened health and wellness awareness will also provide additional food for thought in regard to the beverage landscape, specifically non/low-alcohol beer will have solid growth as end end users select a healthy choice (without compromising on taste). This growth will be supported by breweries like Heineken 0.0 and Bavaria Non-Alcoholic who are well suited to service this changing end users palate, together with continued developments and higher distribution both on-trade and off-trade.
They will also invest in supply chain optimisation and responsible production methods to reinforce competitiveness. Emphasis on cost efficiency, water and energy management, and environmentally friendly packaging—particularly can formats—will improve affordability and attract changing consumption patterns. These initiatives, coupled with consistent category leadership by The South Africa Breweries, will ensure long-term market growth.

South Africa Beer Market Growth Driver
Competitive Pricing and Wide end users Support Market Stability
Beer continues to be the most popular and low-cost alcoholic drink in South Africa, helped by its powerful attraction with the low-to-mid-income market. Mid-range lagers like Carling Black Label and Castle lead sales because they provide affordability and extensive distribution, enabling them to connect with the majority of end users. Even amidst economic downturn and lower disposable incomes, these brands continue to sustain consistent sales on account of their value-for-money positioning and established brand image.
As the economy stabilizes, the nation's vast end users base guarantees stable beer consumption, ensuring overall market growth is maintained. The dominance of established brands and successful competitive pricing ensures beer remains affordable and desirable by region. All these factors cumulatively confirm beer's resilience in the market with affordability and brand loyalty emerging as major drivers guaranteeing long-term stability and sustained demand.
South Africa Beer Market Challenge
Inadequate Water Supply and Non-Reliable Electricity Supply Increase Production Costs
South Africa beer producers are continually plagued by water shortages and unreliable electricity supplies, both of which raise costs of production and operations. While disruptions to electricity have been less severe than in prior years, volatility still impacts production activities and supply chain effectiveness. Water shortage continues to be a concern for those breweries that rely heavily on continuous water availability for cleaning and brewing.
These sustained resource pressures affect output consistency and profitability, particularly among small breweries trying to offset increased costs. To maintain production and competitiveness, organisations are concentrating on optimising manufacturing processes and managing resources better. These infrastructural and environmental issues remain fundamental to guaranteeing seamless production, cost stabilisation, and facilitating long-term development in the beer sector despite sustained supply-side pressures.
Unlock Market Intelligence
Explore the market potential with our data-driven report
South Africa Beer Market Trend
Increasing Trend Towards Health and Well-being Preferences
Growing health and wellness awareness is increasingly shaping beer consumption habits in South Africa, with more end users opting for low- or non-alcoholic alternatives. Heineken 0.0, Bavaria Non-Alcoholic, and Devil's Peak Hero are becoming popular for the refreshing flavor without the impacts of alcohol. This trend indicates a rise in preference for responsible drinking among end users interested in balance and moderation.
Light and flavourled beer versions are also experiencing growing popularity as they offer flavour innovation together with reduced alcohol. Enhanced product access, enhanced taste quality, and broader distribution are fueling increased adoption of these alternatives. As health-conscious lifestyles take greater prominence, the industry is responding by innovating towards health-oriented tastes, and wellness-conscious alternatives are becoming a significant addition to the market space.
South Africa Beer Market Opportunity
Growth Potential in Premium and Sustainable Offerings
The premium segment is anticipated to offer substantial growth prospects for the beer market in South Africa in the years ahead. With economic recovery ongoing and disposable income increasing, more affluent end users should look for more unique, high-quality beer experiences. Imported brands like Corona and Stella Artois will continue to have strong positions owing to good branding and aspirational value among urban end users.
Sustainability will also emerge as a major growth driver, with brewers concentrating on green packaging, water stewardship, and energy-efficient manufacturing. Firms are anticipated to improve the way they operate by supply chain optimisation and sustainable processes, making them competitive for the long term. Complementary, the increasing desire for premium experiences and sustainable consumption will create new opportunities for breweries to increase market share and develop brand equity throughout the forecast period.
Unlock Market Intelligence
Explore the market potential with our data-driven report
South Africa Beer Market Segmentation Analysis
By Product Type
- Dark Beer
- Lager
- Non/Low Alcohol Beer
- Stout
The segment with highest market share under Product Type is Lager, with almost 95% share in the South Africa Beer Market. Lager is the most sought-after option among end users because of its refreshing and crisp flavor as well as affordability. Local mid-range lagers like Carling Black Label and Castle are still leading, targeting a broad end users base concerned with both accessibility and quality. The dominant share of lager along retail and hospitality outlets further reinforces its leadership, becoming the favored drink for the majority of social and everyday occasions.
The segment's strength also exists in its diversity and brand popularity. While middle-priced lagers are the core staple, premium brands such as Corona and Stella Artois are starting to gain popularity among end end users looking for a more sophisticated consuming experience. Generally speaking, lager still characterizes South Africa beer culture through core demand, robust distribution, and entrenched end users affiliation.

By Sales Channel
- On-Trade
- Off-Trade
The segment with highest market share under Sales Channel is On-Trade, representing almost 55% share of the South Africa Beer Market. On-trade remains in the lead since beer consumption is directly linked to social events, food experiences, and nightlife culture. Taverns, restaurants, and bars are critical to sustaining this dominance by providing a lively environment where end users can indulge in a variety of beers ranging from mainstream domestic lagers to premium imports.
The channel is favored by growing brand partnerships, event promoting, and experiential elements that maximize visibility and interaction. Breweries go out of their way to ensure draught presence and product freshness to maximize the drinking experience. With its solid social and cultural relevance, the on-trade channel remains pivotal to beer consumption in South Africa, promoting brand recall and consistent sales momentum.
List of Companies Covered in South Africa Beer Market
The companies listed below are highly influential in the South Africa beer market, with a significant market share and a strong impact on industry developments.
- United National Breweries (SA) Ltd
- Brandhouse Beverages (Pty) Ltd
- Delta Corp Ltd
- South African Breweries Ltd
- Heineken South Africa (Pty) Ltd
- Bavaria Breweries South Africa (Pty) Ltd
- DGB (Pty) Ltd
Frequently Asked Questions
Related Report
1. Market Segmentation
1.1. Research Scope
1.2. Research Methodology
1.3. Definitions and Assumptions
2. Executive Summary
3. South Africa Beer Market Policies, Regulations, and Standards
4. South Africa Beer Market Dynamics
4.1. Growth Factors
4.2. Challenges
4.3. Trends
4.4. Opportunities
5. South Africa Beer Market Statistics, 2022-2032F
5.1. Market Size & Growth Outlook
5.1.1.By Revenues in US$ Million
5.1.2.By Quantity Sold in Million Litres
5.2. Market Segmentation & Growth Outlook
5.2.1.By Product Type
5.2.1.1. Dark Beer- Market Insights and Forecast 2022-2032, USD Million
5.2.1.1.1. Ale- Market Insights and Forecast 2022-2032, USD Million
5.2.1.1.2. Sorghum Beer- Market Insights and Forecast 2022-2032, USD Million
5.2.1.1.3. Weissbier/Weizen/Wheat Beer- Market Insights and Forecast 2022-2032, USD Million
5.2.1.2. Lager- Market Insights and Forecast 2022-2032, USD Million
5.2.1.2.1. Flavoured/Mixed Lager- Market Insights and Forecast 2022-2032, USD Million
5.2.1.2.2. Standard Lager- Market Insights and Forecast 2022-2032, USD Million
5.2.1.2.2.1. Premium Lager- Market Insights and Forecast 2022-2032, USD Million
5.2.1.2.2.1.1. Domestic Premium Lager- Market Insights and Forecast 2022-2032, USD Million
5.2.1.2.2.1.2. Imported Premium Lager- Market Insights and Forecast 2022-2032, USD Million
5.2.1.2.2.2. Mid-Priced Lager- Market Insights and Forecast 2022-2032, USD Million
5.2.1.2.2.2.1. Domestic Mid-Priced Lager- Market Insights and Forecast 2022-2032, USD Million
5.2.1.2.2.2.2. Imported Mid-Priced Lager- Market Insights and Forecast 2022-2032, USD Million
5.2.1.2.2.3. Economy Lager- Market Insights and Forecast 2022-2032, USD Million
5.2.1.2.2.3.1. Domestic Economy Lager- Market Insights and Forecast 2022-2032, USD Million
5.2.1.2.2.3.2. Imported Economy Lager- Market Insights and Forecast 2022-2032, USD Million
5.2.1.3. Non/Low Alcohol Beer- Market Insights and Forecast 2022-2032, USD Million
5.2.1.3.1. Low Alcohol Beer- Market Insights and Forecast 2022-2032, USD Million
5.2.1.3.2. Non Alcoholic Beer- Market Insights and Forecast 2022-2032, USD Million
5.2.1.4. Stout- Market Insights and Forecast 2022-2032, USD Million
5.2.1.5. Others (Porter, Malt etc.) - Market Insights and Forecast 2022-2032, USD Million
5.2.2.By Production
5.2.2.1. Macro Brewery- Market Insights and Forecast 2022-2032, USD Million
5.2.2.2. Micro Brewery- Market Insights and Forecast 2022-2032, USD Million
5.2.2.3. Craft Brewery- Market Insights and Forecast 2022-2032, USD Million
5.2.3.By Packaging Type
5.2.3.1. Bottles- Market Insights and Forecast 2022-2032, USD Million
5.2.3.2. Cans- Market Insights and Forecast 2022-2032, USD Million
5.2.3.3. Others- Market Insights and Forecast 2022-2032, USD Million
5.2.4.By Sales Channel
5.2.4.1. On-Trade- Market Insights and Forecast 2022-2032, USD Million
5.2.4.2. Off-Trade- Market Insights and Forecast 2022-2032, USD Million
5.2.5.By Competitors
5.2.5.1. Competition Characteristics
5.2.5.2. Market Share & Analysis
6. South Africa Dark Beer Market Statistics, 2022-2032F
6.1. Market Size & Growth Outlook
6.1.1.By Revenues in US$ Million
6.1.2.By Quantity Sold in Million Litres
6.2. Market Segmentation & Growth Outlook
6.2.1.By Product Type- Market Insights and Forecast 2022-2032, USD Million
6.2.2.By Production- Market Insights and Forecast 2022-2032, USD Million
6.2.3.By Packaging Type- Market Insights and Forecast 2022-2032, USD Million
6.2.4.By Sales Channel- Market Insights and Forecast 2022-2032, USD Million
7. South Africa Lager Beer Market Statistics, 2022-2032F
7.1. Market Size & Growth Outlook
7.1.1.By Revenues in US$ Million
7.1.2.By Quantity Sold in Million Litres
7.2. Market Segmentation & Growth Outlook
7.2.1.By Product Type- Market Insights and Forecast 2022-2032, USD Million
7.2.2.By Production- Market Insights and Forecast 2022-2032, USD Million
7.2.3.By Packaging Type- Market Insights and Forecast 2022-2032, USD Million
7.2.4.By Sales Channel- Market Insights and Forecast 2022-2032, USD Million
8. South Africa Non/Low Alcohol Beer Market Statistics, 2022-2032F
8.1. Market Size & Growth Outlook
8.1.1.By Revenues in US$ Million
8.1.2.By Quantity Sold in Million Litres
8.2. Market Segmentation & Growth Outlook
8.2.1.By Production- Market Insights and Forecast 2022-2032, USD Million
8.2.2.By Packaging Type- Market Insights and Forecast 2022-2032, USD Million
8.2.3.By Sales Channel- Market Insights and Forecast 2022-2032, USD Million
9. South Africa Stout Beer Market Statistics, 2022-2032F
9.1. Market Size & Growth Outlook
9.1.1.By Revenues in US$ Million
9.1.2.By Quantity Sold in Million Litres
9.2. Market Segmentation & Growth Outlook
9.2.1.By Production- Market Insights and Forecast 2022-2032, USD Million
9.2.2.By Packaging Type- Market Insights and Forecast 2022-2032, USD Million
9.2.3.By Sales Channel- Market Insights and Forecast 2022-2032, USD Million
10. Competitive Outlook
10.1. Company Profiles
10.1.1. South African Breweries Ltd, The
10.1.1.1. Business Description
10.1.1.2. Product Portfolio
10.1.1.3. Collaborations & Alliances
10.1.1.4. Recent Developments
10.1.1.5. Financial Details
10.1.1.6. Others
10.1.2. Heineken South Africa (Pty) Ltd
10.1.2.1. Business Description
10.1.2.2. Product Portfolio
10.1.2.3. Collaborations & Alliances
10.1.2.4. Recent Developments
10.1.2.5. Financial Details
10.1.2.6. Others
10.1.3. Delta Corp Ltd
10.1.3.1. Business Description
10.1.3.2. Product Portfolio
10.1.3.3. Collaborations & Alliances
10.1.3.4. Recent Developments
10.1.3.5. Financial Details
10.1.3.6. Others
10.1.4. Bavaria Breweries South Africa (Pty) Ltd
10.1.4.1. Business Description
10.1.4.2. Product Portfolio
10.1.4.3. Collaborations & Alliances
10.1.4.4. Recent Developments
10.1.4.5. Financial Details
10.1.4.6. Others
10.1.5. DGB (Pty) Ltd
10.1.5.1. Business Description
10.1.5.2. Product Portfolio
10.1.5.3. Collaborations & Alliances
10.1.5.4. Recent Developments
10.1.5.5. Financial Details
10.1.5.6. Others
10.1.6. United National Breweries (SA) Ltd
10.1.6.1. Business Description
10.1.6.2. Product Portfolio
10.1.6.3. Collaborations & Alliances
10.1.6.4. Recent Developments
10.1.6.5. Financial Details
10.1.6.6. Others
10.1.7. Brandhouse Beverages (Pty) Ltd
10.1.7.1. Business Description
10.1.7.2. Product Portfolio
10.1.7.3. Collaborations & Alliances
10.1.7.4. Recent Developments
10.1.7.5. Financial Details
10.1.7.6. Others
11. Disclaimer
| Segment | Sub-Segment |
|---|---|
| By Product Type |
|
| By Production |
|
| By Packaging Type |
|
| By Sales Channel |
|
Research Methodology
This study followed a structured approach comprising four key phases to assess the size and scope of the electro-oxidation market. The process began with thorough secondary research to collect data on the target market, related markets, and broader industry context. These findings, along with preliminary assumptions and estimates, were then validated through extensive primary research involving industry experts from across the value chain. To calculate the overall market size, both top-down and bottom-up methodologies were employed. Finally, market segmentation and data triangulation techniques were applied to refine and validate segment-level estimations.
Secondary Research
The secondary research phase involved gathering data from a wide range of credible and published sources. This step helped in identifying industry trends, defining market segmentation, and understanding the market landscape and value chain.
Sources consulted during this phase included:
- Company annual reports, investor presentations, and press releases
- Industry white papers and certified publications
- Trade directories and market-recognized databases
- Articles from authoritative authors and reputable journals
- Gold and silver standard websites
Secondary research was critical in mapping out the industry's value chain and monetary flow, identifying key market segments, understanding regional variations, and tracking significant industry developments.
Other key sources:
- Financial disclosures
- Industry associations and trade bodies
- News outlets and business magazines
- Academic journals and research studies
- Paid industry databases
Primary Research
To validate secondary data and gain deeper market insights, primary research was conducted with key stakeholders across both the supply and demand sides of the market.
On the demand side, participants included decision-makers and influencers from end-user industries—such as CIOs, CTOs, and CSOs—who provided first-hand perspectives on market needs, product usage, and future expectations.
On the supply side, interviews were conducted with manufacturers, industry associations, and institutional participants to gather insights into current offerings, product pipelines, and market challenges.
Primary interviews provided critical inputs such as:
- Market size and revenue data
- Product and service breakdowns
- Market forecasts
- Regional and application-specific trends
Stakeholders consulted included:
- Leading OEM and solution providers
- Channel and distribution partners
- End users across various applications
- Independent consultants and industry specialists
Market Size Estimation and Data Triangulation
- Identifying Key Market Participants (Secondary Research)
- Goal: To identify the major players or companies in the target market. This typically involves using publicly available data sources such as industry reports, market research publications, and financial statements of companies.
- Tools: Reports from firms like Gartner, Forrester, Euromonitor, Statista, IBISWorld, and others. Public financial statements, news articles, and press releases from top market players.
- Extracting Earnings of Key Market Participants
- Goal: To estimate the earnings generated from the product or service being analyzed. This step helps in understanding the revenue potential of each market player in a specific geography.
- Methods: Earnings data can be gathered from:
- Publicly available financial reports (for listed companies).
- Interviews and primary data sources from professionals, such as Directors, VPs, SVPs, etc. This is especially useful for understanding more nuanced, internal data that isn't publicly disclosed.
- Annual reports and investor presentations of key players.
- Data Collation and Development of a Relevant Data Model
- Goal: To collate inputs from both primary and secondary sources into a structured, data-driven model for market estimation. This model will incorporate key market KPIs and any independent variables relevant to the market.
- Key KPIs: These could include:
- Market size, growth rate, and demand drivers.
- Industry-specific metrics like market share, average revenue per customer (ARPC), or average deal size.
- External variables, such as economic growth rates, inflation rates, or commodity prices, that could affect the market.
- Data Modeling: Based on this data, the market forecasts are developed for the next 5 years. A combination of trend analysis, scenario modeling, and statistical regression might be used to generate projections.
- Scenario Analysis
- Goal: To test different assumptions and validate how sensitive the market is to changes in key variables (e.g., market demand, regulatory changes, technological disruptions).
- Types of Scenarios:
- Base Case: Based on current assumptions and historical data.
- Best-Case Scenario: Assuming favorable market conditions, regulatory environments, and technological advancements.
- Worst-Case Scenario: Accounting for adverse factors, such as economic downturns, stricter regulations, or unexpected disruptions.


