Malaysia Sports Nutrition Market Report: Trends, Growth and Forecast (2026-2032)
Product Type (Sports Protein Products (Protein/Energy Bars, Sports Protein Powder, Sports Protein RTD), Sports Non-Protein Products), Sales Channel (Retail Offline, Retail Online), Ingredients (Vitamins and Minerals, Proteins and Amino Acids, Carbohydrates, Probiotics, Botanicals/Herbals, Others), Functionality (Energy, Muscle growth, Hydration, Weight Management, Others), End User (Bodybuilders, Athletes, Lifestyle Users) ... Read more
|
Major Players
|
Malaysia Sports Nutrition Market Statistics and Insights, 2026
- Market Size Statistics
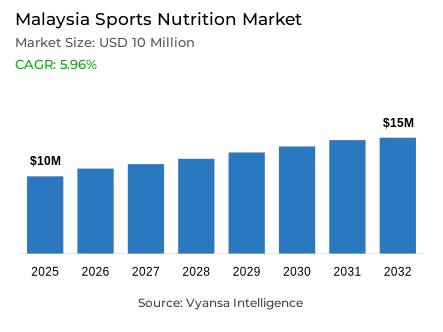
- Sports nutrition in Malaysia is estimated at USD 10 million.
- The market size is expected to grow to USD 15 million by 2032.
- Market to register a cagr of around 5.96% during 2026-32.
- Product Type Shares
- Sports protein products grabbed market share of 95%.
- Competition
- More than 5 companies are actively engaged in producing sports nutrition in Malaysia.
- Top 5 companies acquired around 65% of the market share.
- Iovate Health Sciences International Inc; Nova Nutritional Supplies (M) Sdn Bhd; Vitaco Health NZ Ltd; Herbalife Products (M) Sdn Bhd; Lac Global Brands (M) Sdn Bhd etc., are few of the top companies.
- Sales Channel
- Retail offline grabbed 70% of the market.
Malaysia Sports Nutrition Market Outlook
The Malaysia sports nutrition market has been growing steadily, with a projected value of around US$ 10 million in 2025. It is expected to rise to around US$ 15 million by 2032, at a CAGR of around 5.96% during the forecast period of 2026-2032. This growth can primarily be attributed to the end-users' increase in fitness awareness that are incorporating nutritional supplements into their everyday lives. Leading this surge is sports protein powder, as more individuals seek to maintain a proper physique, build muscle mass, and recover more quickly from workouts. The market also sees demand for new alternatives such as clear whey protein, which is marketed as a light and refreshing product suitable for younger end-users.
A strong emphasis on personal health and fitness is extending sports protein products' market lead, accounting for around 95% of total sales. These are convenient products that align very well with the increasing focus on regular exercise combined with healthy nutrition. In particular, the increasing use of whey and plant-based protein powders demonstrates the duality in performance versus nutrition balance desired by end users.
However, the competition in the market is immense, the top five contributors own around 65% of the total share. Major players lead the market due to powerful brand awareness, diverse product portfolios, and successful promotional activities. Their emphasis on trusted quality and proven results enables them to retain loyalty among customers. Simultaneously, other brands continue to struggle through tough price and visibility competition, since small brands usually have minimal resources for promotional activities and, subsequently, product development.
Retail offline channels still dominate the market, capturing around 70% of overall sales. Physical stores have gained end user trust with respect to product quality and personalized service, whereas online platforms are gradually becoming popular because of convenience. Both channels will reinforce each other and help in the growth of this market by making sports nutrition products conveniently available to all types of end users.

Malaysia Sports Nutrition Market Growth DriverSports Protein Powder Leading Market Expansion
Nowadays, end user are highly interested in products that help them stay fit and healthy. Sports protein powder is no longer consumed by just athletes but also by many who go to the gym or exercise for fun. This is further facilitated by increased health awareness and social media platforms where fitness goals and routines are shared. According to the NHMS 2019, 74.9% of adults in Malaysia were physically active, while the Malaysia Sports Culture Index 2023 showed 52% engage in sports or recreational activities at least once a month.
Besides this, a new version is known as clear whey protein, which is gaining much popularity due to its lightweight and easy intake. Its fruity flavors and refreshing nature attract young end users who prefer convenience with taste. This development also aligns with the Ministry of Health’s approach to preventive care for healthier lifestyles and fitness engagement across Malaysia.
Malaysia Sports Nutrition Market ChallengeStrict Rules Slowing Product Launches
There are so many details in government regulations on sports nutrition that it is difficult for companies to quickly launch new products into the market. Items are mainly considered as health supplements, and therefore their registration follows long procedures under the NPRA. Products must undergo laboratory testing, after which some safety and efficacy documents must be provided for approval according to the FDI classification system. The process increases cost and time, which delays how quickly new products can get to end users in the market.
Furthermore, NPRA allows only approved health claims on the labels and ads. If companies use words or claims that are not accepted, their products may be rejected. While these rules protect the end users from misleading information, they also hamper how brands can communicate the functional benefits of their products. A very strict regulatory structure, though it guarantees safety, makes new product development less flexible and slows overall category growth in sports nutrition.
Unlock Market Intelligence
Explore the market potential with our data-driven report
Malaysia Sports Nutrition Market TrendGrowing Shift Towards Plant-Based Protein Options
There is indeed a visible movement where end users are getting more interested in plant-based nutrition. Younger generations are engaged with vegan and keto diets, thus driving demand for plant-based sports protein derived from soy, pea, or any other plant source. In fact, as represented by official data in the Malaysia Department of Statistics, 59% view plant-based products as being healthier than those derived from animals, while 46% find them more environmentally friendly. This echoes greater movement toward sustainability and more balanced nutrition habits.
The rising awareness about the environment and ethics in lifestyles promotes the popularity of plant-based protein. According to national studies, most end users harbor very positive attitudes toward vegetarian foods and state they could adopt them more widely with continued education and support from health agencies. As these values spread, more end users are expected to replace animal-based nutritional supplements with plant-based alternatives and, thus, their role in the sports nutrition landscape is being extended.
Malaysia Sports Nutrition Market OpportunityInnovation in Convenient, On-the-Go Nutrition Formats
With increasingly fast daily routines, there is growing potential in offering sports nutrition products that match these routines. End users increasingly prefer items that are easy to carry and consume, such as energy gels, protein bars, and ready-to-drink options. According to Malaysia's Sports Culture Index 2023, 54.9% of end users prefer exercising during evening hours, showing how urban lifestyles demand quick nutrition solutions. The ready-to-drink beverage segment continues to grow strongly, reflecting wider end user preference for portable and time-saving formats.
Moreover, portable packaging and a wide range of flavor varieties make these products more accessible to a wider segment of the end market. As convenience becomes a driving factor in purchase decisions, continued format, taste, and portability innovation will continue to unlock new avenues of growth. The ability to bring together nutritional benefits with ease of use ensures these products will remain highly sought after by active and health-oriented end users.
Unlock Market Intelligence
Explore the market potential with our data-driven report
Malaysia Sports Nutrition Market Segmentation Analysis
By Product Type
- Sports Protein Products
- Sports Non-Protein Products
The segment with the highest share under the product type is sports protein products, holding around 95% of the market. Most end users prefer these products as they improve fitness, develop mass, and enhance the rate of recovery post-workout. The category encompasses a range of everyday easy-to-mix-and-consume formats, including powders and shakes. Increasing fitness awareness among end users, along with regular exercise routines, is also adding to the habit of incorporating protein supplements into their diets, even among non-professional athletes.
Besides this, the increasing emphasis on health and active lifestyles further sustains the demand for protein-based products. Among end-users, they are seen as a convenient means of achieving nutritional objectives coupled with the management of weight and energy levels. This strong and steady preference keeps sports protein products as the main part of the sports nutrition market and the key source of overall growth.

By Sales Channel
- Retail Offline
- Retail Online
Retail offline has the highest share in the sales channel segment and accounts for around 70% of the market. The majority of end users still prefer to purchase sports nutrition products from physical stores due to the ability to compare options, receive recommendations from staff, and inspect the quality of the product before purchase. Physical stores are favorable due to the sale of trusted products at cheaper prices based on high volume sales. These stores also offer a variety of local and imported products, enabling end users to select products that suit their fitness and health objectives.
However, retail online sales are surging fast, as end users appreciate the convenience of delivery to their homes or buying in bulk. Most brands have now adopted both store and online channels to reach out to more buyers. This mix of physical and digital access will help keep sports nutrition products widely available and affordable. As a result, both channels are expected to complement each other in the coming years.
List of Companies Covered in Malaysia Sports Nutrition Market
The companies listed below are highly influential in the Malaysia sports nutrition market, with a significant market share and a strong impact on industry developments.
- Iovate Health Sciences International Inc
- Nova Nutritional Supplies (M) Sdn Bhd
- Vitaco Health NZ Ltd
- Herbalife Products (M) Sdn Bhd
- Lac Global Brands (M) Sdn Bhd
Frequently Asked Questions
Related Report
1. Market Segmentation
1.1. Research Scope
1.2. Research Methodology
1.3. Definitions and Assumptions
2. Executive Summary
3. Malaysia Sports Nutrition Market Policies, Regulations, and Standards
4. Malaysia Sports Nutrition Market Dynamics
4.1. Growth Factors
4.2. Challenges
4.3. Trends
4.4. Opportunities
5. Malaysia Sports Nutrition Market Statistics, 2022-2032F
5.1. Market Size & Growth Outlook
5.1.1.By Revenues in USD Million
5.2. Market Segmentation & Growth Outlook
5.2.1.By Product Type
5.2.1.1. Sports Protein Products- Market Insights and Forecast 2022-2032, USD Million
5.2.1.1.1. Protein/Energy Bars- Market Insights and Forecast 2022-2032, USD Million
5.2.1.1.2. Sports Protein Powder- Market Insights and Forecast 2022-2032, USD Million
5.2.1.1.3. Sports Protein RTD- Market Insights and Forecast 2022-2032, USD Million
5.2.1.2. Sports Non-Protein Products- Market Insights and Forecast 2022-2032, USD Million
5.2.2.By Sales Channel
5.2.2.1. Retail Offline- Market Insights and Forecast 2022-2032, USD Million
5.2.2.2. Retail Online- Market Insights and Forecast 2022-2032, USD Million
5.2.3.By Ingredients
5.2.3.1. Vitamins and Minerals- Market Insights and Forecast 2022-2032, USD Million
5.2.3.2. Proteins and Amino Acids- Market Insights and Forecast 2022-2032, USD Million
5.2.3.3. Carbohydrates- Market Insights and Forecast 2022-2032, USD Million
5.2.3.4. Probiotics- Market Insights and Forecast 2022-2032, USD Million
5.2.3.5. Botanicals/Herbals- Market Insights and Forecast 2022-2032, USD Million
5.2.3.6. Others- Market Insights and Forecast 2022-2032, USD Million
5.2.4.By Functionality
5.2.4.1. Energy- Market Insights and Forecast 2022-2032, USD Million
5.2.4.2. Muscle growth- Market Insights and Forecast 2022-2032, USD Million
5.2.4.3. Hydration- Market Insights and Forecast 2022-2032, USD Million
5.2.4.4. Weight Management- Market Insights and Forecast 2022-2032, USD Million
5.2.4.5. Others- Market Insights and Forecast 2022-2032, USD Million
5.2.5.By End User
5.2.5.1. Bodybuilders- Market Insights and Forecast 2022-2032, USD Million
5.2.5.2. Athletes- Market Insights and Forecast 2022-2032, USD Million
5.2.5.3. Lifestyle Users- Market Insights and Forecast 2022-2032, USD Million
5.2.6.By Competitors
5.2.6.1. Competition Characteristics
5.2.6.2. Market Share & Analysis
6. Malaysia Protein Products Sports Nutrition Market Statistics, 2022-2032F
6.1. Market Size & Growth Outlook
6.1.1.By Revenues in USD Million
6.2. Market Segmentation & Growth Outlook
6.2.1.By Sales Channel- Market Insights and Forecast 2022-2032, USD Million
6.2.2.By Ingredients- Market Insights and Forecast 2022-2032, USD Million
6.2.3.By Functionality- Market Insights and Forecast 2022-2032, USD Million
6.2.4.By End User- Market Insights and Forecast 2022-2032, USD Million
7. Malaysia Non-Protein Products Sports Nutrition Market Statistics, 2022-2032F
7.1. Market Size & Growth Outlook
7.1.1.By Revenues in USD Million
7.2. Market Segmentation & Growth Outlook
7.2.1.By Sales Channel- Market Insights and Forecast 2022-2032, USD Million
7.2.2.By Ingredients- Market Insights and Forecast 2022-2032, USD Million
7.2.3.By Functionality- Market Insights and Forecast 2022-2032, USD Million
7.2.4.By End User- Market Insights and Forecast 2022-2032, USD Million
8. Competitive Outlook
8.1. Company Profiles
8.1.1.Herbalife Products (M) Sdn Bhd
8.1.1.1. Business Description
8.1.1.2. Product Portfolio
8.1.1.3. Collaborations & Alliances
8.1.1.4. Recent Developments
8.1.1.5. Financial Details
8.1.1.6. Others
8.1.2.Lac Global Brands (M) Sdn Bhd
8.1.2.1. Business Description
8.1.2.2. Product Portfolio
8.1.2.3. Collaborations & Alliances
8.1.2.4. Recent Developments
8.1.2.5. Financial Details
8.1.2.6. Others
8.1.3.Iovate Health Sciences International Inc
8.1.3.1. Business Description
8.1.3.2. Product Portfolio
8.1.3.3. Collaborations & Alliances
8.1.3.4. Recent Developments
8.1.3.5. Financial Details
8.1.3.6. Others
8.1.4.Nova Nutritional Supplies (M) Sdn Bhd
8.1.4.1. Business Description
8.1.4.2. Product Portfolio
8.1.4.3. Collaborations & Alliances
8.1.4.4. Recent Developments
8.1.4.5. Financial Details
8.1.4.6. Others
8.1.5.Vitaco Health NZ Ltd
8.1.5.1. Business Description
8.1.5.2. Product Portfolio
8.1.5.3. Collaborations & Alliances
8.1.5.4. Recent Developments
8.1.5.5. Financial Details
8.1.5.6. Others
8.1.6.Company 6
8.1.6.1. Business Description
8.1.6.2. Product Portfolio
8.1.6.3. Collaborations & Alliances
8.1.6.4. Recent Developments
8.1.6.5. Financial Details
8.1.6.6. Others
8.1.7.Company 7
8.1.7.1. Business Description
8.1.7.2. Product Portfolio
8.1.7.3. Collaborations & Alliances
8.1.7.4. Recent Developments
8.1.7.5. Financial Details
8.1.7.6. Others
8.1.8.Company 8
8.1.8.1. Business Description
8.1.8.2. Product Portfolio
8.1.8.3. Collaborations & Alliances
8.1.8.4. Recent Developments
8.1.8.5. Financial Details
8.1.8.6. Others
8.1.9.Company 9
8.1.9.1. Business Description
8.1.9.2. Product Portfolio
8.1.9.3. Collaborations & Alliances
8.1.9.4. Recent Developments
8.1.9.5. Financial Details
8.1.9.6. Others
8.1.10. Company 10
8.1.10.1. Business Description
8.1.10.2. Product Portfolio
8.1.10.3. Collaborations & Alliances
8.1.10.4. Recent Developments
8.1.10.5. Financial Details
8.1.10.6. Others
9. Disclaimer
| Segment | Sub-Segment |
|---|---|
| By Product Type |
|
| By Sales Channel |
|
| By Ingredients |
|
| By Functionality |
|
| By End User |
|
Research Methodology
This study followed a structured approach comprising four key phases to assess the size and scope of the electro-oxidation market. The process began with thorough secondary research to collect data on the target market, related markets, and broader industry context. These findings, along with preliminary assumptions and estimates, were then validated through extensive primary research involving industry experts from across the value chain. To calculate the overall market size, both top-down and bottom-up methodologies were employed. Finally, market segmentation and data triangulation techniques were applied to refine and validate segment-level estimations.
Secondary Research
The secondary research phase involved gathering data from a wide range of credible and published sources. This step helped in identifying industry trends, defining market segmentation, and understanding the market landscape and value chain.
Sources consulted during this phase included:
- Company annual reports, investor presentations, and press releases
- Industry white papers and certified publications
- Trade directories and market-recognized databases
- Articles from authoritative authors and reputable journals
- Gold and silver standard websites
Secondary research was critical in mapping out the industry's value chain and monetary flow, identifying key market segments, understanding regional variations, and tracking significant industry developments.
Other key sources:
- Financial disclosures
- Industry associations and trade bodies
- News outlets and business magazines
- Academic journals and research studies
- Paid industry databases
Primary Research
To validate secondary data and gain deeper market insights, primary research was conducted with key stakeholders across both the supply and demand sides of the market.
On the demand side, participants included decision-makers and influencers from end-user industries—such as CIOs, CTOs, and CSOs—who provided first-hand perspectives on market needs, product usage, and future expectations.
On the supply side, interviews were conducted with manufacturers, industry associations, and institutional participants to gather insights into current offerings, product pipelines, and market challenges.
Primary interviews provided critical inputs such as:
- Market size and revenue data
- Product and service breakdowns
- Market forecasts
- Regional and application-specific trends
Stakeholders consulted included:
- Leading OEM and solution providers
- Channel and distribution partners
- End users across various applications
- Independent consultants and industry specialists
Market Size Estimation and Data Triangulation
- Identifying Key Market Participants (Secondary Research)
- Goal: To identify the major players or companies in the target market. This typically involves using publicly available data sources such as industry reports, market research publications, and financial statements of companies.
- Tools: Reports from firms like Gartner, Forrester, Euromonitor, Statista, IBISWorld, and others. Public financial statements, news articles, and press releases from top market players.
- Extracting Earnings of Key Market Participants
- Goal: To estimate the earnings generated from the product or service being analyzed. This step helps in understanding the revenue potential of each market player in a specific geography.
- Methods: Earnings data can be gathered from:
- Publicly available financial reports (for listed companies).
- Interviews and primary data sources from professionals, such as Directors, VPs, SVPs, etc. This is especially useful for understanding more nuanced, internal data that isn't publicly disclosed.
- Annual reports and investor presentations of key players.
- Data Collation and Development of a Relevant Data Model
- Goal: To collate inputs from both primary and secondary sources into a structured, data-driven model for market estimation. This model will incorporate key market KPIs and any independent variables relevant to the market.
- Key KPIs: These could include:
- Market size, growth rate, and demand drivers.
- Industry-specific metrics like market share, average revenue per customer (ARPC), or average deal size.
- External variables, such as economic growth rates, inflation rates, or commodity prices, that could affect the market.
- Data Modeling: Based on this data, the market forecasts are developed for the next 5 years. A combination of trend analysis, scenario modeling, and statistical regression might be used to generate projections.
- Scenario Analysis
- Goal: To test different assumptions and validate how sensitive the market is to changes in key variables (e.g., market demand, regulatory changes, technological disruptions).
- Types of Scenarios:
- Base Case: Based on current assumptions and historical data.
- Best-Case Scenario: Assuming favorable market conditions, regulatory environments, and technological advancements.
- Worst-Case Scenario: Accounting for adverse factors, such as economic downturns, stricter regulations, or unexpected disruptions.


