India Honey Market Report: Trends, Growth and Forecast (2026-2032)
By Product Type (Table Honey/Consumer Honey, Industrial Honey/Ingredient Honey), By Nature (Organic, Conventional), By Source Type (Monofloral (Acacia Honey, Clover Honey, Manuka Honey, Others), Multifloral), By Processing Type (Raw, Filtered, Pasteurized, Ultra-filtered), By Form (Liquid, Creamed/Whipped, Comb, Crystallized/Granulated, Powdered), By Application (Food & Beverages, Pharmaceuticals, Nutraceuticals/Dietary Supplements, Personal Care & Cosmetics, Foodservice), By Distribution Channel (Retail Offline (Supermarkets/Hypermarkets, Convenience Stores, Specialty Stores, Pharmacies/Health Stores), Retail Online (E-commerce Platforms, Direct-to-Consumer)), By Packaging Type (Glass Jars, Plastic Bottles/Squeeze Bottles, Tubs, Sachets/Single-Serve Packs, Bulk Drums/Containers), By End User (Household Consumers, Food Manufacturers, Beverage Manufacturers, Pharmaceutical Companies, Cosmetic & Personal Care Companies, Foodservice Operators), By By Region (North, East, West, South) ... Read more
|
Major Players
|
India Honey Market Statistics and Insights, 2026
- Market Size Statistics
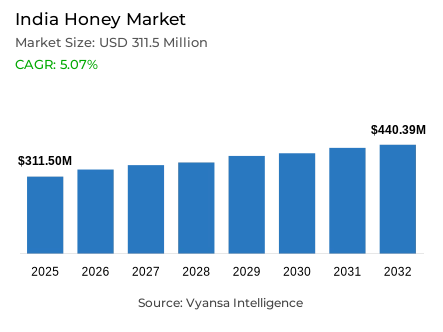
- Honey market size in India was valued at USD 311.5 million in 2025 and is estimated at USD 332.98 million in 2026.
- The market size is expected to grow to USD 440.39 million by 2032.
- Market to register a CAGR of around 5.07% during 2026-32.
- Product Type Shares
- Table honey/consumer honey grabbed market share of 65%.
- Competition
- More than 10 companies are actively engaged in producing honey in India.
- Top 5 companies acquired around 30% of the market share.
- Hitkary, Nature’s Nectar (Kejriwal Bee Care India Pvt. Ltd.), Organic India, Dabur India, Patanjali Ayurved etc., are few of the top companies.
- Packaging Type
- Plastic bottles/squeeze bottles grabbed 52% of the market.
India Honey Market Outlook
India honey market is estimated to have a value of USD 311.5 million in 2025 and is expected to increase to USD 332.98 million in 2026 and USD 440.39 million in 2032 with a CAGR of 5.07%. This continued growth is indicative of a structural repositioning of the domestic honey economy through the formalization of beekeeping ecosystems, the intensification of export capacity, and a rapid shift in end user orientation towards natural sweeteners and food products with wellness-integrated components. The market is moving out of a fragmented commodity category to a quality-based, policy-backed commercial area with multi-decade demand tailwinds that compensate investment in traceability, certification, and supply chain discipline.
The infrastructural logic that supports this growth path is not only intentional but also quantifiable. By March 2025, the National Beekeeping and honey Mission will have a total outlay of USD 53.99 million approved by sanctioning 6 world-class honey testing laboratories, 47 mini honey testing labs, 26 dedicated processing units, and 10 packaging and cold-storage facilities. This systematic investment in post-harvest infrastructure elevates the quality consistency of Indian honey directly enabling certified, traceable supply flows that serve both domestic retail channels and high-value export corridors. Testing and processing infrastructure investment is not only a compliance tool but a structural competitive differentiator that gradually expands the addressable premium market of Indian honey producers and exporters.
End user demand behavior reinforces the market's structural depth and commercial breadth. Table honey and consumer honey collectively account for approximately 65% of total market volume, confirming that household penetration rather than industrial or institutional demand constitutes the primary engine of category value creation. Simultaneously, export momentum validates Indian honey's strengthening international commercial standing APEDA data confirms exports of 100,773.14 MT valued at USD 206.47 million in FY 2024-25, with demand anchored across the USA, UAE, Saudi Arabia, Portugal, and Libya. India's designation as the second-largest global honey exporter in marketing year 2024 signals a foundational shift in its supply chain participation from volume-led commodity export toward credibility-led, quality-differentiated international trade.
The regulatory and competitive forward view presents a market undergoing disciplined consolidation around quality compliance, pricing integrity, and formal supply chain registration. FSSAI's enforcement of an 80 mg/kg Hydroxymethylfurfural ceiling with samples exceeding this threshold reclassified as substandard effective November 2025 raises the compliance threshold for all domestic producers and creates a quality stratification dynamic that rewards investment in process consistency. APEDA's extension of the Minimum Export Price mechanism through Notification 52/2025-26 reinforces pricing discipline across export channels. The Madhukranti portal, registering 14,859 beekeepers, 269 societies, 150 firms, and 206 companies by October 2025, signals a competitive landscape where traceability and formal registration increasingly determine market access and buyer confidence through 2032.

India Honey Market Growth DriverGovernment Initiatives Supporting Beekeeping Infrastructure and Honey Production Capacity
Government-led investment in scientific beekeeping and honey production infrastructure catalyzes market acceleration across the full value chain. Formalised production ecosystems, certified testing frameworks, and post-harvest facility networks collectively reinforce the supply capacity required to sustain demand growth. This policy architecture does not merely support expansion it de-risks the commercial environment for processors, brand owners, and large-format retailers seeking quality-assured procurement channels. Institutional confidence in supply consistency translates directly into enhanced shelf penetration and repeat purchasing behavior across consumer segments.
India's production base of approximately 1.4 lakh metric tonnes of natural honey in 2024, complemented by the National Beekeeping and honey Mission's USD 53.99 million outlay, operationalises this driver at measurable scale. The sanctioning of 6 world-class testing laboratories and 47 mini honey testing labs by March 2025 establishes a tiered quality-assurance infrastructure that benefits upstream producers and downstream brands equally. Cold-storage and packaging unit additions further reduce post-harvest attrition, enabling higher-value product flows and underpinning sustained output growth through 2032.
India Honey Market ChallengeStringent Quality Compliance Standards Elevating Operational Costs for Market Participants
The progressive formalisation of the honey sector introduces a compounding operational challenge the rising cost and complexity of quality compliance. As testing standards tighten and classification criteria sharpen, producers and processors face intensified pressure to maintain batch-level consistency, secure certified laboratory access, and navigate evolving regulatory frameworks. Smaller and mid-scale operators face disproportionate exposure to this compliance burden, as standardisation investments are capital-intensive and technical capacity remains unevenly distributed across the market.
FSSAI's active enforcement of the 80 mg/kg HMF limit with non-compliant samples classified as Substandard as of November 2025 raises the regulatory bar with tangible commercial consequences including product rejection, export delisting, and reputational exposure. APEDA's extension of the Minimum Export Price mechanism through Notification 52/2025-26 simultaneously constrains margin flexibility for lower-value exporters. Together, these measures compress the operating space for players that lack integrated testing, traceability, and quality management systems a structural dynamic that will accelerate market consolidation through 2032.
Unlock Market Intelligence
Explore the market potential with our data-driven report
India Honey Market TrendGrowing Adoption of Digital Traceability Systems Across Honey Supply Chains
A decisive structural trend reshaping the India honey market is the systemic transition from informal, opaque supply chains to digitally traceable, formally registered ecosystems. Traceability is no longer a discretionary quality enhancement it is rapidly becoming a baseline requirement for domestic retail listing, institutional procurement, and export certification. This shift reconfigures buyer-supplier dynamics traceability credentials now function as a primary commercial signal, determining access to premium-tier buyers and international trade corridors.
The Madhukranti portal launched for the online registration and traceability of honey and bee product origins records 14,859 beekeepers, 269 beekeeping and honey societies, 150 firms, and 206 companies by 14 October 2025. The scale and pace of this adoption demonstrate that platform-led traceability has moved beyond pilot-stage enrollment into mainstream market practice. For brand owners and processors, participation in this ecosystem provides a verifiable provenance narrative that supports premium positioning and export credibility through 2032.
India Honey Market OpportunityRising Export Demand Creating Premiumisation Avenues for Indian Honey Producers
The convergence of India's global supply standing and rising international demand for traceable, differentiated honey creates a high-conviction opportunity for premiumisation across both export and domestic retail channels. Indian honey producers and processors are positioned to migrate from bulk commodity supply toward value-added product architecture encompassing single-origin floral varieties, certified organic formats, premium packaging, and branded provenance narratives. This migration directly addresses the margin compression inherent in volume-led trade, replacing it with a value-creation logic aligned with international consumer preferences for authenticity and natural wellness credentials.
APEDA trade data confirms exports of 100,773.14 MT valued at USD 206.47 million in FY 2024-25, with market concentration in the USA, UAE, Saudi Arabia, Portugal, and Libya. India's recognition as the second-largest global honey exporter in marketing year 2024 establishes the reputational foundation required to command price premiums in discerning international markets. Processors that invest in differentiation through origin certification, varietal specialisation, or premium-format packaging are positioned to capture outsized revenue upside through 2032.
Unlock Market Intelligence
Explore the market potential with our data-driven report
India Honey Market Segmentation Analysis
By Product Type
- Table Honey/Consumer Honey
- Industrial Honey/Ingredient Honey
The largest market share segment under the Product Type is Table honey/Consumer honey, which has a market share of about 65% of the total market. This leadership role indicates how the category has become deeply ingrained into the daily household consumption habits, where honey serves as a natural sweetener, a wellness-associated dietary supplement, and a pantry item with multi-generational purchase recognition. The commercial strength of the segment is based on the wide-spectrum applicability in terms of income levels, age groups, and geographical markets, which generates a structurally strong demand base that maintains volume during economic cycles.
The habitual repurchase consumer psychology also strengthens the dominance of the segment. Table honey is in a low-friction position in the household purchasing behavior it does not necessitate any behavioral change, is consistent with existing dietary habits, and enjoys a high point-of-sale presence in mass retail formats. In contrast to industrial or foodservice-oriented honey applications subject to B2B procurement cycles, ingredient substitution risk, and category specification constraints consumer honey's demand is self-renewing in its behavioral economics. This discretionary demand volatility structural insulation places the segment to maintain its dominant share until 2032.

By Packaging Type
- Glass Jars
- Plastic Bottles/Squeeze Bottles
- Tubs
- Sachets/Single-Serve Packs
- Bulk Drums/Containers
The segment with highest market share under the Packaging Type is Plastic Bottles/Squeeze Bottles with the market share of about 52% of the total market. The commercial leadership of this format is based on functional ergonomics which is compatible with the everyday household use squeeze bottles provide high levels of dispensing control, limit the amount of products wasted and limit mess in high-frequency use which both primary grocery purchasers and convenience-oriented retail channels find highly appealing. This is further cemented by their fit to mass retail shelf architecture, and mainstream distribution logistics, making them the default packaging format in volume-led market segments.
In addition to the utility, plastic and squeeze bottle designs have a strong underlying message of affordability ingrained in the consumer psyche. The familiarity with the mass market among their target customers minimizes the purchase friction of first-time and repeat customers, and the distribution economics of low breakage risk, light weight, and high density on the shelf is better than glass or rigid products. With honey cementing its position as a regular household commodity, convenient, repeatable, value-perception packaging formats naturally perpetuate their structural benefit to 2032.
List of Companies Covered in India Honey Market
The companies listed below are highly influential in the India honey market, with a significant market share and a strong impact on industry developments.
- Hitkary
- Nature’s Nectar (Kejriwal Bee Care India Pvt. Ltd.)
- Organic India
- Dabur India
- Patanjali Ayurved
- Apis India
- Baidyanath
- Beez International
- Saffola
- Zandu Care
Market News & Updates
- Organic India, 2025:
Organic India’s official site featured Brahmi Honey under its new-launch collection in late 2025, combining organic multi-floral honey with Brahmi for focus, alertness, and mental wellness support. This is a relevant India honey-market development because it moves honey further into the herbal-functional segment, blending conventional consumer honey with wellness-led positioning and ingredient innovation.
- Apis India, 2025:
Apis India’s official honey pages in 2025 highlighted a broadened value-added honey range including Bee Fit, Tulsi, Lemon, Ginger, Lychee, and Sitopladi variants. This matters for the India honey market because it shows clear product innovation beyond plain table honey, with functional and infused formats aimed at fitness, immunity, taste variety, and health-oriented daily consumption.
Frequently Asked Questions
Related Report
- Market Segmentation
- Research Scope
- Research Methodology
- Definitions and Assumptions
- Executive Summary
- India Honey Market Policies, Regulations, and Standards
- India Honey Market Dynamics
- Growth Factors
- Challenges
- Trends
- Opportunities
- India Honey Market Statistics, 2022-2032F
- Market Size & Growth Outlook
- By Revenues in USD Million
- Market Segmentation & Growth Outlook
- By Product Type
- Table Honey/Consumer Honey- Market Insights and Forecast 2022-2032, USD Million
- Industrial Honey/Ingredient Honey- Market Insights and Forecast 2022-2032, USD Million
- By Nature
- Organic- Market Insights and Forecast 2022-2032, USD Million
- Conventional- Market Insights and Forecast 2022-2032, USD Million
- By Source Type
- Monofloral- Market Insights and Forecast 2022-2032, USD Million
- Acacia Honey- Market Insights and Forecast 2022-2032, USD Million
- Clover Honey- Market Insights and Forecast 2022-2032, USD Million
- Manuka Honey- Market Insights and Forecast 2022-2032, USD Million
- Others- Market Insights and Forecast 2022-2032, USD Million
- Multifloral- Market Insights and Forecast 2022-2032, USD Million
- Monofloral- Market Insights and Forecast 2022-2032, USD Million
- By Processing Type
- Raw- Market Insights and Forecast 2022-2032, USD Million
- Filtered- Market Insights and Forecast 2022-2032, USD Million
- Pasteurized- Market Insights and Forecast 2022-2032, USD Million
- Ultra-filtered- Market Insights and Forecast 2022-2032, USD Million
- By Form
- Liquid- Market Insights and Forecast 2022-2032, USD Million
- Creamed/Whipped- Market Insights and Forecast 2022-2032, USD Million
- Comb- Market Insights and Forecast 2022-2032, USD Million
- Crystallized/Granulated- Market Insights and Forecast 2022-2032, USD Million
- Powdered- Market Insights and Forecast 2022-2032, USD Million
- By Application
- Food & Beverages- Market Insights and Forecast 2022-2032, USD Million
- Pharmaceuticals- Market Insights and Forecast 2022-2032, USD Million
- Nutraceuticals/Dietary Supplements- Market Insights and Forecast 2022-2032, USD Million
- Personal Care & Cosmetics- Market Insights and Forecast 2022-2032, USD Million
- Foodservice- Market Insights and Forecast 2022-2032, USD Million
- By Distribution Channel
- Retail Offline- Market Insights and Forecast 2022-2032, USD Million
- Supermarkets/Hypermarkets- Market Insights and Forecast 2022-2032, USD Million
- Convenience Stores- Market Insights and Forecast 2022-2032, USD Million
- Specialty Stores- Market Insights and Forecast 2022-2032, USD Million
- Pharmacies/Health Stores- Market Insights and Forecast 2022-2032, USD Million
- Retail Online- Market Insights and Forecast 2022-2032, USD Million
- E-commerce Platforms- Market Insights and Forecast 2022-2032, USD Million
- Direct-to-Consumer- Market Insights and Forecast 2022-2032, USD Million
- Retail Offline- Market Insights and Forecast 2022-2032, USD Million
- By Packaging Type
- Glass Jars- Market Insights and Forecast 2022-2032, USD Million
- Plastic Bottles/Squeeze Bottles- Market Insights and Forecast 2022-2032, USD Million
- Tubs- Market Insights and Forecast 2022-2032, USD Million
- Sachets/Single-Serve Packs- Market Insights and Forecast 2022-2032, USD Million
- Bulk Drums/Containers- Market Insights and Forecast 2022-2032, USD Million
- By End User
- Household Consumers- Market Insights and Forecast 2022-2032, USD Million
- Food Manufacturers- Market Insights and Forecast 2022-2032, USD Million
- Beverage Manufacturers- Market Insights and Forecast 2022-2032, USD Million
- Pharmaceutical Companies- Market Insights and Forecast 2022-2032, USD Million
- Cosmetic & Personal Care Companies- Market Insights and Forecast 2022-2032, USD Million
- Foodservice Operators- Market Insights and Forecast 2022-2032, USD Million
- By Region
- North
- East
- West
- South
- By Competitors
- Competition Characteristics
- Market Share & Analysis
- By Product Type
- Market Size & Growth Outlook
- India Table Honey/Consumer Honey Market Statistics, 2022-2032
- Market Size & Growth Outlook
- By Revenues in USD Million
- Market Segmentation & Growth Outlook
- By Nature- Market Insights and Forecast 2022-2032, USD Million
- By Source Type- Market Insights and Forecast 2022-2032, USD Million
- By Processing Type- Market Insights and Forecast 2022-2032, USD Million
- By Form- Market Insights and Forecast 2022-2032, USD Million
- By Application- Market Insights and Forecast 2022-2032, USD Million
- By Distribution Channel- Market Insights and Forecast 2022-2032, USD Million
- By Packaging Type- Market Insights and Forecast 2022-2032, USD Million
- By End User- Market Insights and Forecast 2022-2032, USD Million
- By Region- Market Insights and Forecast 2022-2032, USD Million
- Market Size & Growth Outlook
- India Industrial Honey/Ingredient Honey Market Statistics, 2022-2032
- Market Size & Growth Outlook
- By Revenues in USD Million
- Market Segmentation & Growth Outlook
- By Nature- Market Insights and Forecast 2022-2032, USD Million
- By Source Type- Market Insights and Forecast 2022-2032, USD Million
- By Processing Type- Market Insights and Forecast 2022-2032, USD Million
- By Form- Market Insights and Forecast 2022-2032, USD Million
- By Application- Market Insights and Forecast 2022-2032, USD Million
- By Distribution Channel- Market Insights and Forecast 2022-2032, USD Million
- By Packaging Type- Market Insights and Forecast 2022-2032, USD Million
- By End User- Market Insights and Forecast 2022-2032, USD Million
- By Region- Market Insights and Forecast 2022-2032, USD Million
- Market Size & Growth Outlook
- Competitive Outlook
- Company Profiles
- Dabur India
- Business Description
- Product Portfolio
- Collaborations & Alliances
- Recent Developments
- Financial Details
- Others
- Patanjali Ayurved
- Business Description
- Product Portfolio
- Collaborations & Alliances
- Recent Developments
- Financial Details
- Others
- Apis India
- Business Description
- Product Portfolio
- Collaborations & Alliances
- Recent Developments
- Financial Details
- Others
- Baidyanath
- Business Description
- Product Portfolio
- Collaborations & Alliances
- Recent Developments
- Financial Details
- Others
- Beez International
- Business Description
- Product Portfolio
- Collaborations & Alliances
- Recent Developments
- Financial Details
- Others
- Hitkary
- Business Description
- Product Portfolio
- Collaborations & Alliances
- Recent Developments
- Financial Details
- Others
- Nature’s Nectar (Kejriwal Bee Care India Pvt. Ltd.)
- Business Description
- Product Portfolio
- Collaborations & Alliances
- Recent Developments
- Financial Details
- Others
- Organic India
- Business Description
- Product Portfolio
- Collaborations & Alliances
- Recent Developments
- Financial Details
- Others
- Saffola
- Business Description
- Product Portfolio
- Collaborations & Alliances
- Recent Developments
- Financial Details
- Others
- Zandu Care
- Business Description
- Product Portfolio
- Collaborations & Alliances
- Recent Developments
- Financial Details
- Others
- Dabur India
- Company Profiles
- Disclaimer
| Segment | Sub-Segment |
|---|---|
| By Product Type |
|
| By Nature |
|
| By Source Type |
|
| By Processing Type |
|
| By Form |
|
| By Application |
|
| By Distribution Channel |
|
| By Packaging Type |
|
| By End User |
|
| By Region |
|
Research Methodology
This study followed a structured approach comprising four key phases to assess the size and scope of the electro-oxidation market. The process began with thorough secondary research to collect data on the target market, related markets, and broader industry context. These findings, along with preliminary assumptions and estimates, were then validated through extensive primary research involving industry experts from across the value chain. To calculate the overall market size, both top-down and bottom-up methodologies were employed. Finally, market segmentation and data triangulation techniques were applied to refine and validate segment-level estimations.
Secondary Research
The secondary research phase involved gathering data from a wide range of credible and published sources. This step helped in identifying industry trends, defining market segmentation, and understanding the market landscape and value chain.
Sources consulted during this phase included:
- Company annual reports, investor presentations, and press releases
- Industry white papers and certified publications
- Trade directories and market-recognized databases
- Articles from authoritative authors and reputable journals
- Gold and silver standard websites
Secondary research was critical in mapping out the industry's value chain and monetary flow, identifying key market segments, understanding regional variations, and tracking significant industry developments.
Other key sources:
- Financial disclosures
- Industry associations and trade bodies
- News outlets and business magazines
- Academic journals and research studies
- Paid industry databases
Primary Research
To validate secondary data and gain deeper market insights, primary research was conducted with key stakeholders across both the supply and demand sides of the market.
On the demand side, participants included decision-makers and influencers from end-user industries—such as CIOs, CTOs, and CSOs—who provided first-hand perspectives on market needs, product usage, and future expectations.
On the supply side, interviews were conducted with manufacturers, industry associations, and institutional participants to gather insights into current offerings, product pipelines, and market challenges.
Primary interviews provided critical inputs such as:
- Market size and revenue data
- Product and service breakdowns
- Market forecasts
- Regional and application-specific trends
Stakeholders consulted included:
- Leading OEM and solution providers
- Channel and distribution partners
- End users across various applications
- Independent consultants and industry specialists
Market Size Estimation and Data Triangulation
- Identifying Key Market Participants (Secondary Research)
- Goal: To identify the major players or companies in the target market. This typically involves using publicly available data sources such as industry reports, market research publications, and financial statements of companies.
- Tools: Reports from firms like Gartner, Forrester, Euromonitor, Statista, IBISWorld, and others. Public financial statements, news articles, and press releases from top market players.
- Extracting Earnings of Key Market Participants
- Goal: To estimate the earnings generated from the product or service being analyzed. This step helps in understanding the revenue potential of each market player in a specific geography.
- Methods: Earnings data can be gathered from:
- Publicly available financial reports (for listed companies).
- Interviews and primary data sources from professionals, such as Directors, VPs, SVPs, etc. This is especially useful for understanding more nuanced, internal data that isn't publicly disclosed.
- Annual reports and investor presentations of key players.
- Data Collation and Development of a Relevant Data Model
- Goal: To collate inputs from both primary and secondary sources into a structured, data-driven model for market estimation. This model will incorporate key market KPIs and any independent variables relevant to the market.
- Key KPIs: These could include:
- Market size, growth rate, and demand drivers.
- Industry-specific metrics like market share, average revenue per customer (ARPC), or average deal size.
- External variables, such as economic growth rates, inflation rates, or commodity prices, that could affect the market.
- Data Modeling: Based on this data, the market forecasts are developed for the next 5 years. A combination of trend analysis, scenario modeling, and statistical regression might be used to generate projections.
- Scenario Analysis
- Goal: To test different assumptions and validate how sensitive the market is to changes in key variables (e.g., market demand, regulatory changes, technological disruptions).
- Types of Scenarios:
- Base Case: Based on current assumptions and historical data.
- Best-Case Scenario: Assuming favorable market conditions, regulatory environments, and technological advancements.
- Worst-Case Scenario: Accounting for adverse factors, such as economic downturns, stricter regulations, or unexpected disruptions.


