Global Sulfuric Acid Market Report: Trends, Growth and Forecast (2026-2032)
By Grade (Technical Grade, Chemically Pure Grade, Battery Grade), By Application (Fertilizers, Chemical Manufacturing, Petroleum Refining, Metal Processing, Batteries, Automotive, Pulp & Paper, Textile, Others), By Raw Material Type (Elemental Sulfur, Base Metal Smelters, Pyrite Ore, Others), By Production Process (Single Contact Process, Double Contact Double Absorption (DCDA) Process), By Concentration (Standard (93-98 wt%), Oleum / Fuming Acid), By Form Type (Concentrated Sulfuric Acid, Tower/Glover Acid, Chamber/Fertilizer Acid, Battery Acid, 66° Baume Sulfuric Acid, Dilute Sulfuric Acid), By Region (North America, South America, Europe, Middle East & Africa, Asia Pacific) ... Read more
|
Major Players
|
Global Sulfuric Acid Market Statistics and Insights, 2026
- Market Size Statistics
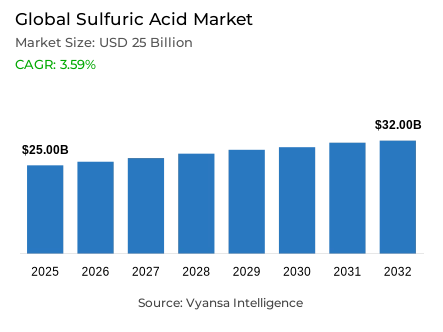
- Global sulfuric acid market is estimated at USD 25 billion in 2025.
- The market size is expected to grow to USD 32 billion by 2032.
- Market to register a CAGR of around 3.59% during 2026-32.
- Grade Shares
- Technical grade grabbed market share of 80%.
- Competition
- More than 25 companies are actively engaged in producing sulfuric acid.
- Top 5 companies acquired around 40% of the market share.
- BASF SE; Jiangxi Copper Corporation; Korea Zinc; PhosAgro Group; Mosaic Company etc., are few of the top companies.
- Application
- Fertilizers grabbed 50% of the market.
- Region
- Asia Pacific leads with a 45% share of the global market.
Global Sulfuric Acid Market Outlook
The global sulfuric acid industry is expected to grow at a steady rate as a result of the growth of the agricultural sector and increased consumption of phosphate fertilizers. In 2025, the global sulfuric acid market will be $25 billion, growing to $32 billion by 2032. This figure reflects an average annual growth rate of approximately 3.59% from 2026 to 2032. Sulfuric acid remains essential in productive phosphoric acid (the primary component of phosphate fertilizers) and will produce a total of 89.6 million metric tons in 2024, while the production of monoammonium phosphate (MAP) and diammonium phosphate (DAP) will be combined at a total of 67.2 million metric tons. Continued expansion of agricultural operations in Asia, Africa, and West Asia combined with improving agricultural productivity through modernization efforts is expected to continue driving demand for sulfuric acid in the production of fertilizers and into the industrial sectors over the long term.
Supply constraints on sulfuric acid production will continue to affect the dynamics of the sulfuric acid market; therefore, the current concentration of global sulfur production coupled with the energy-intensive processes involved in producing sulfur means that supply disruptions are highly probable. The leading producers of sulfur globally are the United States, China, and Russia, with regional concentrations susceptible to changes in supply due to geopolitical and climate-based events. Additionally, there are two key links between sulfuric acid production and the hydrocarbon markets, as sulfur is derived from petroleum refinery sulfur recovery and as a byproduct from metallurgical processes. These supply constraints underscore the importance of stable availability of technical-grade sulfuric acid since it currently represents 80% of the market and plays an important role as an input in the production of fertilizers and for industrial applications.
Improvements in technology, including the automation of production processes, are assisting producers in optimizing production output while simultaneously improving product quality. Producers in North Africa, West Asia, and elsewhere are increasing their capacity for production by integrating with phosphate rock processing and upgrading their facilities through modernization. Investments in equipment and automation are resulting in more economical production and less complex logistics and more sustainable production practices. Industrial customers continue to use technical-grade sulfuric acid for reasons of cost, reliability, and compatibility with large quantity fertilizer production, thereby solidifying this segment's position as the leading market for sulfuric acid.
In terms of market share by region, Asia Pacific is by far the largest, making up approximately 45% of the worldwide sulfuric acid market due to the high levels of phosphate fertilizer production in China and India. Nearly 50% of the global consumption of sulfuric acid is for the production of fertilizers, illustrating the dominance of fertilizer use for sulfuric acid. Continued expansions of agricultural economies in South Asia, Africa, and West Asia will create opportunities for localized production and supply partnerships. Overall, the sulfuric acid market is projected to continue its moderate rate of growth due to an ever-increasing presence of agricultural demand, industries relying on technical-grade sulfuric acid, and strategic regional expansion of the industry.

Global Sulfuric Acid Market Growth Driver
Expansion in Fertilizer Production Propels Sulfuric Acid Demand
The continous rise in the agricultural sector of the economy, sulfuric acid remains in high global demand. Sulfuric acid can manufacture phosphoric acid, which is then used to make fertilizers. The agricultural production and protection methods, as well as for producing fertilizers through phosphate rock digestion, the continuous need for sulfuric acid will continue to support the current and future steady-state utilization and consumption patterns.
Modernization of agriculture has resulted in an increase in the demand for chemical inputs, fertilizers. Phosphoric acid production capacity is expected by the International Fertilizer Association (IFA) to increase by more than 14% by 2029, to approximately 71.7 million metric tons of P₂O₅. This increased capacity will require increased quantities of sulfuric acid during processing of phosphate rock to produce acid products through acid leaching methods. Developing countries will significantly contribute to the continued short-term consumption of sulfuric acid as the agriculture industry continues expanding rapidly due to increasing food security concerns. A growing agriculture segment will rank among the primary users of sulfuric acid in industrial chemical production.
Global Sulfuric Acid Market Challenge
Supply Chain Concentration and Production Limitations Restrict Market Stability
Globally, there are fewer and fewer sources of sulfur available. This means that because of more centralized sources of sulfur and increased costs associated with producing sulfuric acid, world production of sulfur is projected to be about 82 million metric tons in 2023. Agricultural demand will further stress the industry's capability to produce sulfur.In Louisiana and Texas, 8.6 Million Metric tons of sulfur were produced with 52% of the total being sourced from these regions therefore making them susceptible to regional disruption, as they are highly dependent on the cycle of the Petroleum Refinery and metallurgical by-product recovery, which will increase the degree of volatility.
International trade also increases the market concentration risk of sulfur; 3 countries, China, Russia, and USA, make up approximately $13 Billion Worth of sulfuric acid exports annually. As such, operational interruptions in these key production areas create potential bottlenecks. In addition, closures of non-ferrous metallurgy smelters impact the availability of by-products, while concentration on sulfur production within regions further exposes the supply chain to vulnerabilities and thus increases the need for fertilizer manufacturers to continually produce sufficient quantities of Technical Grade Sulfuric Acid. Without the reliable access to feed stocks, the total volume of phosphoric acid and phosphate fertilizer produced globally would not be sustainable.
Unlock Market Intelligence
Explore the market potential with our data-driven report
Global Sulfuric Acid Market Trend
Process Modernization and Automation Enhance Production Efficiency
In order to increase their output of sulfuric acid, industrial operators are increasingly focused on efficient operation and automation of their facilities. For instance, PhosAgro's Cherepovets Facility achieved an increase of 3.2% in output through enhanced processes. Balakovo's Facility expanded capacity due to extensive renovations completed in the first half of 2024. Advanced equipment and automation now allows producers to improve output yields from existing production plants. In regions such as North Africa and West Asia where the demand for phosphate fertilizers is growing, the need for additional sulfuric acid capacity is driving investments to increase the capacity of sulfuric acid production.
Improved process technology in sulfur recovery and purification processes has improved substance quality and production cost efficiencies. Furthermore, by incorporating phosphorus production with phosphate rock processing, the need for transporting phosphoric acid, which is a by-product of phosphate rock processing, has been virtually eliminated. The development of closed-loop recycling along with the utilization of recoverable waste heat from production processes have led to improved sustainability for producers of sulfuric acid, and the anticipated growth of phosphoric acid capacity of approximately 14% will lead to the continued development of both greenfield and brownfield sulfuric acid production facilities.
Global Sulfuric Acid Market Opportunity
Emerging Agricultural Economies Provide Market Expansion
The expanding agricultural economies of Asia and Africa will represent a significant opportunity for growth in the sulfuric acid market. The South Asian Region shows clearly the growing phosphoric acid market. Phosphorus consumption in the region is approximately 10.7 Million Metric tons, while nitrogen consumption was approximately 27 Million Metric tons. In 2024, China's phosphoric acid production increased 11% over 2023, whereas Morocco's production enjoyed a similar increase at 4%. Both countries have continued to invest in fertilizer infrastructure, and thus their production of phosphoric acid will continue to increase, leading to increased local consumption of sulfuric acid.
Africa, especially West Africa, represents a substantial opportunity for further expansion in the fertilizer market, as sulfuric acid continues to be highly demanded. Current forecasts of the phosphoric acid production capacity in these regions (West Asia, North Africa, South Asia, and especially India) will drive the worldwide growth of phosphoric acid between now and 2029. Thus, it will also create a need for partnerships in the form of joint ventures to either produce or supply sulfuric acid locally. The international exports of sulfuric acid for 2023 is estimated to be approximately $1.21 Billion. Currently, these exports are concentrated in four countries: Canada, Peru, Zambia, and Germany. Establishing local production capabilities in these emerging areas will reduce costs associated with logistics and reduce risks to the supply chains, while also taking advantage of the potential for margin growth in these developing regions. Therefore, they represent strategic targets for suppliers.
Global Sulfuric Acid Market Regional Analysis

By Region
- North America
- South America
- Europe
- Middle East & Africa
- Asia Pacific
Asia Pacific accounts for approximately 45% of the global sulfuric acid market, positioning the region as the primary production and consumption hub. China, as the world’s leading sulfur producer with 19 million metric tons annually, alongside emerging production capacity in India, Southeast Asia, and West Asia, drives the majority of regional demand. Phosphate fertilizer production growth, particularly in China and India, directly fuels sulfuric acid consumption for phosphoric acid manufacturing and other industrial processes.
Regional infrastructure and capacity expansion reinforce Asia Pacific’s market leadership. IFA forecasts phosphoric acid capacity growth through 2029 primarily across Africa, West Asia, and East Asia, with Asia-specific contributions from China and India. India’s agricultural sector, consuming 10.7 million metric tons of phosphorus and 27 million metric tons of nitrogen, alongside growing phosphate fertilizer production, sustains domestic sulfuric acid feedstock requirements. The combined presence of mature production centers and emerging manufacturing hubs in India, Indonesia, and Vietnam ensures Asia Pacific maintains dominance in global sulfuric acid production, consumption, and trade flows.
Unlock Market Intelligence
Explore the market potential with our data-driven report
Global Sulfuric Acid Market Segmentation Analysis
By Grade
- Technical Grade
- Chemically Pure Grade
- Battery Grade
Technical-grade sulfuric acid maintains a commanding presence in the global market, capturing 80% of total demand. This segment dominates due to its critical role in phosphate fertilizer production, where industrial-grade acid is essential for phosphoric acid extraction and phosphate rock digestion. The reliability, cost-effectiveness, and production consistency of technical-grade sulfuric acid align with the large-scale requirements of fertilizer manufacturers, reinforcing its market leadership over higher-purity pharmaceutical or semiconductor grades.
Industrial users prioritize feedstock availability and competitive pricing over ultra-high purity specifications, making technical-grade sulfuric acid the preferred input across agricultural, chemical, and metals processing applications. Phosphoric acid production reaching 89.6 million metric tons in 2024 underscores the scale of industrial reliance on technical-grade acid. This concentration demonstrates remarkable market stability, as industrial production processes are specifically engineered to accommodate technical-grade specifications, ensuring the segment’s sustained dominance within the global sulfuric acid market.

By Application
- Fertilizers
- Chemical Manufacturing
- Petroleum Refining
- Metal Processing
- Batteries
- Automotive
- Pulp & Paper
- Textile
- Others
Fertilizer manufacturing represents the largest application segment, accounting for 50% of global sulfuric acid consumption. This dominance stems from the acid’s integral role in phosphate rock digestion and acidulation processes for phosphoric acid production. The sector encompasses MAP/DAP manufacturing, superphosphate production, and integrated fertilizer complexes where sulfuric acid directly contributes to product synthesis.
Regional expansions in fertilizer output reinforce this application’s leadership. South Asia’s phosphorus consumption of 10.7 million metric tons, alongside China’s 11% growth in phosphate-based fertilizers in 2024, supports sustained industrial demand. The fertilizer application segment provides long-term demand visibility, underpinned by global agricultural requirements that remain structurally resilient to economic cycles. End users in fertilizer production rely on consistent sulfuric acid availability, positioning this segment as the primary demand anchor for the global sulfuric acid market.
Market Players in Global Sulfuric Acid Market
These market players maintain a significant presence in the Global sulfuric acid market sector and contribute to its ongoing evolution.
- BASF SE
- Jiangxi Copper Corporation
- Korea Zinc
- PhosAgro Group
- Mosaic Company
- OCP (Office Chérifien des Phosphates)
- China Petroleum & Chemical Corporation (Sinopec)
- Aurubis AG
- Chemtrade Logistics
- Ecovyst Inc. (Ecoservices)
- Nouryon
- Boliden Group
- LANXESS
- PVS Chemicals
- WeylChem International
Market News & Updates
- Ecovyst Inc., 2025:
Completed acquisition of Waggaman, Louisiana sulfuric acid production assets from Cornerstone Chemical Company.
- BASF SE, 2025:
Announced expansion of ultra-pure semiconductor-grade sulfuric acid production at Ludwigshafen, Germany, to meet growing European chip manufacturing demand, with operations expected by 2027.
Frequently Asked Questions
Related Report
1. Market Segmentation
1.1. Research Scope
1.2. Research Methodology
1.3. Definitions and Assumptions
2. Executive Summary
3. Global Sulfuric Acid Market Policies, Regulations, and Standards
4. Global Sulfuric Acid Market Dynamics
4.1. Growth Factors
4.2. Challenges
4.3. Trends
4.4. Opportunities
5. Global Sulfuric Acid Market Statistics, 2022-2032F
5.1. Market Size & Growth Outlook
5.1.1.By Revenues in USD Million
5.1.2.By Volume Thousand Tons
5.2. Market Segmentation & Growth Outlook
5.2.1.By Grade
5.2.1.1. Technical Grade- Market Insights and Forecast 2022-2032, USD Million
5.2.1.2. Chemically Pure Grade- Market Insights and Forecast 2022-2032, USD Million
5.2.1.3. Battery Grade- Market Insights and Forecast 2022-2032, USD Million
5.2.2.By Application
5.2.2.1. Fertilizers- Market Insights and Forecast 2022-2032, USD Million
5.2.2.2. Chemical Manufacturing- Market Insights and Forecast 2022-2032, USD Million
5.2.2.3. Petroleum Refining- Market Insights and Forecast 2022-2032, USD Million
5.2.2.4. Metal Processing- Market Insights and Forecast 2022-2032, USD Million
5.2.2.5. Batteries- Market Insights and Forecast 2022-2032, USD Million
5.2.2.6. Automotive- Market Insights and Forecast 2022-2032, USD Million
5.2.2.7. Pulp & Paper- Market Insights and Forecast 2022-2032, USD Million
5.2.2.8. Textile- Market Insights and Forecast 2022-2032, USD Million
5.2.2.9. Others- Market Insights and Forecast 2022-2032, USD Million
5.2.3.By Raw Material Type
5.2.3.1. Elemental Sulfur- Market Insights and Forecast 2022-2032, USD Million
5.2.3.2. Base Metal Smelters- Market Insights and Forecast 2022-2032, USD Million
5.2.3.3. Pyrite Ore- Market Insights and Forecast 2022-2032, USD Million
5.2.3.4. Others- Market Insights and Forecast 2022-2032, USD Million
5.2.4.By Production Process
5.2.4.1. Single Contact Process- Market Insights and Forecast 2022-2032, USD Million
5.2.4.2. Double Contact Double Absorption (DCDA) Process- Market Insights and Forecast 2022-2032, USD Million
5.2.5.By Concentration
5.2.5.1. Standard (93-98 wt%)- Market Insights and Forecast 2022-2032, USD Million
5.2.5.2. Oleum / Fuming Acid- Market Insights and Forecast 2022-2032, USD Million
5.2.6.By Form Type
5.2.6.1. Concentrated Sulfuric Acid- Market Insights and Forecast 2022-2032, USD Million
5.2.6.2. Tower/Glover Acid- Market Insights and Forecast 2022-2032, USD Million
5.2.6.3. Chamber/Fertilizer Acid- Market Insights and Forecast 2022-2032, USD Million
5.2.6.4. Battery Acid- Market Insights and Forecast 2022-2032, USD Million
5.2.6.5. 66° Baume Sulfuric Acid- Market Insights and Forecast 2022-2032, USD Million
5.2.6.6. Dilute Sulfuric Acid- Market Insights and Forecast 2022-2032, USD Million
5.2.7.By Region
5.2.7.1. North America
5.2.7.2. South America
5.2.7.3. Europe
5.2.7.4. Middle East & Africa
5.2.7.5. Asia Pacific
5.2.8.By Competitors
5.2.8.1. Competition Characteristics
5.2.8.2. Market Share & Analysis
6. North America Sulfuric Acid Market Statistics, 2022-2032F
6.1. Market Size & Growth Outlook
6.1.1.By Revenues in USD Million
6.1.2.By Volume Thousand Tons
6.2. Market Segmentation & Growth Outlook
6.2.1.By Grade- Market Insights and Forecast 2022-2032, USD Million
6.2.2.By Application- Market Insights and Forecast 2022-2032, USD Million
6.2.3.By Raw Material Type- Market Insights and Forecast 2022-2032, USD Million
6.2.4.By Production Process- Market Insights and Forecast 2022-2032, USD Million
6.2.5.By Concentration- Market Insights and Forecast 2022-2032, USD Million
6.2.6.By Form Type- Market Insights and Forecast 2022-2032, USD Million
6.2.7.By Country
6.2.7.1. US
6.2.7.2. Canada
6.2.7.3. Mexico
6.2.7.4. Rest of North America
6.3. US Sulfuric Acid Market Statistics, 2022-2032F
6.3.1.Market Size & Growth Outlook
6.3.1.1. By Revenues in USD Million
6.3.1.2. By Volume Thousand Tons
6.3.2.Market Segmentation & Growth Outlook
6.3.2.1. By Grade- Market Insights and Forecast 2022-2032, USD Million
6.3.2.2. By Application- Market Insights and Forecast 2022-2032, USD Million
6.4. Canada Sulfuric Acid Market Statistics, 2022-2032F
6.4.1.Market Size & Growth Outlook
6.4.1.1. By Revenues in USD Million
6.4.1.2. By Volume Thousand Tons
6.4.2.Market Segmentation & Growth Outlook
6.4.2.1. By Grade- Market Insights and Forecast 2022-2032, USD Million
6.4.2.2. By Application- Market Insights and Forecast 2022-2032, USD Million
6.5. Mexico Sulfuric Acid Market Statistics, 2022-2032F
6.5.1.Market Size & Growth Outlook
6.5.1.1. By Revenues in USD Million
6.5.1.2. By Volume Thousand Tons
6.5.2.Market Segmentation & Growth Outlook
6.5.2.1. By Grade- Market Insights and Forecast 2022-2032, USD Million
6.5.2.2. By Application- Market Insights and Forecast 2022-2032, USD Million
7. South America Sulfuric Acid Market Statistics, 2022-2032F
7.1. Market Size & Growth Outlook
7.1.1.By Revenues in USD Million
7.1.2.By Volume Thousand Tons
7.2. Market Segmentation & Growth Outlook
7.2.1.By Grade- Market Insights and Forecast 2022-2032, USD Million
7.2.2.By Application- Market Insights and Forecast 2022-2032, USD Million
7.2.3.By Raw Material Type- Market Insights and Forecast 2022-2032, USD Million
7.2.4.By Production Process- Market Insights and Forecast 2022-2032, USD Million
7.2.5.By Concentration- Market Insights and Forecast 2022-2032, USD Million
7.2.6.By Form Type- Market Insights and Forecast 2022-2032, USD Million
7.2.7.By Country
7.2.7.1. Brazil
7.2.7.2. Rest of South America
7.3. Brazil Sulfuric Acid Market Statistics, 2022-2032F
7.3.1.Market Size & Growth Outlook
7.3.1.1. By Revenues in USD Million
7.3.1.2. By Volume Thousand Tons
7.3.2.Market Segmentation & Growth Outlook
7.3.2.1. By Grade- Market Insights and Forecast 2022-2032, USD Million
7.3.2.2. By Application- Market Insights and Forecast 2022-2032, USD Million
8. Europe Sulfuric Acid Market Statistics, 2022-2032F
8.1. Market Size & Growth Outlook
8.1.1.By Revenues in USD Million
8.1.2.By Volume Thousand Tons
8.2. Market Segmentation & Growth Outlook
8.2.1.By Grade- Market Insights and Forecast 2022-2032, USD Million
8.2.2.By Application- Market Insights and Forecast 2022-2032, USD Million
8.2.3.By Raw Material Type- Market Insights and Forecast 2022-2032, USD Million
8.2.4.By Production Process- Market Insights and Forecast 2022-2032, USD Million
8.2.5.By Concentration- Market Insights and Forecast 2022-2032, USD Million
8.2.6.By Form Type- Market Insights and Forecast 2022-2032, USD Million
8.2.7.By Country
8.2.7.1. Russia
8.2.7.2. Germany
8.2.7.3. France
8.2.7.4. UK
8.2.7.5. Italy
8.2.7.6. Spain
8.2.7.7. Netherlands
8.2.7.8. Belgium
8.2.7.9. Poland
8.2.7.10. Turkey
8.2.7.11. Rest of Europe
8.3. Russia Sulfuric Acid Market Statistics, 2022-2032F
8.3.1.Market Size & Growth Outlook
8.3.1.1. By Revenues in USD Million
8.3.1.2. By Volume Thousand Tons
8.3.2.Market Segmentation & Growth Outlook
8.3.2.1. By Grade- Market Insights and Forecast 2022-2032, USD Million
8.3.2.2. By Application- Market Insights and Forecast 2022-2032, USD Million
8.4. Germany Sulfuric Acid Market Statistics, 2022-2032F
8.4.1.Market Size & Growth Outlook
8.4.1.1. By Revenues in USD Million
8.4.1.2. By Volume Thousand Tons
8.4.2.Market Segmentation & Growth Outlook
8.4.2.1. By Grade- Market Insights and Forecast 2022-2032, USD Million
8.4.2.2. By Application- Market Insights and Forecast 2022-2032, USD Million
8.5. France Sulfuric Acid Market Statistics, 2022-2032F
8.5.1.Market Size & Growth Outlook
8.5.1.1. By Revenues in USD Million
8.5.1.2. By Volume Thousand Tons
8.5.2.Market Segmentation & Growth Outlook
8.5.2.1. By Grade- Market Insights and Forecast 2022-2032, USD Million
8.5.2.2. By Application- Market Insights and Forecast 2022-2032, USD Million
8.6. UK Sulfuric Acid Market Statistics, 2022-2032F
8.6.1.Market Size & Growth Outlook
8.6.1.1. By Revenues in USD Million
8.6.1.2. By Volume Thousand Tons
8.6.2.Market Segmentation & Growth Outlook
8.6.2.1. By Grade- Market Insights and Forecast 2022-2032, USD Million
8.6.2.2. By Application- Market Insights and Forecast 2022-2032, USD Million
8.7. Italy Sulfuric Acid Market Statistics, 2022-2032F
8.7.1.Market Size & Growth Outlook
8.7.1.1. By Revenues in USD Million
8.7.1.2. By Volume Thousand Tons
8.7.2.Market Segmentation & Growth Outlook
8.7.2.1. By Grade- Market Insights and Forecast 2022-2032, USD Million
8.7.2.2. By Application- Market Insights and Forecast 2022-2032, USD Million
8.8. Spain Sulfuric Acid Market Statistics, 2022-2032F
8.8.1.Market Size & Growth Outlook
8.8.1.1. By Revenues in USD Million
8.8.1.2. By Volume Thousand Tons
8.8.2.Market Segmentation & Growth Outlook
8.8.2.1. By Grade- Market Insights and Forecast 2022-2032, USD Million
8.8.2.2. By Application- Market Insights and Forecast 2022-2032, USD Million
8.9. Netherlands Sulfuric Acid Market Statistics, 2022-2032F
8.9.1.Market Size & Growth Outlook
8.9.1.1. By Revenues in USD Million
8.9.1.2. By Volume Thousand Tons
8.9.2.Market Segmentation & Growth Outlook
8.9.2.1. By Grade- Market Insights and Forecast 2022-2032, USD Million
8.9.2.2. By Application- Market Insights and Forecast 2022-2032, USD Million
8.10. Belgium Sulfuric Acid Market Statistics, 2022-2032F
8.10.1. Market Size & Growth Outlook
8.10.1.1. By Revenues in USD Million
8.10.1.2. By Volume Thousand Tons
8.10.2. Market Segmentation & Growth Outlook
8.10.2.1. By Grade- Market Insights and Forecast 2022-2032, USD Million
8.10.2.2. By Application- Market Insights and Forecast 2022-2032, USD Million
8.11. Poland Sulfuric Acid Market Statistics, 2022-2032F
8.11.1. Market Size & Growth Outlook
8.11.1.1. By Revenues in USD Million
8.11.1.2. By Volume Thousand Tons
8.11.2. Market Segmentation & Growth Outlook
8.11.2.1. By Grade- Market Insights and Forecast 2022-2032, USD Million
8.11.2.2. By Application- Market Insights and Forecast 2022-2032, USD Million
8.12. Turkey Sulfuric Acid Market Statistics, 2022-2032F
8.12.1. Market Size & Growth Outlook
8.12.1.1. By Revenues in USD Million
8.12.1.2. By Volume Thousand Tons
8.12.2. Market Segmentation & Growth Outlook
8.12.2.1. By Grade- Market Insights and Forecast 2022-2032, USD Million
8.12.2.2. By Application- Market Insights and Forecast 2022-2032, USD Million
9. Middle East & Africa Sulfuric Acid Market Statistics, 2022-2032F
9.1. Market Size & Growth Outlook
9.1.1.By Revenues in USD Million
9.1.2.By Volume Thousand Tons
9.2. Market Segmentation & Growth Outlook
9.2.1.By Grade- Market Insights and Forecast 2022-2032, USD Million
9.2.2.By Application- Market Insights and Forecast 2022-2032, USD Million
9.2.3.By Raw Material Type- Market Insights and Forecast 2022-2032, USD Million
9.2.4.By Production Process- Market Insights and Forecast 2022-2032, USD Million
9.2.5.By Concentration- Market Insights and Forecast 2022-2032, USD Million
9.2.6.By Form Type- Market Insights and Forecast 2022-2032, USD Million
9.2.7.By Country
9.2.7.1. Rest of Middle East & Africa
10. Asia Pacific Sulfuric Acid Market Statistics, 2022-2032F
10.1. Market Size & Growth Outlook
10.1.1. By Revenues in USD Million
10.1.2. By Volume Thousand Tons
10.2. Market Segmentation & Growth Outlook
10.2.1. By Grade- Market Insights and Forecast 2022-2032, USD Million
10.2.2. By Application- Market Insights and Forecast 2022-2032, USD Million
10.2.3. By Raw Material Type- Market Insights and Forecast 2022-2032, USD Million
10.2.4. By Production Process- Market Insights and Forecast 2022-2032, USD Million
10.2.5. By Concentration- Market Insights and Forecast 2022-2032, USD Million
10.2.6. By Form Type- Market Insights and Forecast 2022-2032, USD Million
10.2.7. By Country
10.2.7.1. China
10.2.7.2. India
10.2.7.3. Japan
10.2.7.4. South Korea
10.2.7.5. Australia
10.2.7.6. Thailand
10.2.7.7. Rest of Asia Pacific
10.3. China Sulfuric Acid Market Statistics, 2022-2032F
10.3.1. Market Size & Growth Outlook
10.3.1.1. By Revenues in USD Million
10.3.1.2. By Volume Thousand Tons
10.3.2. Market Segmentation & Growth Outlook
10.3.2.1. By Grade- Market Insights and Forecast 2022-2032, USD Million
10.3.2.2. By Application- Market Insights and Forecast 2022-2032, USD Million
10.4. India Sulfuric Acid Market Statistics, 2022-2032F
10.4.1. Market Size & Growth Outlook
10.4.1.1. By Revenues in USD Million
10.4.1.2. By Volume Thousand Tons
10.4.2. Market Segmentation & Growth Outlook
10.4.2.1. By Grade- Market Insights and Forecast 2022-2032, USD Million
10.4.2.2. By Application- Market Insights and Forecast 2022-2032, USD Million
10.5. Japan Sulfuric Acid Market Statistics, 2022-2032F
10.5.1. Market Size & Growth Outlook
10.5.1.1. By Revenues in USD Million
10.5.1.2. By Volume Thousand Tons
10.5.2. Market Segmentation & Growth Outlook
10.5.2.1. By Grade- Market Insights and Forecast 2022-2032, USD Million
10.5.2.2. By Application- Market Insights and Forecast 2022-2032, USD Million
10.6. South Korea Sulfuric Acid Market Statistics, 2022-2032F
10.6.1. Market Size & Growth Outlook
10.6.1.1. By Revenues in USD Million
10.6.1.2. By Volume Thousand Tons
10.6.2. Market Segmentation & Growth Outlook
10.6.2.1. By Grade- Market Insights and Forecast 2022-2032, USD Million
10.6.2.2. By Application- Market Insights and Forecast 2022-2032, USD Million
10.7. Australia Sulfuric Acid Market Statistics, 2022-2032F
10.7.1. Market Size & Growth Outlook
10.7.1.1. By Revenues in USD Million
10.7.1.2. By Volume Thousand Tons
10.7.2. Market Segmentation & Growth Outlook
10.7.2.1. By Grade- Market Insights and Forecast 2022-2032, USD Million
10.7.2.2. By Application- Market Insights and Forecast 2022-2032, USD Million
10.8. Thailand Sulfuric Acid Market Statistics, 2022-2032F
10.8.1. Market Size & Growth Outlook
10.8.1.1. By Revenues in USD Million
10.8.1.2. By Volume Thousand Tons
10.8.2. Market Segmentation & Growth Outlook
10.8.2.1. By Grade- Market Insights and Forecast 2022-2032, USD Million
10.8.2.2. By Application- Market Insights and Forecast 2022-2032, USD Million
11. Competitive Outlook
11.1. Company Profiles
11.1.1. PhosAgro Group
11.1.1.1. Business Description
11.1.1.2. Product Portfolio
11.1.1.3. Collaborations & Alliances
11.1.1.4. Recent Developments
11.1.1.5. Financial Details
11.1.1.6. Others
11.1.2. Mosaic Company
11.1.2.1. Business Description
11.1.2.2. Product Portfolio
11.1.2.3. Collaborations & Alliances
11.1.2.4. Recent Developments
11.1.2.5. Financial Details
11.1.2.6. Others
11.1.3. OCP (Office Chérifien des Phosphates)
11.1.3.1. Business Description
11.1.3.2. Product Portfolio
11.1.3.3. Collaborations & Alliances
11.1.3.4. Recent Developments
11.1.3.5. Financial Details
11.1.3.6. Others
11.1.4. China Petroleum & Chemical Corporation (Sinopec)
11.1.4.1. Business Description
11.1.4.2. Product Portfolio
11.1.4.3. Collaborations & Alliances
11.1.4.4. Recent Developments
11.1.4.5. Financial Details
11.1.4.6. Others
11.1.5. Aurubis AG
11.1.5.1. Business Description
11.1.5.2. Product Portfolio
11.1.5.3. Collaborations & Alliances
11.1.5.4. Recent Developments
11.1.5.5. Financial Details
11.1.5.6. Others
11.1.6. BASF SE
11.1.6.1. Business Description
11.1.6.2. Product Portfolio
11.1.6.3. Collaborations & Alliances
11.1.6.4. Recent Developments
11.1.6.5. Financial Details
11.1.6.6. Others
11.1.7. Jiangxi Copper Corporation
11.1.7.1. Business Description
11.1.7.2. Product Portfolio
11.1.7.3. Collaborations & Alliances
11.1.7.4. Recent Developments
11.1.7.5. Financial Details
11.1.7.6. Others
11.1.8. Korea Zinc
11.1.8.1. Business Description
11.1.8.2. Product Portfolio
11.1.8.3. Collaborations & Alliances
11.1.8.4. Recent Developments
11.1.8.5. Financial Details
11.1.8.6. Others
11.1.9. Chemtrade Logistics
11.1.9.1. Business Description
11.1.9.2. Product Portfolio
11.1.9.3. Collaborations & Alliances
11.1.9.4. Recent Developments
11.1.9.5. Financial Details
11.1.9.6. Others
11.1.10. Ecovyst Inc. (Ecoservices)
11.1.10.1.Business Description
11.1.10.2.Product Portfolio
11.1.10.3.Collaborations & Alliances
11.1.10.4.Recent Developments
11.1.10.5.Financial Details
11.1.10.6.Others
11.1.11. Nouryon
11.1.11.1.Business Description
11.1.11.2.Product Portfolio
11.1.11.3.Collaborations & Alliances
11.1.11.4.Recent Developments
11.1.11.5.Financial Details
11.1.11.6.Others
11.1.12. Boliden Group
11.1.12.1.Business Description
11.1.12.2.Product Portfolio
11.1.12.3.Collaborations & Alliances
11.1.12.4.Recent Developments
11.1.12.5.Financial Details
11.1.12.6.Others
11.1.13. LANXESS
11.1.13.1.Business Description
11.1.13.2.Product Portfolio
11.1.13.3.Collaborations & Alliances
11.1.13.4.Recent Developments
11.1.13.5.Financial Details
11.1.13.6.Others
11.1.14. PVS Chemicals
11.1.14.1.Business Description
11.1.14.2.Product Portfolio
11.1.14.3.Collaborations & Alliances
11.1.14.4.Recent Developments
11.1.14.5.Financial Details
11.1.14.6.Others
11.1.15. WeylChem International
11.1.15.1.Business Description
11.1.15.2.Product Portfolio
11.1.15.3.Collaborations & Alliances
11.1.15.4.Recent Developments
11.1.15.5.Financial Details
11.1.15.6.Others
12. Disclaimer
| Segment | Sub-Segment |
|---|---|
| By Grade |
|
| By Application |
|
| By Raw Material Type |
|
| By Production Process |
|
| By Concentration |
|
| By Form Type |
|
| By Region |
|
Research Methodology
This study followed a structured approach comprising four key phases to assess the size and scope of the electro-oxidation market. The process began with thorough secondary research to collect data on the target market, related markets, and broader industry context. These findings, along with preliminary assumptions and estimates, were then validated through extensive primary research involving industry experts from across the value chain. To calculate the overall market size, both top-down and bottom-up methodologies were employed. Finally, market segmentation and data triangulation techniques were applied to refine and validate segment-level estimations.
Secondary Research
The secondary research phase involved gathering data from a wide range of credible and published sources. This step helped in identifying industry trends, defining market segmentation, and understanding the market landscape and value chain.
Sources consulted during this phase included:
- Company annual reports, investor presentations, and press releases
- Industry white papers and certified publications
- Trade directories and market-recognized databases
- Articles from authoritative authors and reputable journals
- Gold and silver standard websites
Secondary research was critical in mapping out the industry's value chain and monetary flow, identifying key market segments, understanding regional variations, and tracking significant industry developments.
Other key sources:
- Financial disclosures
- Industry associations and trade bodies
- News outlets and business magazines
- Academic journals and research studies
- Paid industry databases
Primary Research
To validate secondary data and gain deeper market insights, primary research was conducted with key stakeholders across both the supply and demand sides of the market.
On the demand side, participants included decision-makers and influencers from end-user industries—such as CIOs, CTOs, and CSOs—who provided first-hand perspectives on market needs, product usage, and future expectations.
On the supply side, interviews were conducted with manufacturers, industry associations, and institutional participants to gather insights into current offerings, product pipelines, and market challenges.
Primary interviews provided critical inputs such as:
- Market size and revenue data
- Product and service breakdowns
- Market forecasts
- Regional and application-specific trends
Stakeholders consulted included:
- Leading OEM and solution providers
- Channel and distribution partners
- End users across various applications
- Independent consultants and industry specialists
Market Size Estimation and Data Triangulation
- Identifying Key Market Participants (Secondary Research)
- Goal: To identify the major players or companies in the target market. This typically involves using publicly available data sources such as industry reports, market research publications, and financial statements of companies.
- Tools: Reports from firms like Gartner, Forrester, Euromonitor, Statista, IBISWorld, and others. Public financial statements, news articles, and press releases from top market players.
- Extracting Earnings of Key Market Participants
- Goal: To estimate the earnings generated from the product or service being analyzed. This step helps in understanding the revenue potential of each market player in a specific geography.
- Methods: Earnings data can be gathered from:
- Publicly available financial reports (for listed companies).
- Interviews and primary data sources from professionals, such as Directors, VPs, SVPs, etc. This is especially useful for understanding more nuanced, internal data that isn't publicly disclosed.
- Annual reports and investor presentations of key players.
- Data Collation and Development of a Relevant Data Model
- Goal: To collate inputs from both primary and secondary sources into a structured, data-driven model for market estimation. This model will incorporate key market KPIs and any independent variables relevant to the market.
- Key KPIs: These could include:
- Market size, growth rate, and demand drivers.
- Industry-specific metrics like market share, average revenue per customer (ARPC), or average deal size.
- External variables, such as economic growth rates, inflation rates, or commodity prices, that could affect the market.
- Data Modeling: Based on this data, the market forecasts are developed for the next 5 years. A combination of trend analysis, scenario modeling, and statistical regression might be used to generate projections.
- Scenario Analysis
- Goal: To test different assumptions and validate how sensitive the market is to changes in key variables (e.g., market demand, regulatory changes, technological disruptions).
- Types of Scenarios:
- Base Case: Based on current assumptions and historical data.
- Best-Case Scenario: Assuming favorable market conditions, regulatory environments, and technological advancements.
- Worst-Case Scenario: Accounting for adverse factors, such as economic downturns, stricter regulations, or unexpected disruptions.


