Global Acrylamide Market Report: Trends, Growth and Forecast (2026-2032)
By Grade (Industrial Grade, Polymer Grade), By Application (Water Treatment, Paper, Cosmetics, Oil Recovery), By End-Use Industry (Water Treatment, Paper, Cosmetics, Oil Recovery), By Region (North America, South America, Europe, Asia Pacific) ... Read more
|
Major Players
|
Global Acrylamide Market Statistics and Insights, 2026
- Market Size Statistics
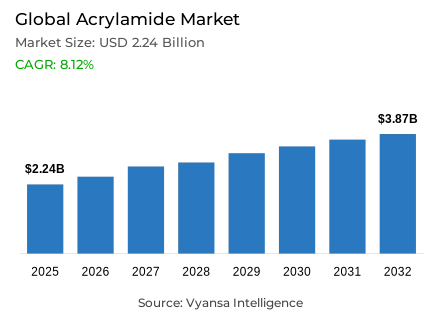
- Global acrylamide market is estimated at USD 2.24 billion in 2025.
- The market size is expected to grow to USD 3.87 billion by 2032.
- Market to register a CAGR of around 8.12% during 2026-32.
- Grade Shares
- Industrial grade grabbed market share of 60%.
- Competition
- Global acrylamide market is currently being catered to by more than 20 companies.
- Top 5 companies acquired around 45% of the market share.
- Nanjing Chemical Industry Group Co. Ltd.; Solenis; Arkema; BASF SE; SNF Floerger etc., are few of the top companies.
- Application
- Water treatment grabbed 45% of the market.
- Region
- Asia Pacific leads with a 50% share of the global market.
Global Acrylamide Market Outlook
The Global acrylamide market Outlook 2026-2032 shows a consistent growth that is mainly due to the growing stricter water-quality standards and massive infrastructure renovations. The regulatory systems imposed by the government like the U.S. Environmental Protection Agency and the World Health Organization require municipal and industrial plants to continuously use certified acrylamide-based flocculants to ensure that the residual monomer levels are within the required limits. With multilateral funding, such as USD 4.65 billion that the World Bank has pledged to water projects during the fiscal year 2023, compliance-based procurement has turned into a structural necessity and not a discretionary option. As a result, the global acryl amide market, which is estimated to be USD 2.24 billion in 2025, is expected to increase steadily to USD 3.87 billion by 2032, with a compound annual growth rate of about 8.12% in the period 2026–2032.
The continuing disparities in world water-treatment capacity support growth momentum. According to United Nations evaluations, the world is still far behind the global water and sanitation goals, and the implementation rates will have to be four times higher by 2030. This compliance gap is especially pronounced in the emerging economies, where discharge violations and system inefficiencies are widespread. With the increased enforcement, the demand is shifting to more performance flocculants that can effectively remove suspended solids, organic matter, and heavy metals.
This is the dynamic behind long-term demand visibility of acrylamide-based polymers, which is more of a regulatory alignment and infrastructure need than a short-term industrial cycle. Structurally, the Industrial Grade acrylamide represents about 60% of the total market volume, which is indicative of its extensive application in large-scale processes, including wastewater treatment, mining, and energy-related processes. The most common use is Water Treatment, which takes about 45% of the world demand, with continuous upgrades of municipal and industrial treatment systems.
Asia Pacific is the market leader with almost half of the market share, with the strong foundation of the large production base in China and the government-driven pollution control programs, which will guarantee the region to remain the leader by 2032.

Global Acrylamide Market Growth Driver
Regulatory Escalation in Water Quality Standards
Strict environmental policies are becoming a major factor in the operations choices across the entire acryl amide market, especially in water-intensive industries. The regulations on drinking water and wastewater by the authorities like the U.S. Environmental Protection Agency and the World Health Organization place stringent restrictions on the residual acrylamide monomer content, forcing the facilities to install certified polyacrylamide-based flocculation systems. These requirements have a direct impact on the procurement behavior of municipal utilities and industrial end users, since compliance requires the use of advanced treatment chemicals on a consistent basis. This transition is being strengthened by multilateral development banks, with the World Bank committing USD 4.65 billion to water projects in fiscal year 2023, the largest in five years, indicating faster infrastructure improvements across the globe.
Regulatory ambition remains above current treatment capabilities. According to United Nations evaluations, the achievement of Sustainable Development Goal 6 is still far behind schedule, and the implementation rates will have to increase fourfold by 2030. This widening compliance gap leads to chronic discharge violations and system inefficiencies, especially in the emerging economies. With the increased regulatory enforcement, plants are forced to use more performance flocculants to eliminate suspended solids, organic matter, and heavy metals. This structural reliance on acryamide-based polymers is the basis of long-term demand growth through 2032, which is not driven by cyclical industrial factors but long-term policy alignment.
Global Acrylamide Market Challenge
Heightened Health and Safety Compliance Burdens
Increasing health and safety questioning is one of the main limitations to the global acryl amide market, due to the fact that acryl amide is a probable human carcinogen. The regulatory authorities have also established more stringent exposure limits in water, food, and industrial use, which has made compliance more complex among manufacturers. European and North American authorities demand strict certification that polymer formulations contain residual monomer levels that are significantly lower than specified limits, increasing testing, documentation, and monitoring requirements. These demands have a disproportionate impact on smaller producers, since compliance requires ongoing analytical verification and conformity to standards like NSF/ANSI specifications.
Operationally, manufacturers are faced with increased production costs in terms of increased purification, low-temperature synthesis, and improved filtration technologies. Regional disparities also make global supply chains more complex, with jurisdictions having different limits on permissible concentration. The need to meet several regulatory regimes at the same time adds to the barriers to market entry and limits capacity expansion. Although these measures improve the safety of end-users and environmental protection, they also squeeze margins and extend commercialization cycles, especially in new entrants trying to scale production in highly regulated markets.
Unlock Market Intelligence
Explore the market potential with our data-driven report
Global Acrylamide Market Trend
Shift Toward Sustainable and Bio-Based Production
The global acrylamide market is redefining the priorities of innovation in the context of sustainability, which is gradually shifting to bio-based and low-toxicity synthesis routes. Enzyme-assisted polymerization methods and agro-food waste stream-based flocculants are being developed by research institutions and manufacturers to minimize environmental impact without compromising functional performance. These strategies are in line with the principles of the circular economy, which minimizes the use of fossil-based feedstocks and dangerous by-products. To industrial end users who face sustainability audits and environmental reporting demands, bio-based acrylamide derivatives provide a route to sustain treatment efficiency and enhance environmental profiles.
The impetus of this transition is highlighted by scientific output. The international research effort on mitigation of acryamide and alternative synthesis pathways has grown consistently, which is an indication of a concerted academic and industrial effort. The development of green extraction and food-grade processing technologies is proving to be more and more viable on a commercial level, overcoming previous fears of cost and performance trade-offs. With regulators integrating sustainability indicators into procurement and permitting systems, these innovations are becoming commercially relevant, making bio-based variants an emerging growth axis instead of a niche option.
Global Acrylamide Market Opportunity
Expanding Global Water Infrastructure Investment Gap
The global water infrastructure financing deficit is a huge opportunity to the global acryl amide market. Despite the fact that multilateral institutions have been making more commitments such as USD 4.65 billion in World Bank water investments in fiscal year 2023, this is still not enough compared to the long-term requirements. According to OECD estimates, the additional investment needed to reach water security by 2030 is estimated at USD 1.7 trillion, which is a significant funding gap. This shortage is most severe in the capacity of wastewater treatment, where urbanization and industrialization are still running ahead of infrastructure development.
In addition to governmental funding, the issue of water-security in the private sector is escalating the need to find sophisticated treatment options. Industrial operations contribute to approximately 15% of the total water withdrawals in the world, and energy production alone uses enormous amounts of water, which must be treated to be reused or discharged in a manner that meets the standards. United Nations statistics affirm that to achieve global water-access and quality targets, implementation rates must be fourfold. This combination of infrastructure shortages and industrial water stress generates long-term demand of acrylamide-based flocculants in both municipal and industrial treatment systems up to 2032.
Global Acrylamide Market Regional Analysis

By Region
- North America
- South America
- Europe
- Asia Pacific
Asia Pacific accounts for approximately 50% of the Global acrylamide market, reflecting its concentration of production capacity, industrial activity, and water treatment demand. China anchors regional leadership through its extensive manufacturing base and government-mandated pollution control initiatives, driving high consumption of polyacrylamide flocculants. Strong domestic demand, coupled with ongoing investment in municipal and industrial water infrastructure, positions the country as a central force shaping regional market dynamics.
The broader region reinforces this dominance through technological capability and trade activity. Japan and South Korea contribute advanced research, manufacturing expertise, and substantial import demand, supporting a robust regional ecosystem. Government-led initiatives targeting industrial discharge reduction, wastewater reuse, and environmental compliance continue to stimulate procurement across Asia-Pacific. This combination of scale, policy support, and industrial intensity ensures the region’s leadership position remains intact through the forecast horizon.
Unlock Market Intelligence
Explore the market potential with our data-driven report
Global Acrylamide Market Segmentation Analysis
By Grade
- Industrial Grade
- Polymer Grade
Under the purity-based classification, Industrial Grade acrylamide dominates the Global acrylamide market, accounting for approximately 60% of total market volume. This grade serves as the primary raw material for polyacrylamide production used across wastewater treatment, mining operations, and enhanced oil recovery. Its technical suitability for high-volume applications, combined with cost efficiency, makes it the preferred choice for large-scale industrial end users. Regulatory frameworks permit its use in drinking water treatment when residual monomer levels remain within prescribed thresholds, reinforcing confidence among municipal operators.
Supply chain reliability further strengthens Industrial Grade dominance. Established manufacturing hubs in the United States and Asia ensure consistent availability, supporting large infrastructure and industrial projects. Its long-standing regulatory acceptance, proven performance, and compatibility with existing treatment systems reduce switching incentives for end users. As water infrastructure investments expand globally, procurement patterns continue to favor Industrial Grade material, solidifying its leadership position throughout the forecast period.

By Application
- Water Treatment
- Paper
- Cosmetics
- Oil Recovery
Water Treatment application represents the largest end-use segment in the Global acrylamide market, capturing approximately 45% of total demand. Acrylamide-based polyacrylamides are integral to coagulation and flocculation processes in municipal and industrial wastewater facilities, enabling effective removal of suspended solids, organic pollutants, and heavy metals. Regulatory requirements governing discharge quality and residual monomer content drive consistent procurement of certified polymers. Public investment flows, including multilateral financing for treatment plant upgrades, directly support sustained consumption within this segment.
The application scope continues to expand as global water stress intensifies. Energy generation, manufacturing, and mining activities generate large volumes of effluent requiring advanced treatment prior to reuse or release. United Nations assessments emphasize the scale of infrastructure expansion required to meet global water quality targets, underscoring long-term demand visibility. Given its critical role in regulatory compliance and resource efficiency, Water Treatment is expected to maintain its leading application share through 2032.
Market Players in Global Acrylamide Market
These market players maintain a significant presence in the Global acrylamide market sector and contribute to its ongoing evolution.
- Nanjing Chemical Industry Group Co. Ltd.
- Solenis
- Arkema
- BASF SE
- SNF Floerger
- Kemira Oyj
- Solvay S.A.
- Mitsubishi Chemical Holdings Corporation
- Dow Chemical Company
- Lonza Group
- Clariant
- Sekisui Chemical Co.
- INEOS
- Kuraray Co.
- INEOS Oxide
Market News & Updates
- SNF Floerger, 2025:
SNF Floerger highlighted a major sustainability milestone in its 2024 Environmental, Social & Governance Report released in 2025. The company’s acrylamide-based polymer flooding solutions for Enhanced Oil Recovery reduce water usage by around 80% and carbon dioxide emissions by approximately 66% compared to conventional extraction techniques. SNF maintains a diversified portfolio of more than 1,100 water-soluble polymers and introduces over 150 new products annually. Its global footprint includes 21 production facilities across Europe, the Americas, Asia, and Australia, supporting applications in water treatment, mining, oil recovery, and textiles.
- Kemira Oyj, 2025:
Kemira completed the acquisition of Water Engineering, Inc. in October 2025 for roughly $150 million USD, strengthening its position in industrial water treatment services. The Nebraska-based firm operates 14 facilities across North America and is expected to generate over $60 million USD in revenue in 2025. The acquisition expands Kemira’s Water Solutions business by adding service capabilities in boiler, cooling tower, and industrial wastewater treatment, reinforcing its integrated chemical and service-based offering in the North American market.
Frequently Asked Questions
Related Report
1. Market Segmentation
1.1. Research Scope
1.2. Research Methodology
1.3. Definitions and Assumptions
2. Executive Summary
3. Global Acrylamide Market Policies, Regulations, and Standards
4. Global Acrylamide Market Dynamics
4.1. Growth Factors
4.2. Challenges
4.3. Trends
4.4. Opportunities
5. Global Acrylamide Market Statistics, 2022-2032F
5.1. Market Size & Growth Outlook
5.1.1.By Revenues in USD Million
5.2. Market Segmentation & Growth Outlook
5.2.1.By Grade
5.2.1.1. Industrial Grade- Market Insights and Forecast 2022-2032, USD Million
5.2.1.2. Polymer Grade- Market Insights and Forecast 2022-2032, USD Million
5.2.2.By Application
5.2.2.1. Water Treatment- Market Insights and Forecast 2022-2032, USD Million
5.2.2.2. Paper- Market Insights and Forecast 2022-2032, USD Million
5.2.2.3. Cosmetics- Market Insights and Forecast 2022-2032, USD Million
5.2.2.4. Oil Recovery- Market Insights and Forecast 2022-2032, USD Million
5.2.3.By End-Use Industry
5.2.3.1. Water Treatment- Market Insights and Forecast 2022-2032, USD Million
5.2.3.2. Paper- Market Insights and Forecast 2022-2032, USD Million
5.2.3.3. Cosmetics- Market Insights and Forecast 2022-2032, USD Million
5.2.3.4. Oil Recovery- Market Insights and Forecast 2022-2032, USD Million
5.2.4.By Region
5.2.4.1. North America
5.2.4.2. South America
5.2.4.3. Europe
5.2.4.4. Asia Pacific
5.2.5.By Competitors
5.2.5.1. Competition Characteristics
5.2.5.2. Market Share & Analysis
6. North America Acrylamide Market Statistics, 2022-2032F
6.1. Market Size & Growth Outlook
6.1.1.By Revenues in USD Million
6.2. Market Segmentation & Growth Outlook
6.2.1.By Grade- Market Insights and Forecast 2022-2032, USD Million
6.2.2.By Application- Market Insights and Forecast 2022-2032, USD Million
6.2.3.By End-Use Industry- Market Insights and Forecast 2022-2032, USD Million
6.2.4.By Country
6.2.4.1. US
6.2.4.2. Canada
6.2.4.3. Mexico
6.2.4.4. Rest of North America
6.3. US Acrylamide Market Statistics, 2022-2032F
6.3.1.Market Size & Growth Outlook
6.3.1.1. By Revenues in USD Million
6.3.2.Market Segmentation & Growth Outlook
6.3.2.1. By Grade- Market Insights and Forecast 2022-2032, USD Million
6.3.2.2. By Application- Market Insights and Forecast 2022-2032, USD Million
6.4. Canada Acrylamide Market Statistics, 2022-2032F
6.4.1.Market Size & Growth Outlook
6.4.1.1. By Revenues in USD Million
6.4.2.Market Segmentation & Growth Outlook
6.4.2.1. By Grade- Market Insights and Forecast 2022-2032, USD Million
6.4.2.2. By Application- Market Insights and Forecast 2022-2032, USD Million
6.5. Mexico Acrylamide Market Statistics, 2022-2032F
6.5.1.Market Size & Growth Outlook
6.5.1.1. By Revenues in USD Million
6.5.2.Market Segmentation & Growth Outlook
6.5.2.1. By Grade- Market Insights and Forecast 2022-2032, USD Million
6.5.2.2. By Application- Market Insights and Forecast 2022-2032, USD Million
7. South America Acrylamide Market Statistics, 2022-2032F
7.1. Market Size & Growth Outlook
7.1.1.By Revenues in USD Million
7.2. Market Segmentation & Growth Outlook
7.2.1.By Grade- Market Insights and Forecast 2022-2032, USD Million
7.2.2.By Application- Market Insights and Forecast 2022-2032, USD Million
7.2.3.By End-Use Industry- Market Insights and Forecast 2022-2032, USD Million
7.2.4.By Country
7.2.4.1. Brazil
7.2.4.2. Rest of South America
7.3. Brazil Acrylamide Market Statistics, 2022-2032F
7.3.1.Market Size & Growth Outlook
7.3.1.1. By Revenues in USD Million
7.3.2.Market Segmentation & Growth Outlook
7.3.2.1. By Grade- Market Insights and Forecast 2022-2032, USD Million
7.3.2.2. By Application- Market Insights and Forecast 2022-2032, USD Million
8. Europe Acrylamide Market Statistics, 2022-2032F
8.1. Market Size & Growth Outlook
8.1.1.By Revenues in USD Million
8.2. Market Segmentation & Growth Outlook
8.2.1.By Grade- Market Insights and Forecast 2022-2032, USD Million
8.2.2.By Application- Market Insights and Forecast 2022-2032, USD Million
8.2.3.By End-Use Industry- Market Insights and Forecast 2022-2032, USD Million
8.2.4.By Country
8.2.4.1. Germany
8.2.4.2. France
8.2.4.3. UK
8.2.4.4. Italy
8.2.4.5. Spain
8.2.4.6. Netherlands
8.2.4.7. Belgium
8.2.4.8. Russia
8.2.4.9. Poland
8.2.4.10. Turkey
8.2.4.11. Rest of Europe
8.3. Germany Acrylamide Market Statistics, 2022-2032F
8.3.1.Market Size & Growth Outlook
8.3.1.1. By Revenues in USD Million
8.3.2.Market Segmentation & Growth Outlook
8.3.2.1. By Grade- Market Insights and Forecast 2022-2032, USD Million
8.3.2.2. By Application- Market Insights and Forecast 2022-2032, USD Million
8.4. France Acrylamide Market Statistics, 2022-2032F
8.4.1.Market Size & Growth Outlook
8.4.1.1. By Revenues in USD Million
8.4.2.Market Segmentation & Growth Outlook
8.4.2.1. By Grade- Market Insights and Forecast 2022-2032, USD Million
8.4.2.2. By Application- Market Insights and Forecast 2022-2032, USD Million
8.5. UK Acrylamide Market Statistics, 2022-2032F
8.5.1.Market Size & Growth Outlook
8.5.1.1. By Revenues in USD Million
8.5.2.Market Segmentation & Growth Outlook
8.5.2.1. By Grade- Market Insights and Forecast 2022-2032, USD Million
8.5.2.2. By Application- Market Insights and Forecast 2022-2032, USD Million
8.6. Italy Acrylamide Market Statistics, 2022-2032F
8.6.1.Market Size & Growth Outlook
8.6.1.1. By Revenues in USD Million
8.6.2.Market Segmentation & Growth Outlook
8.6.2.1. By Grade- Market Insights and Forecast 2022-2032, USD Million
8.6.2.2. By Application- Market Insights and Forecast 2022-2032, USD Million
8.7. Spain Acrylamide Market Statistics, 2022-2032F
8.7.1.Market Size & Growth Outlook
8.7.1.1. By Revenues in USD Million
8.7.2.Market Segmentation & Growth Outlook
8.7.2.1. By Grade- Market Insights and Forecast 2022-2032, USD Million
8.7.2.2. By Application- Market Insights and Forecast 2022-2032, USD Million
8.8. Netherlands Acrylamide Market Statistics, 2022-2032F
8.8.1.Market Size & Growth Outlook
8.8.1.1. By Revenues in USD Million
8.8.2.Market Segmentation & Growth Outlook
8.8.2.1. By Grade- Market Insights and Forecast 2022-2032, USD Million
8.8.2.2. By Application- Market Insights and Forecast 2022-2032, USD Million
8.9. Belgium Acrylamide Market Statistics, 2022-2032F
8.9.1.Market Size & Growth Outlook
8.9.1.1. By Revenues in USD Million
8.9.2.Market Segmentation & Growth Outlook
8.9.2.1. By Grade- Market Insights and Forecast 2022-2032, USD Million
8.9.2.2. By Application- Market Insights and Forecast 2022-2032, USD Million
8.10. Russia Acrylamide Market Statistics, 2022-2032F
8.10.1. Market Size & Growth Outlook
8.10.1.1. By Revenues in USD Million
8.10.2. Market Segmentation & Growth Outlook
8.10.2.1. By Grade- Market Insights and Forecast 2022-2032, USD Million
8.10.2.2. By Application- Market Insights and Forecast 2022-2032, USD Million
8.11. Poland Acrylamide Market Statistics, 2022-2032F
8.11.1. Market Size & Growth Outlook
8.11.1.1. By Revenues in USD Million
8.11.2. Market Segmentation & Growth Outlook
8.11.2.1. By Grade- Market Insights and Forecast 2022-2032, USD Million
8.11.2.2. By Application- Market Insights and Forecast 2022-2032, USD Million
8.12. Turkey Acrylamide Market Statistics, 2022-2032F
8.12.1. Market Size & Growth Outlook
8.12.1.1. By Revenues in USD Million
8.12.2. Market Segmentation & Growth Outlook
8.12.2.1. By Grade- Market Insights and Forecast 2022-2032, USD Million
8.12.2.2. By Application- Market Insights and Forecast 2022-2032, USD Million
9. Asia Pacific Acrylamide Market Statistics, 2022-2032F
9.1. Market Size & Growth Outlook
9.1.1.By Revenues in USD Million
9.2. Market Segmentation & Growth Outlook
9.2.1.By Grade- Market Insights and Forecast 2022-2032, USD Million
9.2.2.By Application- Market Insights and Forecast 2022-2032, USD Million
9.2.3.By End-Use Industry- Market Insights and Forecast 2022-2032, USD Million
9.2.4.By Country
9.2.4.1. China
9.2.4.2. India
9.2.4.3. Japan
9.2.4.4. South Korea
9.2.4.5. Australia
9.2.4.6. Thailand
9.2.4.7. Rest of Asia Pacific
9.3. China Acrylamide Market Statistics, 2022-2032F
9.3.1.Market Size & Growth Outlook
9.3.1.1. By Revenues in USD Million
9.3.2.Market Segmentation & Growth Outlook
9.3.2.1. By Grade- Market Insights and Forecast 2022-2032, USD Million
9.3.2.2. By Application- Market Insights and Forecast 2022-2032, USD Million
9.4. India Acrylamide Market Statistics, 2022-2032F
9.4.1.Market Size & Growth Outlook
9.4.1.1. By Revenues in USD Million
9.4.2.Market Segmentation & Growth Outlook
9.4.2.1. By Grade- Market Insights and Forecast 2022-2032, USD Million
9.4.2.2. By Application- Market Insights and Forecast 2022-2032, USD Million
9.5. Japan Acrylamide Market Statistics, 2022-2032F
9.5.1.Market Size & Growth Outlook
9.5.1.1. By Revenues in USD Million
9.5.2.Market Segmentation & Growth Outlook
9.5.2.1. By Grade- Market Insights and Forecast 2022-2032, USD Million
9.5.2.2. By Application- Market Insights and Forecast 2022-2032, USD Million
9.6. South Korea Acrylamide Market Statistics, 2022-2032F
9.6.1.Market Size & Growth Outlook
9.6.1.1. By Revenues in USD Million
9.6.2.Market Segmentation & Growth Outlook
9.6.2.1. By Grade- Market Insights and Forecast 2022-2032, USD Million
9.6.2.2. By Application- Market Insights and Forecast 2022-2032, USD Million
9.7. Australia Acrylamide Market Statistics, 2022-2032F
9.7.1.Market Size & Growth Outlook
9.7.1.1. By Revenues in USD Million
9.7.2.Market Segmentation & Growth Outlook
9.7.2.1. By Grade- Market Insights and Forecast 2022-2032, USD Million
9.7.2.2. By Application- Market Insights and Forecast 2022-2032, USD Million
9.8. Thailand Acrylamide Market Statistics, 2022-2032F
9.8.1.Market Size & Growth Outlook
9.8.1.1. By Revenues in USD Million
9.8.2.Market Segmentation & Growth Outlook
9.8.2.1. By Grade- Market Insights and Forecast 2022-2032, USD Million
9.8.2.2. By Application- Market Insights and Forecast 2022-2032, USD Million
10. Competitive Outlook
10.1. Company Profiles
10.1.1. BASF SE
10.1.1.1. Business Description
10.1.1.2. Product Portfolio
10.1.1.3. Collaborations & Alliances
10.1.1.4. Recent Developments
10.1.1.5. Financial Details
10.1.1.6. Others
10.1.2. SNF Floerger
10.1.2.1. Business Description
10.1.2.2. Product Portfolio
10.1.2.3. Collaborations & Alliances
10.1.2.4. Recent Developments
10.1.2.5. Financial Details
10.1.2.6. Others
10.1.3. Kemira Oyj
10.1.3.1. Business Description
10.1.3.2. Product Portfolio
10.1.3.3. Collaborations & Alliances
10.1.3.4. Recent Developments
10.1.3.5. Financial Details
10.1.3.6. Others
10.1.4. Solvay S.A.
10.1.4.1. Business Description
10.1.4.2. Product Portfolio
10.1.4.3. Collaborations & Alliances
10.1.4.4. Recent Developments
10.1.4.5. Financial Details
10.1.4.6. Others
10.1.5. Mitsubishi Chemical Holdings Corporation
10.1.5.1. Business Description
10.1.5.2. Product Portfolio
10.1.5.3. Collaborations & Alliances
10.1.5.4. Recent Developments
10.1.5.5. Financial Details
10.1.5.6. Others
10.1.6. Nanjing Chemical Industry Group Co., Ltd.
10.1.6.1. Business Description
10.1.6.2. Product Portfolio
10.1.6.3. Collaborations & Alliances
10.1.6.4. Recent Developments
10.1.6.5. Financial Details
10.1.6.6. Others
10.1.7. Solenis
10.1.7.1. Business Description
10.1.7.2. Product Portfolio
10.1.7.3. Collaborations & Alliances
10.1.7.4. Recent Developments
10.1.7.5. Financial Details
10.1.7.6. Others
10.1.8. Arkema
10.1.8.1. Business Description
10.1.8.2. Product Portfolio
10.1.8.3. Collaborations & Alliances
10.1.8.4. Recent Developments
10.1.8.5. Financial Details
10.1.8.6. Others
10.1.9. Dow Chemical Company
10.1.9.1. Business Description
10.1.9.2. Product Portfolio
10.1.9.3. Collaborations & Alliances
10.1.9.4. Recent Developments
10.1.9.5. Financial Details
10.1.9.6. Others
10.1.10. Lonza Group
10.1.10.1.Business Description
10.1.10.2.Product Portfolio
10.1.10.3.Collaborations & Alliances
10.1.10.4.Recent Developments
10.1.10.5.Financial Details
10.1.10.6.Others
10.1.11. Clariant
10.1.11.1.Business Description
10.1.11.2.Product Portfolio
10.1.11.3.Collaborations & Alliances
10.1.11.4.Recent Developments
10.1.11.5.Financial Details
10.1.11.6.Others
10.1.12. Sekisui Chemical Co.
10.1.12.1.Business Description
10.1.12.2.Product Portfolio
10.1.12.3.Collaborations & Alliances
10.1.12.4.Recent Developments
10.1.12.5.Financial Details
10.1.12.6.Others
10.1.13. INEOS
10.1.13.1.Business Description
10.1.13.2.Product Portfolio
10.1.13.3.Collaborations & Alliances
10.1.13.4.Recent Developments
10.1.13.5.Financial Details
10.1.13.6.Others
10.1.14. Kuraray Co.
10.1.14.1.Business Description
10.1.14.2.Product Portfolio
10.1.14.3.Collaborations & Alliances
10.1.14.4.Recent Developments
10.1.14.5.Financial Details
10.1.14.6.Others
10.1.15. INEOS Oxide
10.1.15.1.Business Description
10.1.15.2.Product Portfolio
10.1.15.3.Collaborations & Alliances
10.1.15.4.Recent Developments
10.1.15.5.Financial Details
10.1.15.6.Others
11. Disclaimer
| Segment | Sub-Segment |
|---|---|
| By Grade |
|
| By Application |
|
| By End-Use Industry |
|
| By Region |
|
Research Methodology
This study followed a structured approach comprising four key phases to assess the size and scope of the electro-oxidation market. The process began with thorough secondary research to collect data on the target market, related markets, and broader industry context. These findings, along with preliminary assumptions and estimates, were then validated through extensive primary research involving industry experts from across the value chain. To calculate the overall market size, both top-down and bottom-up methodologies were employed. Finally, market segmentation and data triangulation techniques were applied to refine and validate segment-level estimations.
Secondary Research
The secondary research phase involved gathering data from a wide range of credible and published sources. This step helped in identifying industry trends, defining market segmentation, and understanding the market landscape and value chain.
Sources consulted during this phase included:
- Company annual reports, investor presentations, and press releases
- Industry white papers and certified publications
- Trade directories and market-recognized databases
- Articles from authoritative authors and reputable journals
- Gold and silver standard websites
Secondary research was critical in mapping out the industry's value chain and monetary flow, identifying key market segments, understanding regional variations, and tracking significant industry developments.
Other key sources:
- Financial disclosures
- Industry associations and trade bodies
- News outlets and business magazines
- Academic journals and research studies
- Paid industry databases
Primary Research
To validate secondary data and gain deeper market insights, primary research was conducted with key stakeholders across both the supply and demand sides of the market.
On the demand side, participants included decision-makers and influencers from end-user industries—such as CIOs, CTOs, and CSOs—who provided first-hand perspectives on market needs, product usage, and future expectations.
On the supply side, interviews were conducted with manufacturers, industry associations, and institutional participants to gather insights into current offerings, product pipelines, and market challenges.
Primary interviews provided critical inputs such as:
- Market size and revenue data
- Product and service breakdowns
- Market forecasts
- Regional and application-specific trends
Stakeholders consulted included:
- Leading OEM and solution providers
- Channel and distribution partners
- End users across various applications
- Independent consultants and industry specialists
Market Size Estimation and Data Triangulation
- Identifying Key Market Participants (Secondary Research)
- Goal: To identify the major players or companies in the target market. This typically involves using publicly available data sources such as industry reports, market research publications, and financial statements of companies.
- Tools: Reports from firms like Gartner, Forrester, Euromonitor, Statista, IBISWorld, and others. Public financial statements, news articles, and press releases from top market players.
- Extracting Earnings of Key Market Participants
- Goal: To estimate the earnings generated from the product or service being analyzed. This step helps in understanding the revenue potential of each market player in a specific geography.
- Methods: Earnings data can be gathered from:
- Publicly available financial reports (for listed companies).
- Interviews and primary data sources from professionals, such as Directors, VPs, SVPs, etc. This is especially useful for understanding more nuanced, internal data that isn't publicly disclosed.
- Annual reports and investor presentations of key players.
- Data Collation and Development of a Relevant Data Model
- Goal: To collate inputs from both primary and secondary sources into a structured, data-driven model for market estimation. This model will incorporate key market KPIs and any independent variables relevant to the market.
- Key KPIs: These could include:
- Market size, growth rate, and demand drivers.
- Industry-specific metrics like market share, average revenue per customer (ARPC), or average deal size.
- External variables, such as economic growth rates, inflation rates, or commodity prices, that could affect the market.
- Data Modeling: Based on this data, the market forecasts are developed for the next 5 years. A combination of trend analysis, scenario modeling, and statistical regression might be used to generate projections.
- Scenario Analysis
- Goal: To test different assumptions and validate how sensitive the market is to changes in key variables (e.g., market demand, regulatory changes, technological disruptions).
- Types of Scenarios:
- Base Case: Based on current assumptions and historical data.
- Best-Case Scenario: Assuming favorable market conditions, regulatory environments, and technological advancements.
- Worst-Case Scenario: Accounting for adverse factors, such as economic downturns, stricter regulations, or unexpected disruptions.


