Spain Energy Drink Market Report: Trends, Growth and Forecast (2025-2030)
By Product Type (Alcoholic, Non-Alcoholic), By Consumption (Drinks, Shots, Mixers), By Nature (Conventional, Natural/Organic), By Flavour (Flavoured, Unflavoured), By Packaging (Bottles, Metal Cans, Pouches, Others), By Packaging Size (Small, Medium, Large), By End User (Teenagers, Adults, Geriatric), By Sales Channel (On-Trade, Off-Trade) ... Read more
|
Major Players
|
Spain Energy Drink Market Statistics, 2025
- Market Size Statistics
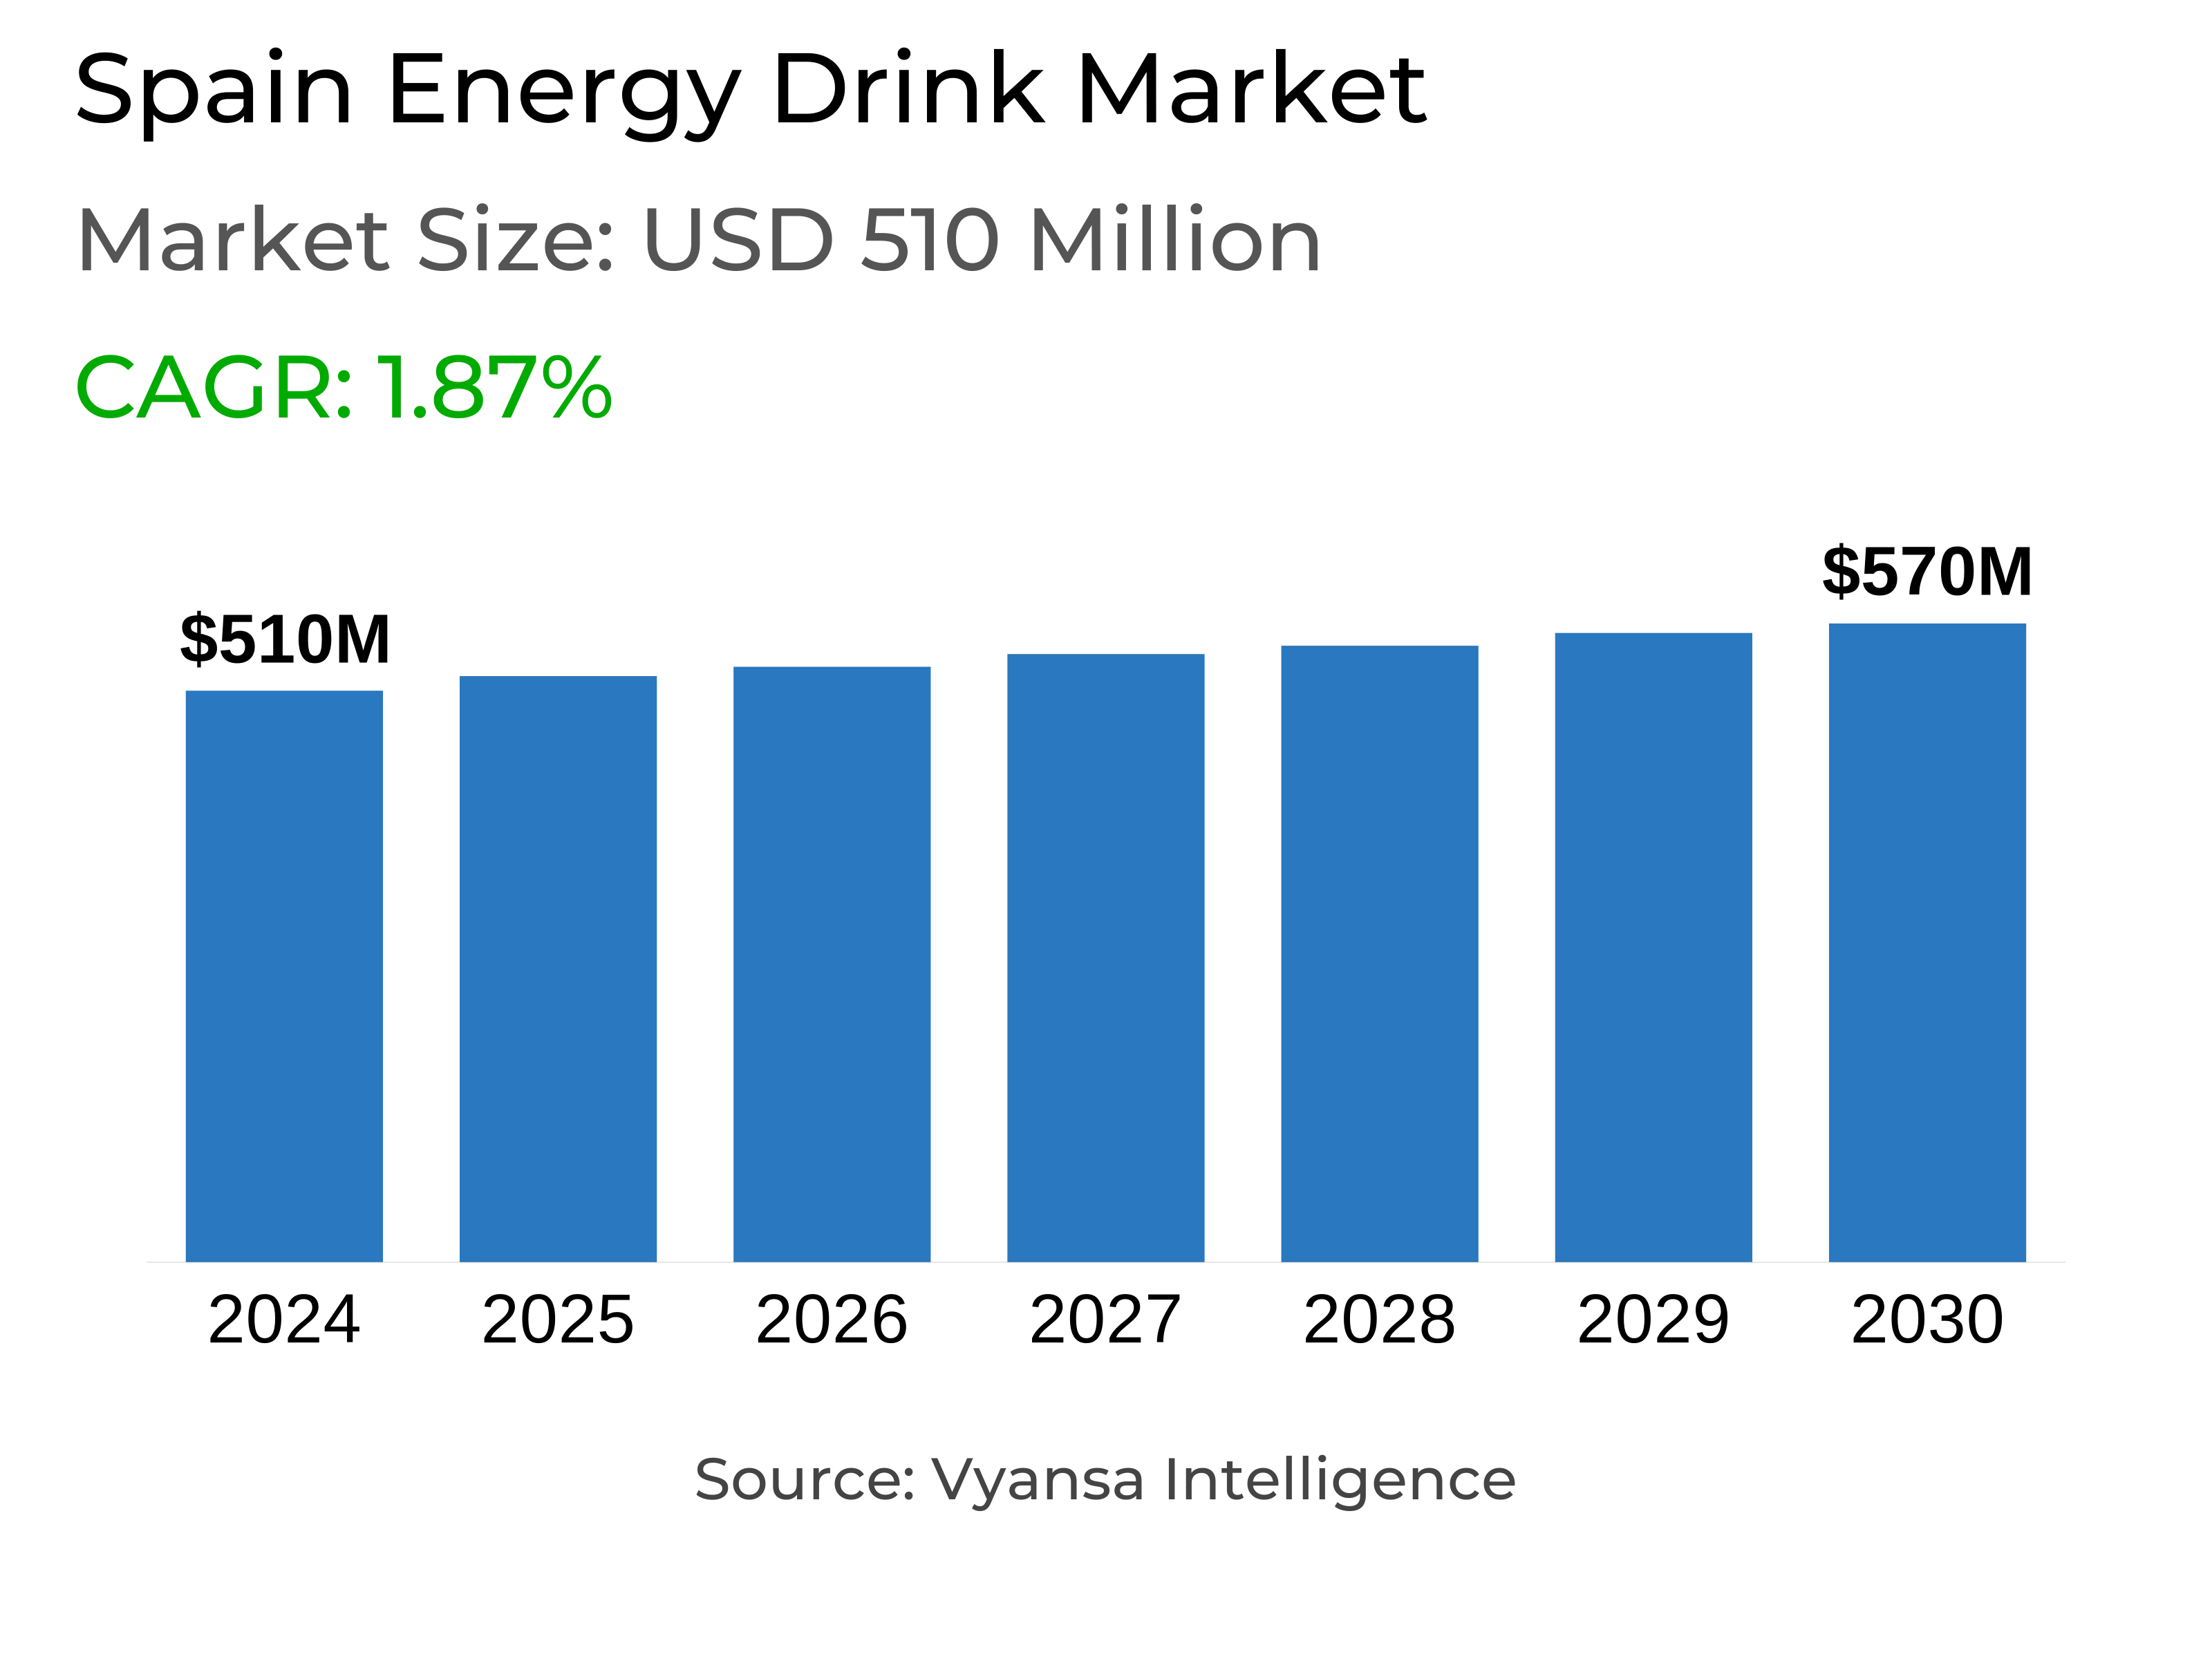
- Energy Drink in Spain is estimated at $ 510 Million.
- The market size is expected to grow to $ 570 Million by 2030.
- Market to register a CAGR of around 1.87% during 2025-30.
- Product Shares
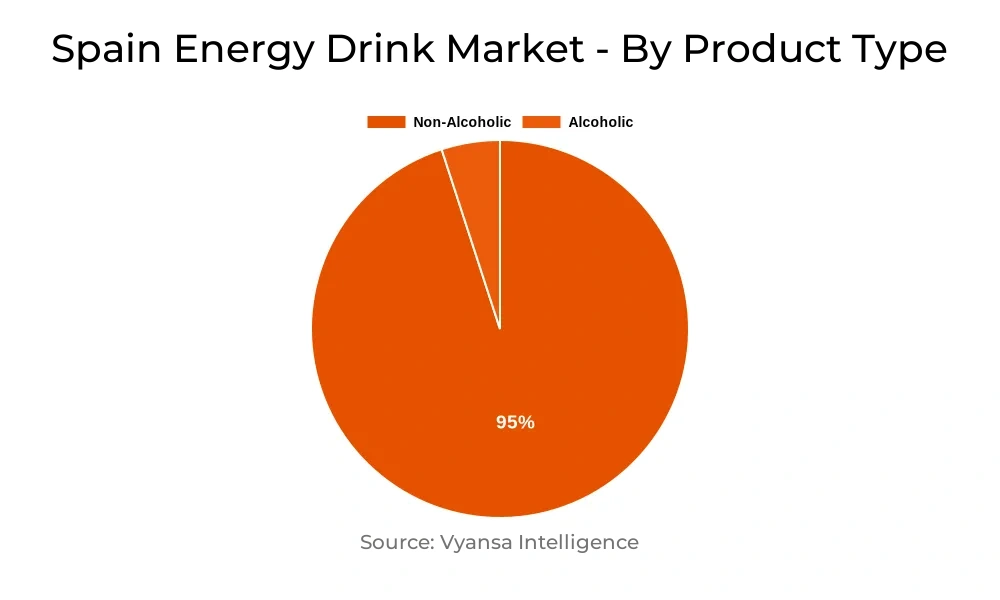
- Non Alcoholic Energy Drinks grabbed market share of 95%.
- Non Alcoholic Energy Drinks to witness a volume CAGR of around 2.71%.
- Competition
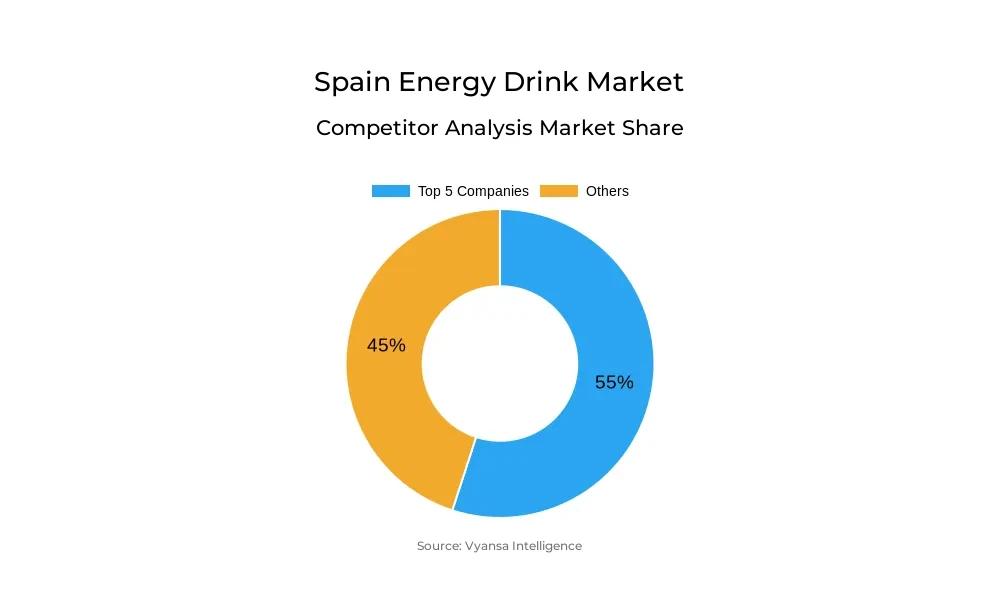
- More than 10 companies are actively engaged in producing Energy Drink in Spain.
- Top 5 companies acquired 55% of the market share.
- Vitamin Drinks SL, Frinton Distribuciones SL, PepsiCo Foods AIE, Red Bull España SA, Cía Servicios de Bebidas etc., are few of the top companies.
- Sales Channel
- Off-Trade grabbed 70% of the market.
Spain Energy Drink Market Outlook
The Spanish energy drinks market will continue steady growth from 2025 to 2030 based on sustained consumer demand and constant product innovation. Following strong performance in 2024, particularly via the off-trade channel, reduced sugar and functional varieties are set to lead expansion in the future. These formats are performing well among health-aware consumers who opt for low-calorie solutions and also enable brands to reach new audiences.
Brands will likely keep innovating with flavor and health-focused features, such as vitamin- or other functional ingredient-enriched products. This would help drive appeals to the older consumer, whose penetration in the category is still low. Yet the category's core base of primarily young men will still be key, particularly with many brands having segmented products to this group through limited edition collectibles and new flavors.
Even with positive growth drivers, regulatory changes could pose headwinds. Regional moves, such as Galicia's prohibition on energy drinks for young people, reflect a wider trend towards stricter regulation. If additional regions move to enact similar legislation, particularly bans on advertising and sale to under-18s, this would hit volume sales, especially among the most dynamic consumer segment.
Overall, prospects for the Spanish energy drinks market look positive, although growth will depend upon the sector being able to expand consumer numbers while learning to live with possible legislative constraints. Brands concentrating on low sugar and functional lines will have the best prospects of maintaining long-term demand.
Spain Energy Drink Market Challenge
One of the greatest challenges for energy drink companies will be broadening their consumer base outside of the traditional core demographic. Among Spaniards, younger males are primarily the drinkers of energy drinks, especially those aged between 15 and 24. While usage declines precipitously with age, only 3% of those aged 55 to 64 reported consuming an energy drink in the last 30 days. This poses the challenge for brands to not only hold on to younger consumers as they grow older but to also gain older consumers.
In order to increase in the next few years, the category needs to be appealing to a wider market. Unfortunately, most marketing efforts today are going to younger consumers. Energy drinks are still commonly regarded as containing too much sugar and caffeine. It will be necessary to shift this image, perhaps through added functional benefits within products or through lower-sugar offerings that resonate with the increasing health and wellness movement.
Spain Energy Drink Market Trend
Spanish brands have put special emphasis on new product development to keep pace with shifting consumer tastes in recent years, a trend which is likely to run in 2025-30. In 2024, customers were highly interested in low-sugar energy drinks, new flavor editions, and limited-edition releases. Brands such as Eneryeti Pera, Monster Ultra Gold, and Nocco Blood Orange were released in this low-sugar thrust, targeting health-driven purchasers.
Beyond sugar reduction, brands also introduced creative formats to engage younger consumers. For example, Eneryeti launched a collectable edition of its Original range during the EURO 2024 football tournament, with packaging featuring 16 different Spanish players. Another innovation, Eneryeti’s Dragon flavour, included dragon fruit to keep the range exciting. These launches reflect how brands are actively seeking to retain consumer attention and drive continued interest in their offerings.
Unlock Market Intelligence
Explore the market potential with our data-driven report
Spain Energy Drink Market Opportunity
Increasing demand for lower sugar products is generating high opportunities for energy drink brands to increase their consumer base in Spain. As health-aware consumers increasingly look for low-calorie versions of conventional soft drinks, lower sugar energy drinks are gaining appeal—particularly for consumers seeking a boost of energy without the need for coffee. During 2025-2030, this segment will expand more rapidly than standard variants, driven by consumer demand and sustained product innovation, which already started gaining traction in 2024.
In addition to sugar reduction, another growth area is the provision of functional benefits. One of the challenges for brands will be to persuade older consumers to opt for energy drinks instead of coffee or soft drinks. Examples such as Parkour Energy Drink, launched in 2024 containing vitamin B6 and B12, indicate the potential for functional energy drinks. Such innovations should find favor over the forecast period.
| Report Coverage | Details |
|---|---|
| Market Forecast | 2025-30 |
| USD Value 2024 | $ 510 Million |
| USD Value 2030 | $ 570 Million |
| CAGR 2025-2030 | 1.87% |
| Largest Category | Non Alcoholic Energy Drinks segment leads with 95% market share |
| Top Challenges | Challenge to Expand the Consumer Base Beyond the Core Demographic |
| Top Trends | Growing Focus on Innovation |
| Top Opportunities | Rising Demand for Reduced Sugar and Functional Energy Drinks |
| Key Players | Vitamin Drinks SL, Frinton Distribuciones SL, PepsiCo Foods AIE, Red Bull España SA, Cía Servicios de Bebidas, Mercadona SA, Eneryeti Company SL, Centros Comerciales Carrefour SA, Grupo Osborne SA, Rockstar, Inc and Others. |
Unlock Market Intelligence
Explore the market potential with our data-driven report
Spain Energy Drink Market Segmentation Analysis
The most important segment by market share among the end users is teenagers, who continue to fuel most of the energy drink consumption in Spain. They are perceived as the "traditional" consumer, better represented by males than females. Teenagers have been the target of energy drink brands for a long time, and they have played a major role in predicting volume sales and market expansion during recent years.
Yet this market leadership might be challenged by escalating regulatory issues. Spain can anticipate greater legislative measures restricting the sale of energy drinks to children, particularly in light of concerns over consumption with alcohol. Xunta de Galicia has also prohibited the selling and marketing of energy drinks to those under 18. If other regions also embrace such regulations, this might affect the market by limiting access and demand for one of its biggest consumer bases.
Top Companies in Spain Energy Drink Market
The top companies operating in the market include Vitamin Drinks SL, Frinton Distribuciones SL, PepsiCo Foods AIE, Red Bull España SA, Cía Servicios de Bebidas, Mercadona SA, Eneryeti Company SL, Centros Comerciales Carrefour SA, Grupo Osborne SA, Rockstar, Inc, etc., are the top players operating in the Spain Energy Drink Market.
Frequently Asked Questions
Related Report
1. Market Segmentation
1.1. Research Scope
1.2. Research Methodology
1.3. Definitions and Assumptions
2. Executive Summary
3. Spain Energy Drinks Market Policies, Regulations, and Standards
4. Spain Energy Drinks Market Dynamics
4.1. Growth Factors
4.2. Challenges
4.3. Trends
4.4. Opportunities
5. Spain Energy Drinks Market Statistics, 2020-2030F
5.1. Market Size & Growth Outlook
5.1.1.By Revenues in US$ Million
5.1.2.By Quantity Sold (Million Liters)
5.2. Market Segmentation & Growth Outlook
5.2.1.By Product Type
5.2.1.1. Alcoholic- Market Insights and Forecast 2020-2030, USD Million
5.2.1.2. Non-Alcoholic- Market Insights and Forecast 2020-2030, USD Million
5.2.2.By Consumption
5.2.2.1. Drinks- Market Insights and Forecast 2020-2030, USD Million
5.2.2.2. Shots- Market Insights and Forecast 2020-2030, USD Million
5.2.2.3. Mixers- Market Insights and Forecast 2020-2030, USD Million
5.2.3.By Nature
5.2.3.1. Conventional- Market Insights and Forecast 2020-2030, USD Million
5.2.3.2. Natural/Organic- Market Insights and Forecast 2020-2030, USD Million
5.2.4.By Flavour
5.2.4.1. Flavoured- Market Insights and Forecast 2020-2030, USD Million
5.2.4.2. Unflavoured- Market Insights and Forecast 2020-2030, USD Million
5.2.5.By Packaging
5.2.5.1. Bottles- Market Insights and Forecast 2020-2030, USD Million
5.2.5.1.1. PET Bottles- Market Insights and Forecast 2020-2030, USD Million
5.2.5.1.2. Glass Bottles- Market Insights and Forecast 2020-2030, USD Million
5.2.5.2. Metal Cans- Market Insights and Forecast 2020-2030, USD Million
5.2.5.3. Pouches- Market Insights and Forecast 2020-2030, USD Million
5.2.5.4. Others- Market Insights and Forecast 2020-2030, USD Million
5.2.6.By Packaging Size
5.2.6.1. Small- Market Insights and Forecast 2020-2030, USD Million
5.2.6.2. Medium- Market Insights and Forecast 2020-2030, USD Million
5.2.6.3. Large- Market Insights and Forecast 2020-2030, USD Million
5.2.7.By End User
5.2.7.1. Teenagers- Market Insights and Forecast 2020-2030, USD Million
5.2.7.2. Adults- Market Insights and Forecast 2020-2030, USD Million
5.2.7.3. Geriatric- Market Insights and Forecast 2020-2030, USD Million
5.2.8.By Sales Channel
5.2.8.1. On-Trade- Market Insights and Forecast 2020-2030, USD Million
5.2.8.2. Off-Trade- Market Insights and Forecast 2020-2030, USD Million
5.2.9.By Competitors
5.2.9.1. Competition Characteristics
5.2.9.2. Market Share & Analysis
6. Spain Alcoholic Energy Drinks Market Outlook, 2020-2030F
6.1. Market Size & Growth Outlook
6.1.1.By Revenues in US$ Million
6.1.2.By Quantity Sold (Million Liters)
6.2. Market Segmentation & Growth Outlook
6.2.1.By Consumption- Market Insights and Forecast 2020-2030, USD Million
6.2.2.By Nature- Market Insights and Forecast 2020-2030, USD Million
6.2.3.By Flavour- Market Insights and Forecast 2020-2030, USD Million
6.2.4.By Packaging- Market Insights and Forecast 2020-2030, USD Million
6.2.5.By Packaging Size- Market Insights and Forecast 2020-2030, USD Million
6.2.6.By End Users- Market Insights and Forecast 2020-2030, USD Million
6.2.7.By Sales Channel- Market Insights and Forecast 2020-2030, USD Million
7. Spain Non-Alcoholic Energy Drinks Market Outlook, 2020-2030F
7.1. Market Size & Growth Outlook
7.1.1.By Revenues in US$ Million
7.1.2.By Quantity Sold (Million Liters)
7.2. Market Segmentation & Growth Outlook
7.2.1.By Consumption- Market Insights and Forecast 2020-2030, USD Million
7.2.2.By Nature- Market Insights and Forecast 2020-2030, USD Million
7.2.3.By Flavour- Market Insights and Forecast 2020-2030, USD Million
7.2.4.By Packaging- Market Insights and Forecast 2020-2030, USD Million
7.2.5.By Packaging Size- Market Insights and Forecast 2020-2030, USD Million
7.2.6.By End Users- Market Insights and Forecast 2020-2030, USD Million
7.2.7.By Sales Channel- Market Insights and Forecast 2020-2030, USD Million
8. Competitive Outlook
8.1. Company Profiles
8.1.1.Red Bull España SA
8.1.1.1. Business Description
8.1.1.2. Product Portfolio
8.1.1.3. Collaborations & Alliances
8.1.1.4. Recent Developments
8.1.1.5. Financial Details
8.1.1.6. Others
8.1.2.Cía Servicios de Bebidas
8.1.2.1. Business Description
8.1.2.2. Product Portfolio
8.1.2.3. Collaborations & Alliances
8.1.2.4. Recent Developments
8.1.2.5. Financial Details
8.1.2.6. Others
8.1.3.Mercadona SA
8.1.3.1. Business Description
8.1.3.2. Product Portfolio
8.1.3.3. Collaborations & Alliances
8.1.3.4. Recent Developments
8.1.3.5. Financial Details
8.1.3.6. Others
8.1.4.Eneryeti Company SL
8.1.4.1. Business Description
8.1.4.2. Product Portfolio
8.1.4.3. Collaborations & Alliances
8.1.4.4. Recent Developments
8.1.4.5. Financial Details
8.1.4.6. Others
8.1.5.Centros Comerciales Carrefour SA
8.1.5.1. Business Description
8.1.5.2. Product Portfolio
8.1.5.3. Collaborations & Alliances
8.1.5.4. Recent Developments
8.1.5.5. Financial Details
8.1.5.6. Others
8.1.6.Vitamin Drinks SL
8.1.6.1. Business Description
8.1.6.2. Product Portfolio
8.1.6.3. Collaborations & Alliances
8.1.6.4. Recent Developments
8.1.6.5. Financial Details
8.1.6.6. Others
8.1.7.Frinton Distribuciones SL
8.1.7.1. Business Description
8.1.7.2. Product Portfolio
8.1.7.3. Collaborations & Alliances
8.1.7.4. Recent Developments
8.1.7.5. Financial Details
8.1.7.6. Others
8.1.8.PepsiCo Foods AIE
8.1.8.1. Business Description
8.1.8.2. Product Portfolio
8.1.8.3. Collaborations & Alliances
8.1.8.4. Recent Developments
8.1.8.5. Financial Details
8.1.8.6. Others
8.1.9.Grupo Osborne SA
8.1.9.1. Business Description
8.1.9.2. Product Portfolio
8.1.9.3. Collaborations & Alliances
8.1.9.4. Recent Developments
8.1.9.5. Financial Details
8.1.9.6. Others
8.1.10. Rockstar, Inc
8.1.10.1. Business Description
8.1.10.2. Product Portfolio
8.1.10.3. Collaborations & Alliances
8.1.10.4. Recent Developments
8.1.10.5. Financial Details
8.1.10.6. Others
9. Disclaimer
| Segment | Sub-Segment |
|---|---|
| By Product Type |
|
| By Consumption |
|
| By Nature |
|
| By Flavour |
|
| By Packaging |
|
| By Packaging Size |
|
| By End User |
|
| By Sales Channel |
|
Research Methodology
This study followed a structured approach comprising four key phases to assess the size and scope of the electro-oxidation market. The process began with thorough secondary research to collect data on the target market, related markets, and broader industry context. These findings, along with preliminary assumptions and estimates, were then validated through extensive primary research involving industry experts from across the value chain. To calculate the overall market size, both top-down and bottom-up methodologies were employed. Finally, market segmentation and data triangulation techniques were applied to refine and validate segment-level estimations.
Secondary Research
The secondary research phase involved gathering data from a wide range of credible and published sources. This step helped in identifying industry trends, defining market segmentation, and understanding the market landscape and value chain.
Sources consulted during this phase included:
- Company annual reports, investor presentations, and press releases
- Industry white papers and certified publications
- Trade directories and market-recognized databases
- Articles from authoritative authors and reputable journals
- Gold and silver standard websites
Secondary research was critical in mapping out the industry's value chain and monetary flow, identifying key market segments, understanding regional variations, and tracking significant industry developments.
Other key sources:
- Financial disclosures
- Industry associations and trade bodies
- News outlets and business magazines
- Academic journals and research studies
- Paid industry databases
Primary Research
To validate secondary data and gain deeper market insights, primary research was conducted with key stakeholders across both the supply and demand sides of the market.
On the demand side, participants included decision-makers and influencers from end-user industries—such as CIOs, CTOs, and CSOs—who provided first-hand perspectives on market needs, product usage, and future expectations.
On the supply side, interviews were conducted with manufacturers, industry associations, and institutional participants to gather insights into current offerings, product pipelines, and market challenges.
Primary interviews provided critical inputs such as:
- Market size and revenue data
- Product and service breakdowns
- Market forecasts
- Regional and application-specific trends
Stakeholders consulted included:
- Leading OEM and solution providers
- Channel and distribution partners
- End users across various applications
- Independent consultants and industry specialists
Market Size Estimation and Data Triangulation
- Identifying Key Market Participants (Secondary Research)
- Goal: To identify the major players or companies in the target market. This typically involves using publicly available data sources such as industry reports, market research publications, and financial statements of companies.
- Tools: Reports from firms like Gartner, Forrester, Euromonitor, Statista, IBISWorld, and others. Public financial statements, news articles, and press releases from top market players.
- Extracting Earnings of Key Market Participants
- Goal: To estimate the earnings generated from the product or service being analyzed. This step helps in understanding the revenue potential of each market player in a specific geography.
- Methods: Earnings data can be gathered from:
- Publicly available financial reports (for listed companies).
- Interviews and primary data sources from professionals, such as Directors, VPs, SVPs, etc. This is especially useful for understanding more nuanced, internal data that isn't publicly disclosed.
- Annual reports and investor presentations of key players.
- Data Collation and Development of a Relevant Data Model
- Goal: To collate inputs from both primary and secondary sources into a structured, data-driven model for market estimation. This model will incorporate key market KPIs and any independent variables relevant to the market.
- Key KPIs: These could include:
- Market size, growth rate, and demand drivers.
- Industry-specific metrics like market share, average revenue per customer (ARPC), or average deal size.
- External variables, such as economic growth rates, inflation rates, or commodity prices, that could affect the market.
- Data Modeling: Based on this data, the market forecasts are developed for the next 5 years. A combination of trend analysis, scenario modeling, and statistical regression might be used to generate projections.
- Scenario Analysis
- Goal: To test different assumptions and validate how sensitive the market is to changes in key variables (e.g., market demand, regulatory changes, technological disruptions).
- Types of Scenarios:
- Base Case: Based on current assumptions and historical data.
- Best-Case Scenario: Assuming favorable market conditions, regulatory environments, and technological advancements.
- Worst-Case Scenario: Accounting for adverse factors, such as economic downturns, stricter regulations, or unexpected disruptions.


