Spain Alcoholic Drinks Market Report: Trends, Growth and Forecast (2026-2032)
By Type (Beer, Cider/Perry, RTDs, Spirits, Wine), By Alcohol Content (High, Medium, Low), By Flavor (Unflavored, Flavored), By Packaging Type (Glass Bottles, Tins, Plastic Bottles, Others), By Sales Channel (On-Trade, Off-Trade (Retail Offline, Retail Online)) ... Read more

|
Major Players
|
Spain Alcoholic Drinks Market Statistics and Insights, 2026
- Market Size Statistics
- Alcoholic Drinks in Spain is estimated at $ 44.16 Billion.
- The market size is expected to grow to $ 47.19 Billion by 2032.
- Market to register a CAGR of around 0.95% during 2026-32.
- Type Shares
- Beer grabbed market share of 54%.
- Beer to witness a volume CAGR of around 0.28%.
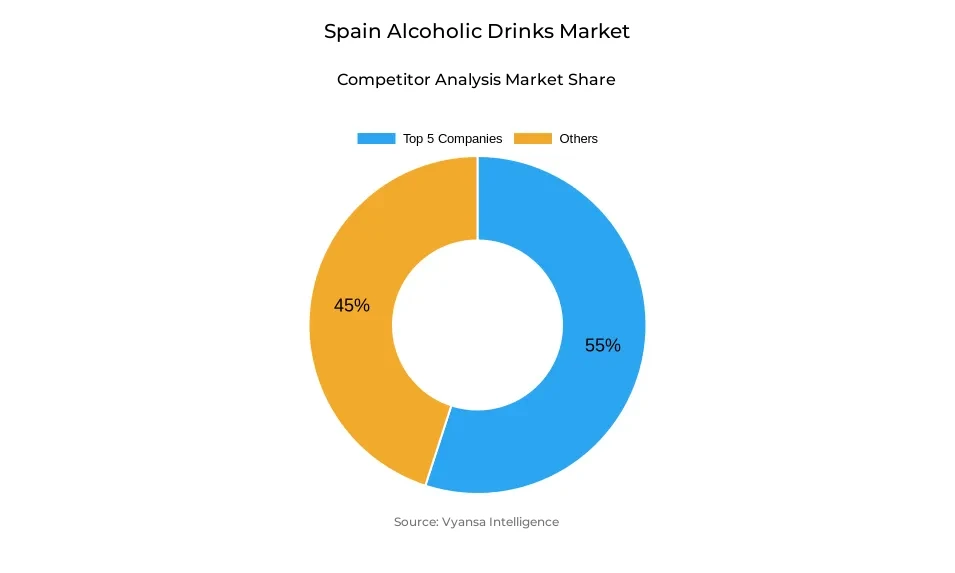
- Competition
- More than 10 companies are actively engaged in producing Alcoholic Drinks in Spain.
- Top 5 companies acquired 55% of the market share.
- J García Carrión SA, Agora SA, Pernod Ricard Groupe, Grupo Mahou-San Miguel SA, Heineken NV etc., are few of the top companies.
- Sales Channel
- On-Trade grabbed 80% of the market.
Spain Alcoholic Drinks Market Outlook
The Spain Alcoholic Drinks market is projected at $44.16 Billion in 2025 and is likely to grow to $47.19 Billion by 2032. Notwithstanding general stagnation in total volume sales, the market will experience consistent value growth because of changing end user trends. Beer is still the largest category, with forecast volume CAGR of approximately 0.28%, underpinned by both the core consumption and growing low alcohol and non-alcoholic versions. The impact of international travel and Spain good on-trade culture will remain the driver for beer and total Alcoholic Drinks sales, with the on-trade distribution channel taking up 80% of the market.
Health-conscious consumption will drive the market to a great extent. Younger generations are opting for low alcohol, non-alcoholic, and moderate-consumption brands, as well as prioritizing quality over quantity. RTDs (ready-to-drink beverages) will be likely to experience lively growth, with new tastes, easy formats, and premium products enticing Millennials and Generation Z. At the same time, premiumisation within spirits, wine, and craft beer will continue, as end users are looking for distinctive experiences and willing to pay for quality.
Sustainability and responsible consumption will continue to be major market drivers. End users are increasingly looking for products with environmentally friendly packaging, organic products, and open labeling. Firms will be anticipated to invest in green manufacturing, while still encouraging moderate and responsible drinking. These considerations will also drive product innovation, as breweries, distilleries, and spirits companies develop new innovative, health-focused, and sustainable products.
Distribution and retailing will persist in their development, with on-trade channels prevailing as a result of Spain's consumption patterns driven by culture and tourism. Convenience and online retailing will support traditional retail, particularly in the case of RTDs, premium drink, and low-alcohol products. On balance, the market will hold firm in balancing volume growth in moderation with sustained value growth, prioritizing quality, convenience, and sustainability to appeal to end users.
Spain Alcoholic Drinks Market Growth Driver
Rising Health Consciousness Among End Users
Growing health consciousness among end users is increasingly shaping overall alcohol consumption in Spain. End users are becoming more conscientious about the alcohol and food they consume, so they tend to choose drinks with less alcohol or opt for non-alcoholic drinks. This is particularly evident among the younger age groups, who go out of their way to seek healthier lifestyle options but still wish to engage in social drinking activities.
The increasing popularity of low alcohol and non-alcoholic beers, RTDs, and other moderate drink options is stimulating the Alcoholic Drinks market. People value quality over quantity and select beverages that enable them to participate in social activities without jeopardizing their wellness objectives. This emphasis on healthy consumption is influencing product innovation and prompting beverage firms to innovate and broaden their portfolios to address changing tastes.
Spain Alcoholic Drinks Market Trend
Growing Preference for Low- and Non-Alcoholic Beverages
Younger end users in Spain increasingly turn to low alcohol and non-alcoholic drinks, displacing the conventional high-alcohol beverages. Millennials and Generation Z are distinctly moderate in their inclinations, mirroring evolving social practices and awareness regarding health. The trend occurs across categories, with beer, wine, and spirits all reflecting movement toward low-alcohol options and RTDs.
The cultural shift towards mindful drinking also promotes new drinking sessions, such as afternoons or after-work gatherings, rather than late-night, long-duration events. This transition influences what is being drunk and how it is innovated in convenient and refreshing formats. Products emphasizing energy boosts and health benefits, along with shifting cocktail fads, further support this directional shift in end user behavior.
Unlock Market Intelligence
Explore the market potential with our data-driven report
Spain Alcoholic Drinks Market Opportunity
Expansion Through Premium and Personalized Offerings
The Spain Alcoholic Drinks Market offers high potential for expansion via innovation in premium and customized products. End users increasingly want to experience something special, like craft beers, artisanal spirits, and tailored products like Mahou's YouBrew. Such products offer the choice of quality over quantity and resonate with changing health-oriented and lifestyle-driven consumption trends.
RTD growth in the future will be fueled by increasing RTD offerings, including alcohol-free versions, which appeal to young end users who demand convenience and new flavors. Sustainable production, local sourcing, and handcrafted processing will contribute further to distinction. Companies that invest in customized, high-quality, and innovative offerings are set to appeal to end user attention and build brand loyalty in Spain's changing Alcoholic Drinks market.
Unlock Market Intelligence
Explore the market potential with our data-driven report
Spain Alcoholic Drinks Market Segmentation Analysis

By Type
- Beer
- Cider/Perry
- RTDs
- Spirits
- Wine
The segment with highest market share under the type segment is beer, at 54% of the total market for Alcoholic Drinks in Spain. Beer is the best-selling Alcoholic Drinks , fueled by domestic tastes and foreign tourism. Local consumption of beer continues to decrease marginally, although sales of Clara, craft beers, and non/low alcohol drinks are increasing due to the increasing popularity of healthier choices and the trend towards moderation.
During the forecast period, beer is poised to record a moderate volume CAGR of approximately 0.28%. Even with gradual growth in core categories, the segment is supported by trends like low-alcohol and non-alcoholic beers, ready-to-drink, and experiential occasions such as Mahou's YouBrew. Such innovations support end user engagement as well as cater to shifting tastes for healthier, premium, and convenient drinks.
By Sales Channel
- On-Trade
- Off-Trade
The segment with highest market share under sales channel is on-trade, claiming approximately 80% of the Spain Alcoholic Drinks market. On-trade consumption still beats off-trade sales due to Spain social history of enjoying drinks in bars, restaurants, and cafés. International tourism's heavy inflow further increases hospitality sales, keeping beer, wine, and spirits at the heart of social events like aperitifs and tapas.
During the forecast period, on-trade is set to continue its stronghold as the main channel of Alcoholic Drinks. It is fueled by the convergence of increasing tourism, developing end user tastes for low-strength and ready-to-drink products, as well as the ongoing popularity of socialising away from home. The segment is aided by convenience, different experiences, and premiumisation, and is therefore the main driver of Spain Alcoholic Drinks market resilience.
Top Companies in Spain Alcoholic Drinks Market
The top companies operating in the market include J García Carrión SA, Agora SA, Pernod Ricard Groupe, Grupo Mahou-San Miguel SA, Heineken NV, Damm SA, Hijos de Rivera SA, Anheuser-Busch InBev NV, Mahou SA, Suntory Holdings Ltd, etc., are the top players operating in the Spain Alcoholic Drinks Market.
Frequently Asked Questions
Related Report
1. Market Segmentation
1.1. Research Scope
1.2. Research Methodology
1.3. Definitions and Assumptions
2. Executive Summary
3. Spain Alcoholic Drinks Market Policies, Regulations, and Standards
4. Spain Alcoholic Drinks Market Dynamics
4.1. Growth Factors
4.2. Challenges
4.3. Trends
4.4. Opportunities
5. Spain Alcoholic Drinks Market Statistics, 2022-2032F
5.1. Market Size & Growth Outlook
5.1.1. By Revenues in US$ Million
5.1.2. By Quantity Sold in Million Litres
5.2. Market Segmentation & Growth Outlook
5.2.1. By Type
5.2.1.1. Beer- Market Insights and Forecast 2022-2032, USD Million
5.2.1.2. Cider/Perry- Market Insights and Forecast 2022-2032, USD Million
5.2.1.3. RTDs- Market Insights and Forecast 2022-2032, USD Million
5.2.1.4. Spirits- Market Insights and Forecast 2022-2032, USD Million
5.2.1.5. Wine- Market Insights and Forecast 2022-2032, USD Million
5.2.2. By Alcohol Content
5.2.2.1. High- Market Insights and Forecast 2022-2032, USD Million
5.2.2.2. Medium- Market Insights and Forecast 2022-2032, USD Million
5.2.2.3. Low- Market Insights and Forecast 2022-2032, USD Million
5.2.3. By Flavor
5.2.3.1. Unflavored- Market Insights and Forecast 2022-2032, USD Million
5.2.3.2. Flavored- Market Insights and Forecast 2022-2032, USD Million
5.2.4. By Packaging Type
5.2.4.1. Glass Bottles- Market Insights and Forecast 2022-2032, USD Million
5.2.4.2. Tins- Market Insights and Forecast 2022-2032, USD Million
5.2.4.3. Plastic Bottles- Market Insights and Forecast 2022-2032, USD Million
5.2.4.4. Others- Market Insights and Forecast 2022-2032, USD Million
5.2.5. By Sales Channel
5.2.5.1. On-Trade- Market Insights and Forecast 2022-2032, USD Million
5.2.5.2. Off-Trade- Market Insights and Forecast 2022-2032, USD Million
5.2.5.2.1. Retail Offline- Market Insights and Forecast 2022-2032, USD Million
5.2.5.2.2. Retail Online- Market Insights and Forecast 2022-2032, USD Million
5.2.6. By Competitors
5.2.6.1. Competition Characteristics
5.2.6.2. Market Share & Analysis
6. Spain Beer Market Statistics, 2022-2032F
6.1. Market Size & Growth Outlook
6.1.1. By Revenues in US$ Million
6.1.2. By Quantity Sold in Million Litres
6.2. Market Segmentation & Growth Outlook
6.2.1. By Alcohol Content- Market Insights and Forecast 2022-2032, USD Million
6.2.2. By Flavor- Market Insights and Forecast 2022-2032, USD Million
6.2.3. By Packaging Type- Market Insights and Forecast 2022-2032, USD Million
6.2.4. By Sales Channel- Market Insights and Forecast 2022-2032, USD Million
7. Spain Cider/Perry Market Statistics, 2022-2032F
7.1. Market Size & Growth Outlook
7.1.1. By Revenues in US$ Million
7.1.2. By Quantity Sold in Million Litres
7.2. Market Segmentation & Growth Outlook
7.2.1. By Alcohol Content- Market Insights and Forecast 2022-2032, USD Million
7.2.2. By Flavor- Market Insights and Forecast 2022-2032, USD Million
7.2.3. By Packaging Type- Market Insights and Forecast 2022-2032, USD Million
7.2.4. By Sales Channel- Market Insights and Forecast 2022-2032, USD Million
8. Spain Ready-to-Drink Market Statistics, 2022-2032F
8.1. Market Size & Growth Outlook
8.1.1. By Revenues in US$ Million
8.1.2. By Quantity Sold in Million Litres
8.2. Market Segmentation & Growth Outlook
8.2.1. By Alcohol Content- Market Insights and Forecast 2022-2032, USD Million
8.2.2. By Flavor- Market Insights and Forecast 2022-2032, USD Million
8.2.3. By Packaging Type- Market Insights and Forecast 2022-2032, USD Million
8.2.4. By Sales Channel- Market Insights and Forecast 2022-2032, USD Million
9. Spain Spirits Market Statistics, 2022-2032F
9.1. Market Size & Growth Outlook
9.1.1. By Revenues in US$ Million
9.1.2. By Quantity Sold in Million Litres
9.2. Market Segmentation & Growth Outlook
9.2.1. By Alcohol Content- Market Insights and Forecast 2022-2032, USD Million
9.2.2. By Flavor- Market Insights and Forecast 2022-2032, USD Million
9.2.3. By Packaging Type- Market Insights and Forecast 2022-2032, USD Million
9.2.4. By Sales Channel- Market Insights and Forecast 2022-2032, USD Million
10. Spain Wine Market Statistics, 2022-2032F
10.1.Market Size & Growth Outlook
10.1.1. By Revenues in US$ Million
10.1.2. By Quantity Sold in Million Litres
10.2.Market Segmentation & Growth Outlook
10.2.1. By Alcohol Content- Market Insights and Forecast 2022-2032, USD Million
10.2.2. By Flavor- Market Insights and Forecast 2022-2032, USD Million
10.2.3. By Packaging Type- Market Insights and Forecast 2022-2032, USD Million
10.2.4. By Sales Channel- Market Insights and Forecast 2022-2032, USD Million
11. Competitive Outlook
11.1.Company Profiles
11.1.1. Grupo Mahou-San Miguel SA
11.1.1.1. Business Description
11.1.1.2. Product Portfolio
11.1.1.3. Collaborations & Alliances
11.1.1.4. Recent Developments
11.1.1.5. Financial Details
11.1.1.6. Others
11.1.2. Heineken NV
11.1.2.1. Business Description
11.1.2.2. Product Portfolio
11.1.2.3. Collaborations & Alliances
11.1.2.4. Recent Developments
11.1.2.5. Financial Details
11.1.2.6. Others
11.1.3. Damm SA
11.1.3.1. Business Description
11.1.3.2. Product Portfolio
11.1.3.3. Collaborations & Alliances
11.1.3.4. Recent Developments
11.1.3.5. Financial Details
11.1.3.6. Others
11.1.4. Hijos de Rivera SA
11.1.4.1. Business Description
11.1.4.2. Product Portfolio
11.1.4.3. Collaborations & Alliances
11.1.4.4. Recent Developments
11.1.4.5. Financial Details
11.1.4.6. Others
11.1.5. Anheuser-Busch InBev NV
11.1.5.1. Business Description
11.1.5.2. Product Portfolio
11.1.5.3. Collaborations & Alliances
11.1.5.4. Recent Developments
11.1.5.5. Financial Details
11.1.5.6. Others
11.1.6. J García Carrión SA
11.1.6.1. Business Description
11.1.6.2. Product Portfolio
11.1.6.3. Collaborations & Alliances
11.1.6.4. Recent Developments
11.1.6.5. Financial Details
11.1.6.6. Others
11.1.7. Agora SA
11.1.7.1. Business Description
11.1.7.2. Product Portfolio
11.1.7.3. Collaborations & Alliances
11.1.7.4. Recent Developments
11.1.7.5. Financial Details
11.1.7.6. Others
11.1.8. Pernod Ricard Groupe
11.1.8.1. Business Description
11.1.8.2. Product Portfolio
11.1.8.3. Collaborations & Alliances
11.1.8.4. Recent Developments
11.1.8.5. Financial Details
11.1.8.6. Others
11.1.9. Mahou SA
11.1.9.1. Business Description
11.1.9.2. Product Portfolio
11.1.9.3. Collaborations & Alliances
11.1.9.4. Recent Developments
11.1.9.5. Financial Details
11.1.9.6. Others
11.1.10. Suntory Holdings Ltd
11.1.10.1. Business Description
11.1.10.2. Product Portfolio
11.1.10.3. Collaborations & Alliances
11.1.10.4. Recent Developments
11.1.10.5. Financial Details
11.1.10.6. Others
12. Disclaimer
| Segment | Sub-Segment |
|---|---|
| By Type |
|
| By Alcohol Content |
|
| By Flavor |
|
| By Packaging Type |
|
| By Sales Channel |
|
Research Methodology
This study followed a structured approach comprising four key phases to assess the size and scope of the electro-oxidation market. The process began with thorough secondary research to collect data on the target market, related markets, and broader industry context. These findings, along with preliminary assumptions and estimates, were then validated through extensive primary research involving industry experts from across the value chain. To calculate the overall market size, both top-down and bottom-up methodologies were employed. Finally, market segmentation and data triangulation techniques were applied to refine and validate segment-level estimations.
Secondary Research
The secondary research phase involved gathering data from a wide range of credible and published sources. This step helped in identifying industry trends, defining market segmentation, and understanding the market landscape and value chain.
Sources consulted during this phase included:
- Company annual reports, investor presentations, and press releases
- Industry white papers and certified publications
- Trade directories and market-recognized databases
- Articles from authoritative authors and reputable journals
- Gold and silver standard websites
Secondary research was critical in mapping out the industry's value chain and monetary flow, identifying key market segments, understanding regional variations, and tracking significant industry developments.
Other key sources:
- Financial disclosures
- Industry associations and trade bodies
- News outlets and business magazines
- Academic journals and research studies
- Paid industry databases
Primary Research
To validate secondary data and gain deeper market insights, primary research was conducted with key stakeholders across both the supply and demand sides of the market.
On the demand side, participants included decision-makers and influencers from end-user industries—such as CIOs, CTOs, and CSOs—who provided first-hand perspectives on market needs, product usage, and future expectations.
On the supply side, interviews were conducted with manufacturers, industry associations, and institutional participants to gather insights into current offerings, product pipelines, and market challenges.
Primary interviews provided critical inputs such as:
- Market size and revenue data
- Product and service breakdowns
- Market forecasts
- Regional and application-specific trends
Stakeholders consulted included:
- Leading OEM and solution providers
- Channel and distribution partners
- End users across various applications
- Independent consultants and industry specialists
Market Size Estimation and Data Triangulation
- Identifying Key Market Participants (Secondary Research)
- Goal: To identify the major players or companies in the target market. This typically involves using publicly available data sources such as industry reports, market research publications, and financial statements of companies.
- Tools: Reports from firms like Gartner, Forrester, Euromonitor, Statista, IBISWorld, and others. Public financial statements, news articles, and press releases from top market players.
- Extracting Earnings of Key Market Participants
- Goal: To estimate the earnings generated from the product or service being analyzed. This step helps in understanding the revenue potential of each market player in a specific geography.
- Methods: Earnings data can be gathered from:
- Publicly available financial reports (for listed companies).
- Interviews and primary data sources from professionals, such as Directors, VPs, SVPs, etc. This is especially useful for understanding more nuanced, internal data that isn't publicly disclosed.
- Annual reports and investor presentations of key players.
- Data Collation and Development of a Relevant Data Model
- Goal: To collate inputs from both primary and secondary sources into a structured, data-driven model for market estimation. This model will incorporate key market KPIs and any independent variables relevant to the market.
- Key KPIs: These could include:
- Market size, growth rate, and demand drivers.
- Industry-specific metrics like market share, average revenue per customer (ARPC), or average deal size.
- External variables, such as economic growth rates, inflation rates, or commodity prices, that could affect the market.
- Data Modeling: Based on this data, the market forecasts are developed for the next 5 years. A combination of trend analysis, scenario modeling, and statistical regression might be used to generate projections.
- Scenario Analysis
- Goal: To test different assumptions and validate how sensitive the market is to changes in key variables (e.g., market demand, regulatory changes, technological disruptions).
- Types of Scenarios:
- Base Case: Based on current assumptions and historical data.
- Best-Case Scenario: Assuming favorable market conditions, regulatory environments, and technological advancements.
- Worst-Case Scenario: Accounting for adverse factors, such as economic downturns, stricter regulations, or unexpected disruptions.


