Hong Kong Alcoholic Drinks Market Report: Trends, Growth and Forecast (2026-2032)
By Type (Beer, Cider/Perry, RTDs, Spirits, Wine), By Alcohol Content (High, Medium, Low), By Flavor (Unflavored, Flavored), By Packaging Type (Glass Bottles, Tins, Plastic Bottles, Others), By Sales Channel (On-Trade, Off-Trade (Retail Offline, Retail Online)) ... Read more

|
Major Players
|
Hong KongAlcoholic Drinks Market Statistics and Insights, 2026
- Market Size Statistics
- Alcoholic Drinks in Hong kong is estimated at $ 3.52 Billion.
- The market size is expected to grow to $ 3.86 Billion by 2032.
- Market to register a CAGR of around 1.33% during 2026-32.
- Type Shares
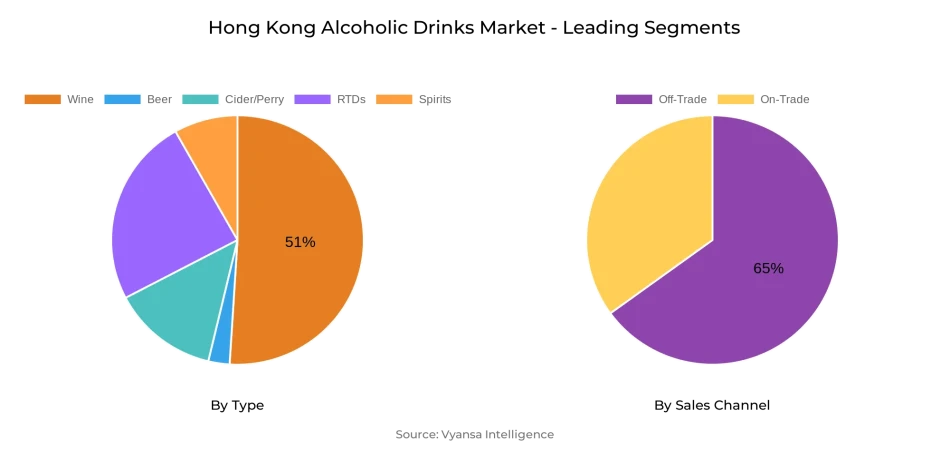
- Wine grabbed market share of 51%.
- Wine to witness a volume CAGR of around 1.93%.
- Competition
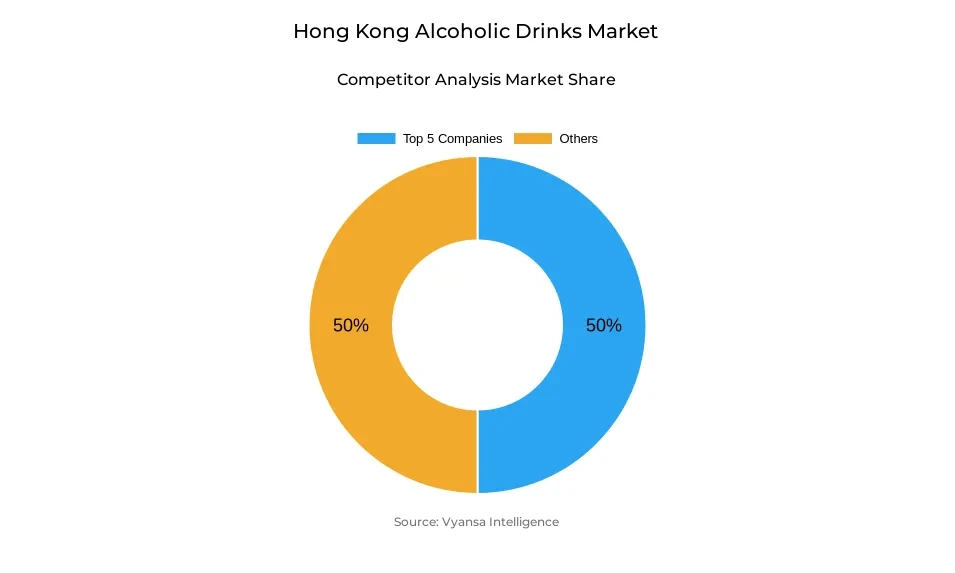
- More than 10 companies are actively engaged in producing Alcoholic Drinks in Hong Kong .
- Top 5 companies acquired 50% of the market share.
- Tsingtao Brewery Co Ltd, Pernod Ricard Groupe, Asahi Group Holdings Ltd, Carlsberg A/S, Jebsen & Co Ltd etc., are few of the top companies.
- Sales Channel
- Off-Trade grabbed 65% of the market.
Hong kong Alcoholic Drinks Market Outlook
The Hong Kong Alcoholic Drinks Market was USD 3.52 billion in 2025 and is expected to reach USD 3.86 billion by 2032. The growth in the next few years will be consistent, with the support coming from positive taxation laws, innovation, and shifting end users trends. Beer continued to be the biggest segment, demonstrating strength despite maturity in the market, owing to the economic recovery and increasing demand for craft beers. Spirits grew most dynamically, with growth being spurred by the government's lowering of tax imposed on strong liquors, which made premium products cheaper and prompted consumption on the spot.
Wine will increase at a steady rate with a forecast period volume CAGR of approximately 1.93%. Concurrently, low-alcohol and non-alcoholic versions like non-alcoholic beer, spirits, and Ready-to-Drink cocktails are also likely to find increasing popularity as health-oriented lifestyles continue to expand. Local brands and global players are keenly innovating with premium products and novel flavours like Chinese wines and locally positioned offerings to appeal to both young legal-age end users and old-time drinkers.
On the distribution front, the off-trade segment remained the most prominent, with 65% of the market in 2025. Supermarkets, convenience stores, and online sites are still key to distribution, as their extensive networks and regular promotions attract price-sensitive end users. On-trade channels have recovered with the return of tourists and local festivals, but will struggle to recover to pre-pandemic levels since many end users have adopted home drinking.
Going forward, the market will be supported by favorable government policy, growth in distribution infrastructure, and increased popularity of non-alcoholic and domestic-flavored beverages. In general, Hong Kong Alcoholic Drinks Market is poised to experience stable growth to 2032 based on a mixture of tradition, innovation, and changing end users trends.
Hong Kong Alcoholic Drinks Market Growth Driver
Tax Reforms Driving Market Growth
The decline in taxation of high-strength spirits is one of the key drivers of growth in the market. By reducing duty on premium spirits, the government puts such products within reach and incentivizes broader consumption. The shift alters consumption patterns, with people now buying high-quality spirits to consume straight up instead of just for collecting or speculation. Consequently, the demand for spirits grows strongly from a high base.
Such tax reform not only generates instant sales but also enhances Hong Kong's role as a regional center for spirits. With increased volumes of premium spirits trading, the establishment of logistics, warehouse, and distribution facilities also enhances. Such enhancements generate long-term efficiency, allowing other alcoholic beverage categories to gain from similar infrastructural support and further enhancing overall Market performance.
Hong Kong Alcoholic Drinks Market Trend
Health-Conscious Choices Reshaping Preferences
The increasing focus on wellness and health has a significant impact on end users behavior in the Market . Numerous people are becoming more conscious of the advantages of low or no-alcoholic drinking culture and are altering their consumption practices as a result. The popularity of non-alcoholic beer, spirits, and RTDs is just one evident result of this phenomenon, as these items provide end users with the experience and taste of drinking without the negative aspects of alcohol consumption.
This trend is transforming on-trade and retail spaces as well. Bars, convenience stores, and supermarkets are now devoting more space on their shelves to non/low-alcoholic options. Even local pubs are getting creative by introducing fruit-based non-alcoholic drinks, which also indicate rising demand in fine dining in turn. The choice is not only health-oriented but value-oriented too, since lower alcohol drinks are generally cheaper and hence appealing to price-sensitive but health-minded end users.
Unlock Market Intelligence
Explore the market potential with our data-driven report
Hong Kong Alcoholic Drinks Market Opportunity
Growing Demand for Local Flavors and Innovation
The growing popularity of local ingredients and flavors is expected to significantly influence the alcoholic drinks market, supporting wider end users acceptance and market growth. End users are more attracted to beverages that provide experiences that reflect cultural identity and locality. Distilleries and craft breweries employing retro botanicals and distinctive local elements will be anticipated to have strong acceptance among younger end users who prefer personalized and innovative choices.
This opportunity is also magnified as global and domestic brands invest in product development to distinguish themselves in a mature market. By infusing unique regional tastes into beers, spirits, and RTDs, businesses can differentiate products and enhance end users attachment. This lines up with the increasing experience-based consumption, keeping brands up to date while resonating with changing palates in the projection period.
Unlock Market Intelligence
Explore the market potential with our data-driven report
Hong Kong Alcoholic Drinks Market Segmentation Analysis
By Type
- Beer
- Cider/Perry
- RTDs
- Spirits
- Wine
The segment with highest market share under Type segments is Wine, which commanded 51% of Hong Kong Alcoholic Drinks Market. Wine continued to be a favorite among end users, backed by the city being a wine trading center and the ongoing popularity of both local and imported products. The maturity of the wine category, along with duty-free trends, has worked to maintain volume sales and further solidify its leadership position in overall market structure.
In the future, wine is expected to continue steady growth with a volume CAGR of approximately 1.93%. As competition from spirits and low/no alcoholic products is increasing, wine will also remain strong. Growing trends for premium and diverse categories, such as Chinese and Australian wines, will further drive end users demand and strengthen the strong share of wine in Hong Kong's Alcoholic Drinks Market .
By Sales Channel
- On-Trade
- Off-Trade
The segment with highest market share under Sales Channel is Off-Trade, with 65% of share. Convenience stores and supermarkets have remained the end users favorite shopping locations because they offer immediacy, accessibility, and affordability of drinking at home. Even post-pandemic, the culture of drinking at home has been prevalent, which further increased off-trade supremacy.
Off-trade will continue to lead, though on-trade channels are experiencing incremental recovery as tourism and nightlife resume. Retail e-commerce is also picking up steam, with most end users taking advantage of its extensive product offerings and favorable promotions. But supermarkets are still pivotal in the off-trade channel because they offer robust offline networks alongside digital platforms, providing versatility and convenience for Hong Kong end users and solidifying steady alcohol sales development.
Top Companies in Hong kong Alcoholic Drinks Market
The top companies operating in the market include Tsingtao Brewery Co Ltd, Pernod Ricard Groupe, Asahi Group Holdings Ltd, Carlsberg A/S, Jebsen & Co Ltd, San Miguel Corp, Heineken NV, Anheuser-Busch InBev NV, Diageo Plc, Treasury Wine Estates Ltd, etc., are the top players operating in the Hong kong Alcoholic Drinks Market.
Frequently Asked Questions
Related Report
1. Market Segmentation
1.1. Research Scope
1.2. Research Methodology
1.3. Definitions and Assumptions
2. Executive Summary
3. Hong Kong Alcoholic Drinks Market Policies, Regulations, and Standards
4. Hong Kong Alcoholic Drinks Market Dynamics
4.1. Growth Factors
4.2. Challenges
4.3. Trends
4.4. Opportunities
5. Hong Kong Alcoholic Drinks Market Statistics, 2022-2032F
5.1. Market Size & Growth Outlook
5.1.1. By Revenues in US$ Million
5.1.2. By Quantity Sold in Million Litres
5.2. Market Segmentation & Growth Outlook
5.2.1. By Type
5.2.1.1. Beer- Market Insights and Forecast 2022-2032, USD Million
5.2.1.2. Cider/Perry- Market Insights and Forecast 2022-2032, USD Million
5.2.1.3. RTDs- Market Insights and Forecast 2022-2032, USD Million
5.2.1.4. Spirits- Market Insights and Forecast 2022-2032, USD Million
5.2.1.5. Wine- Market Insights and Forecast 2022-2032, USD Million
5.2.2. By Alcohol Content
5.2.2.1. High- Market Insights and Forecast 2022-2032, USD Million
5.2.2.2. Medium- Market Insights and Forecast 2022-2032, USD Million
5.2.2.3. Low- Market Insights and Forecast 2022-2032, USD Million
5.2.3. By Flavor
5.2.3.1. Unflavored- Market Insights and Forecast 2022-2032, USD Million
5.2.3.2. Flavored- Market Insights and Forecast 2022-2032, USD Million
5.2.4. By Packaging Type
5.2.4.1. Glass Bottles- Market Insights and Forecast 2022-2032, USD Million
5.2.4.2. Tins- Market Insights and Forecast 2022-2032, USD Million
5.2.4.3. Plastic Bottles- Market Insights and Forecast 2022-2032, USD Million
5.2.4.4. Others- Market Insights and Forecast 2022-2032, USD Million
5.2.5. By Sales Channel
5.2.5.1. On-Trade- Market Insights and Forecast 2022-2032, USD Million
5.2.5.2. Off-Trade- Market Insights and Forecast 2022-2032, USD Million
5.2.5.2.1. Retail Offline- Market Insights and Forecast 2022-2032, USD Million
5.2.5.2.2. Retail Online- Market Insights and Forecast 2022-2032, USD Million
5.2.6. By Competitors
5.2.6.1. Competition Characteristics
5.2.6.2. Market Share & Analysis
6. Hong Kong Beer Market Statistics, 2022-2032F
6.1. Market Size & Growth Outlook
6.1.1. By Revenues in US$ Million
6.1.2. By Quantity Sold in Million Litres
6.2. Market Segmentation & Growth Outlook
6.2.1. By Alcohol Content- Market Insights and Forecast 2022-2032, USD Million
6.2.2. By Flavor- Market Insights and Forecast 2022-2032, USD Million
6.2.3. By Packaging Type- Market Insights and Forecast 2022-2032, USD Million
6.2.4. By Sales Channel- Market Insights and Forecast 2022-2032, USD Million
7. Hong Kong Cider/Perry Market Statistics, 2022-2032F
7.1. Market Size & Growth Outlook
7.1.1. By Revenues in US$ Million
7.1.2. By Quantity Sold in Million Litres
7.2. Market Segmentation & Growth Outlook
7.2.1. By Alcohol Content- Market Insights and Forecast 2022-2032, USD Million
7.2.2. By Flavor- Market Insights and Forecast 2022-2032, USD Million
7.2.3. By Packaging Type- Market Insights and Forecast 2022-2032, USD Million
7.2.4. By Sales Channel- Market Insights and Forecast 2022-2032, USD Million
8. Hong Kong Ready-to-Drink Market Statistics, 2022-2032F
8.1. Market Size & Growth Outlook
8.1.1. By Revenues in US$ Million
8.1.2. By Quantity Sold in Million Litres
8.2. Market Segmentation & Growth Outlook
8.2.1. By Alcohol Content- Market Insights and Forecast 2022-2032, USD Million
8.2.2. By Flavor- Market Insights and Forecast 2022-2032, USD Million
8.2.3. By Packaging Type- Market Insights and Forecast 2022-2032, USD Million
8.2.4. By Sales Channel- Market Insights and Forecast 2022-2032, USD Million
9. Hong Kong Spirits Market Statistics, 2022-2032F
9.1. Market Size & Growth Outlook
9.1.1. By Revenues in US$ Million
9.1.2. By Quantity Sold in Million Litres
9.2. Market Segmentation & Growth Outlook
9.2.1. By Alcohol Content- Market Insights and Forecast 2022-2032, USD Million
9.2.2. By Flavor- Market Insights and Forecast 2022-2032, USD Million
9.2.3. By Packaging Type- Market Insights and Forecast 2022-2032, USD Million
9.2.4. By Sales Channel- Market Insights and Forecast 2022-2032, USD Million
10. Hong Kong Wine Market Statistics, 2022-2032F
10.1.Market Size & Growth Outlook
10.1.1. By Revenues in US$ Million
10.1.2. By Quantity Sold in Million Litres
10.2.Market Segmentation & Growth Outlook
10.2.1. By Alcohol Content- Market Insights and Forecast 2022-2032, USD Million
10.2.2. By Flavor- Market Insights and Forecast 2022-2032, USD Million
10.2.3. By Packaging Type- Market Insights and Forecast 2022-2032, USD Million
10.2.4. By Sales Channel- Market Insights and Forecast 2022-2032, USD Million
11. Competitive Outlook
11.1.Company Profiles
11.1.1. Carlsberg A/S
11.1.1.1. Business Description
11.1.1.2. Product Portfolio
11.1.1.3. Collaborations & Alliances
11.1.1.4. Recent Developments
11.1.1.5. Financial Details
11.1.1.6. Others
11.1.2. Jebsen & Co Ltd
11.1.2.1. Business Description
11.1.2.2. Product Portfolio
11.1.2.3. Collaborations & Alliances
11.1.2.4. Recent Developments
11.1.2.5. Financial Details
11.1.2.6. Others
11.1.3. San Miguel Corp
11.1.3.1. Business Description
11.1.3.2. Product Portfolio
11.1.3.3. Collaborations & Alliances
11.1.3.4. Recent Developments
11.1.3.5. Financial Details
11.1.3.6. Others
11.1.4. Heineken NV
11.1.4.1. Business Description
11.1.4.2. Product Portfolio
11.1.4.3. Collaborations & Alliances
11.1.4.4. Recent Developments
11.1.4.5. Financial Details
11.1.4.6. Others
11.1.5. Anheuser-Busch InBev NV
11.1.5.1. Business Description
11.1.5.2. Product Portfolio
11.1.5.3. Collaborations & Alliances
11.1.5.4. Recent Developments
11.1.5.5. Financial Details
11.1.5.6. Others
11.1.6. Tsingtao Brewery Co Ltd
11.1.6.1. Business Description
11.1.6.2. Product Portfolio
11.1.6.3. Collaborations & Alliances
11.1.6.4. Recent Developments
11.1.6.5. Financial Details
11.1.6.6. Others
11.1.7. Pernod Ricard Groupe
11.1.7.1. Business Description
11.1.7.2. Product Portfolio
11.1.7.3. Collaborations & Alliances
11.1.7.4. Recent Developments
11.1.7.5. Financial Details
11.1.7.6. Others
11.1.8. Asahi Group Holdings Ltd
11.1.8.1. Business Description
11.1.8.2. Product Portfolio
11.1.8.3. Collaborations & Alliances
11.1.8.4. Recent Developments
11.1.8.5. Financial Details
11.1.8.6. Others
11.1.9. Diageo Plc
11.1.9.1. Business Description
11.1.9.2. Product Portfolio
11.1.9.3. Collaborations & Alliances
11.1.9.4. Recent Developments
11.1.9.5. Financial Details
11.1.9.6. Others
11.1.10. Treasury Wine Estates Ltd
11.1.10.1. Business Description
11.1.10.2. Product Portfolio
11.1.10.3. Collaborations & Alliances
11.1.10.4. Recent Developments
11.1.10.5. Financial Details
11.1.10.6. Others
12. Disclaimer
| Segment | Sub-Segment |
|---|---|
| By Type |
|
| By Alcohol Content |
|
| By Flavor |
|
| By Packaging Type |
|
| By Sales Channel |
|
Research Methodology
This study followed a structured approach comprising four key phases to assess the size and scope of the electro-oxidation market. The process began with thorough secondary research to collect data on the target market, related markets, and broader industry context. These findings, along with preliminary assumptions and estimates, were then validated through extensive primary research involving industry experts from across the value chain. To calculate the overall market size, both top-down and bottom-up methodologies were employed. Finally, market segmentation and data triangulation techniques were applied to refine and validate segment-level estimations.
Secondary Research
The secondary research phase involved gathering data from a wide range of credible and published sources. This step helped in identifying industry trends, defining market segmentation, and understanding the market landscape and value chain.
Sources consulted during this phase included:
- Company annual reports, investor presentations, and press releases
- Industry white papers and certified publications
- Trade directories and market-recognized databases
- Articles from authoritative authors and reputable journals
- Gold and silver standard websites
Secondary research was critical in mapping out the industry's value chain and monetary flow, identifying key market segments, understanding regional variations, and tracking significant industry developments.
Other key sources:
- Financial disclosures
- Industry associations and trade bodies
- News outlets and business magazines
- Academic journals and research studies
- Paid industry databases
Primary Research
To validate secondary data and gain deeper market insights, primary research was conducted with key stakeholders across both the supply and demand sides of the market.
On the demand side, participants included decision-makers and influencers from end-user industries—such as CIOs, CTOs, and CSOs—who provided first-hand perspectives on market needs, product usage, and future expectations.
On the supply side, interviews were conducted with manufacturers, industry associations, and institutional participants to gather insights into current offerings, product pipelines, and market challenges.
Primary interviews provided critical inputs such as:
- Market size and revenue data
- Product and service breakdowns
- Market forecasts
- Regional and application-specific trends
Stakeholders consulted included:
- Leading OEM and solution providers
- Channel and distribution partners
- End users across various applications
- Independent consultants and industry specialists
Market Size Estimation and Data Triangulation
- Identifying Key Market Participants (Secondary Research)
- Goal: To identify the major players or companies in the target market. This typically involves using publicly available data sources such as industry reports, market research publications, and financial statements of companies.
- Tools: Reports from firms like Gartner, Forrester, Euromonitor, Statista, IBISWorld, and others. Public financial statements, news articles, and press releases from top market players.
- Extracting Earnings of Key Market Participants
- Goal: To estimate the earnings generated from the product or service being analyzed. This step helps in understanding the revenue potential of each market player in a specific geography.
- Methods: Earnings data can be gathered from:
- Publicly available financial reports (for listed companies).
- Interviews and primary data sources from professionals, such as Directors, VPs, SVPs, etc. This is especially useful for understanding more nuanced, internal data that isn't publicly disclosed.
- Annual reports and investor presentations of key players.
- Data Collation and Development of a Relevant Data Model
- Goal: To collate inputs from both primary and secondary sources into a structured, data-driven model for market estimation. This model will incorporate key market KPIs and any independent variables relevant to the market.
- Key KPIs: These could include:
- Market size, growth rate, and demand drivers.
- Industry-specific metrics like market share, average revenue per customer (ARPC), or average deal size.
- External variables, such as economic growth rates, inflation rates, or commodity prices, that could affect the market.
- Data Modeling: Based on this data, the market forecasts are developed for the next 5 years. A combination of trend analysis, scenario modeling, and statistical regression might be used to generate projections.
- Scenario Analysis
- Goal: To test different assumptions and validate how sensitive the market is to changes in key variables (e.g., market demand, regulatory changes, technological disruptions).
- Types of Scenarios:
- Base Case: Based on current assumptions and historical data.
- Best-Case Scenario: Assuming favorable market conditions, regulatory environments, and technological advancements.
- Worst-Case Scenario: Accounting for adverse factors, such as economic downturns, stricter regulations, or unexpected disruptions.


