Ecuador Alcoholic Drinks Market Report: Trends, Growth and Forecast (2026-2032)
By Type (Beer, Cider/Perry, RTDs, Spirits, Wine), By Alcohol Content (High, Medium, Low), By Flavor (Unflavored, Flavored), By Packaging Type (Glass Bottles, Tins, Plastic Bottles, Others), By Sales Channel (On-Trade, Off-Trade (Retail Offline, Retail Online)) ... Read more

|
Major Players
|
Ecuador Alcoholic Drinks Market Statistics and Insights, 2026
- Market Size Statistics
- Alcoholic Drinks in Ecuador is estimated at $ 3.42 Billion.
- The market size is expected to grow to $ 3.89 Billion by 2032.
- Market to register a CAGR of around 1.86% during 2026-32.
- Type Shares
- Beer grabbed market share of 70%.
- Beer to witness a volume CAGR of around 1.42%.
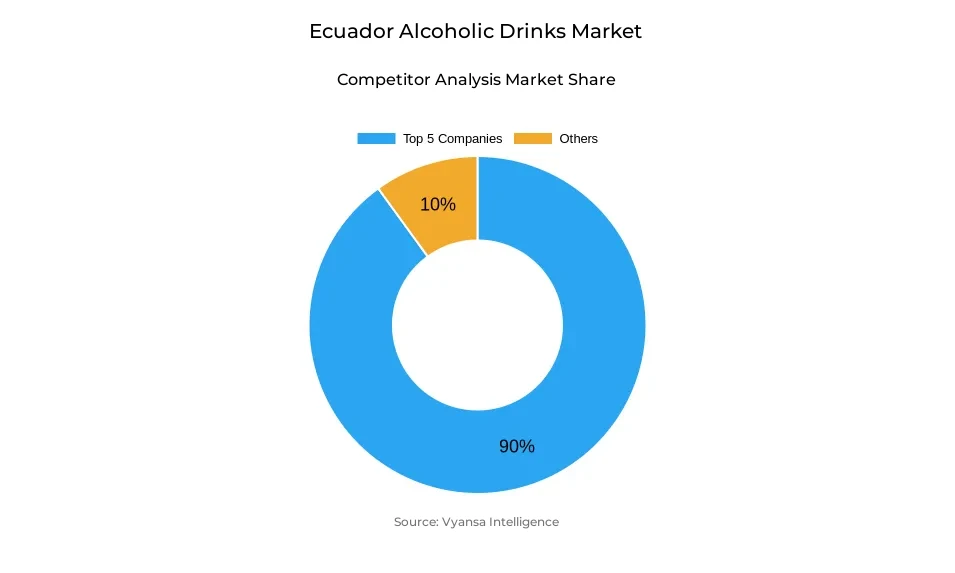
- Competition
- More than 10 companies are actively engaged in producing Alcoholic Drinks in Ecuador.
- Top 5 companies acquired 90% of the market share.
- Cartavio Rum Co SAC, Compania Embotelladora Industrial Licorera Manabi CA, Diageo Plc, Anheuser-Busch InBev NV, Heineken NV etc., are few of the top companies.
- Sales Channel
- Off-Trade grabbed 70% of the market.
Ecuador Alcoholic Drinks Market Outlook
The Ecuador Alcoholic Drinks Market size is estimated at USD 3.42 billion and it is forecast to reach USD 3.89 billion by 2032. Growth will be moderate and the market will be influenced by better security conditions and slow economic recovery. Beer will continue to lead total consumption, although it will only experience a modest volume CAGR of approximately 1.42%. Whereas tax increases like VAT and Special Consumption Tax (ICE) put pressure on beer sales during 2024, premium lager remained robust with new returnable big formats increasing accessibility. Economy lager, however, was hit hard, an indication of the gap between cheap premium and cheaper alternatives.
Wine will stay on the back foot as it is dependent on aged end users and changing tastes of younger generations, which are leaning towards lighter and more casual beverages, including wine-based Ready-to-Drink (RTD) products. Spirits such as aguardiente will remain strong through affordability and cultural appeal. Non-alcoholic beer too will spread its reach, aided by increasing health and wellbeing trends, even if it will remain a niche area because of limited availability of local brands and premium prices of imported ones.
Off-trade leads in sales channels with approximately 70% of market share. Small independent grocery stores and specialists continue to play their part but discounters like Tiendas Tuti are growing well by appealing to value-conscious end users through aggressive prices. E-commerce is also picking up, especially through the TaDa delivery app, which offers special deals together with returnable bottle solutions, so it is both affordable and eco-friendly. On-trade sales will bounce back as security and energy issues soften, encouraging more end users to revisit pubs, clubs, and restaurants.
In the future, the market will experience growing demand for value premium products, which reconcile price and quality, providing a mid-point for end users who want better without paying too much. Trends in lower-strength drinks and flavoured spirits will also allow brands to ride through high tax pressures while appealing to younger generations that want fun and accessible drinks. With steady recovery in on-trade and increased emphasis on value-driven premiumisation, the Ecuador Alcoholic Drinks Market will be projected to record steady growth.
Ecuador Alcoholic Drinks Market Growth Driver
Increased Demand for Low-Cost Alcoholic Products
Businesses are increasingly shifting their focus towards beverages with lower alcohol content, reflecting changing consumption patterns and preferences. Manufacturers react to end users needs for low-cost alcoholic drinks by providing products charged at lower taxes. These lower-tax alternatives enable firms to maintain prices affordable, which means their products are more appealing to price-conscious end users. Product developments, for example, the introduction of beverages with distinct taste and lower ABV, continue to increase end users selection and support demand in the face of difficult economic circumstances.
Meanwhile, this strategy enables the sector to respond rapidly to tax increases and increasing input prices. Manufacturers can transfer less of their elevated costs to end users than is the case with higher taxed products. This not only maintains products as affordable but also encourages brand loyalty among end users, particularly younger adults who favor lighter, less difficult to consume products. This tax-efficient evolution is showing to be instrumental in enabling overall marketplace resilience.
Ecuador Alcoholic Drinks Market Trend
Young Adults Welcome Lighter Tastes
End users, particularly younger adults, are increasingly drawn to lighter and more easy-to-drink alcoholic beverages. End users under 30 years of age increasingly find themselves drawn to lower-ABV, out-of-the-box flavors, away from more established, high-strength drinks. The trend mirrors altering ways of life and an increased willingness to explore unique and novel alcoholic experiences.
Brands are responding proactively by introducing RTDs, flavored beers, and spirits with attractive taste profiles that address this youth-led demand. These products provide a social and casual drinking experience, which particularly resonates with younger end users. The trend is impacting product development strategies, as companies compete to grab market share by tapping into changing end users tastes.
Unlock Market Intelligence
Explore the market potential with our data-driven report
Ecuador Alcoholic Drinks Market Opportunity
Rise of Affordable Premiumization
The market is poised to witness significant growth with the rising demand for affordable premium alcoholic drinks. With better economic times, more end users want higher-quality beverages that are still within reach. Brands that provide premium experience at reasonable prices are able to acquire end users who want to move up from economy brands without spending too much.
By offering premium quality at more affordable price points, companies are able to reach value-oriented end users who enjoy indulgence without the cost. This creates an opportunity for manufacturers to extend their portfolios with premium alternatives in beer, spirits, and RTDs. With the economy on the mend and end users confidence increasing, this segment will be a leading driver of value-led market growth.
Unlock Market Intelligence
Explore the market potential with our data-driven report
Ecuador Alcoholic Drinks Market Segmentation Analysis

By Type
- Beer
- Cider/Perry
- RTDs
- Spirits
- Wine
The segment with highest market share under Type segment is beer. Beer captures about 70% market share of the Ecuador Alcoholic Drinks Market, establishing itself as the outright leader in all alcoholic categories. The cause for this dominance is rooted in centuries-long end users affinity, cultural heritage, and commonality in availability among both urban and rural populations.
In addition, beer also maintains its position as the anchor alcoholic drink, backed by continued product development and competitive profile. The segment is projected to experience a volume CAGR of approximately 1.42% between 2026 and 2032, indicating sustained demand and resistance. Consequently, beer remains at the hub of market dynamics, dictating overall consumption trends and informing strategic choice for manufacturers.
By Sales Channel
- On-Trade
- Off-Trade
The segment with highest market share under sales channel is off-trade. Off-trade such as supermarkets, local retailers, and modern retailing account for approximately 70% of alcoholic beverage total market share in Ecuador. This strong lead is based on end users needs for convenient access and competitive prices, especially during times of economic and social uncertainty.
Off-trade's market leadership is further supported by increasing discounter networks and the growth of e-commerce, with increasing numbers of end users opting to buy alcoholic drinks for consumption at home. Off-trade steady growth is evidence of its capacity to adapt to shifting end users trends, establishing it as the leading channel for sales and a driving force for market growth during the forecast period.
Top Companies in Ecuador Alcoholic Drinks Market
The top companies operating in the market include Cartavio Rum Co SAC, Compania Embotelladora Industrial Licorera Manabi CA, Diageo Plc, Anheuser-Busch InBev NV, Heineken NV, Azende Corp Cía Ltda, Industrias Licoreras de Guatemala SA, Embotelladora Azuaya SA, United Dutch Breweries BV, Industria Licorera y Embotelladora del Norte SA, etc., are the top players operating in the Ecuador Alcoholic Drinks Market.
Frequently Asked Questions
Related Report
1. Market Segmentation
1.1. Research Scope
1.2. Research Methodology
1.3. Definitions and Assumptions
2. Executive Summary
3. Ecuador Alcoholic Drinks Market Policies, Regulations, and Standards
4. Ecuador Alcoholic Drinks Market Dynamics
4.1. Growth Factors
4.2. Challenges
4.3. Trends
4.4. Opportunities
5. Ecuador Alcoholic Drinks Market Statistics, 2022-2032F
5.1. Market Size & Growth Outlook
5.1.1. By Revenues in US$ Million
5.1.2. By Quantity Sold in Million Litres
5.2. Market Segmentation & Growth Outlook
5.2.1. By Type
5.2.1.1. Beer- Market Insights and Forecast 2022-2032, USD Million
5.2.1.2. Cider/Perry- Market Insights and Forecast 2022-2032, USD Million
5.2.1.3. RTDs- Market Insights and Forecast 2022-2032, USD Million
5.2.1.4. Spirits- Market Insights and Forecast 2022-2032, USD Million
5.2.1.5. Wine- Market Insights and Forecast 2022-2032, USD Million
5.2.2. By Alcohol Content
5.2.2.1. High- Market Insights and Forecast 2022-2032, USD Million
5.2.2.2. Medium- Market Insights and Forecast 2022-2032, USD Million
5.2.2.3. Low- Market Insights and Forecast 2022-2032, USD Million
5.2.3. By Flavor
5.2.3.1. Unflavored- Market Insights and Forecast 2022-2032, USD Million
5.2.3.2. Flavored- Market Insights and Forecast 2022-2032, USD Million
5.2.4. By Packaging Type
5.2.4.1. Glass Bottles- Market Insights and Forecast 2022-2032, USD Million
5.2.4.2. Tins- Market Insights and Forecast 2022-2032, USD Million
5.2.4.3. Plastic Bottles- Market Insights and Forecast 2022-2032, USD Million
5.2.4.4. Others- Market Insights and Forecast 2022-2032, USD Million
5.2.5. By Sales Channel
5.2.5.1. On-Trade- Market Insights and Forecast 2022-2032, USD Million
5.2.5.2. Off-Trade- Market Insights and Forecast 2022-2032, USD Million
5.2.5.2.1. Retail Offline- Market Insights and Forecast 2022-2032, USD Million
5.2.5.2.2. Retail Online- Market Insights and Forecast 2022-2032, USD Million
5.2.6. By Competitors
5.2.6.1. Competition Characteristics
5.2.6.2. Market Share & Analysis
6. Ecuador Beer Market Statistics, 2022-2032F
6.1. Market Size & Growth Outlook
6.1.1. By Revenues in US$ Million
6.1.2. By Quantity Sold in Million Litres
6.2. Market Segmentation & Growth Outlook
6.2.1. By Alcohol Content- Market Insights and Forecast 2022-2032, USD Million
6.2.2. By Flavor- Market Insights and Forecast 2022-2032, USD Million
6.2.3. By Packaging Type- Market Insights and Forecast 2022-2032, USD Million
6.2.4. By Sales Channel- Market Insights and Forecast 2022-2032, USD Million
7. Ecuador Cider/Perry Market Statistics, 2022-2032F
7.1. Market Size & Growth Outlook
7.1.1. By Revenues in US$ Million
7.1.2. By Quantity Sold in Million Litres
7.2. Market Segmentation & Growth Outlook
7.2.1. By Alcohol Content- Market Insights and Forecast 2022-2032, USD Million
7.2.2. By Flavor- Market Insights and Forecast 2022-2032, USD Million
7.2.3. By Packaging Type- Market Insights and Forecast 2022-2032, USD Million
7.2.4. By Sales Channel- Market Insights and Forecast 2022-2032, USD Million
8. Ecuador Ready-to-Drink Market Statistics, 2022-2032F
8.1. Market Size & Growth Outlook
8.1.1. By Revenues in US$ Million
8.1.2. By Quantity Sold in Million Litres
8.2. Market Segmentation & Growth Outlook
8.2.1. By Alcohol Content- Market Insights and Forecast 2022-2032, USD Million
8.2.2. By Flavor- Market Insights and Forecast 2022-2032, USD Million
8.2.3. By Packaging Type- Market Insights and Forecast 2022-2032, USD Million
8.2.4. By Sales Channel- Market Insights and Forecast 2022-2032, USD Million
9. Ecuador Spirits Market Statistics, 2022-2032F
9.1. Market Size & Growth Outlook
9.1.1. By Revenues in US$ Million
9.1.2. By Quantity Sold in Million Litres
9.2. Market Segmentation & Growth Outlook
9.2.1. By Alcohol Content- Market Insights and Forecast 2022-2032, USD Million
9.2.2. By Flavor- Market Insights and Forecast 2022-2032, USD Million
9.2.3. By Packaging Type- Market Insights and Forecast 2022-2032, USD Million
9.2.4. By Sales Channel- Market Insights and Forecast 2022-2032, USD Million
10. Ecuador Wine Market Statistics, 2022-2032F
10.1.Market Size & Growth Outlook
10.1.1. By Revenues in US$ Million
10.1.2. By Quantity Sold in Million Litres
10.2.Market Segmentation & Growth Outlook
10.2.1. By Alcohol Content- Market Insights and Forecast 2022-2032, USD Million
10.2.2. By Flavor- Market Insights and Forecast 2022-2032, USD Million
10.2.3. By Packaging Type- Market Insights and Forecast 2022-2032, USD Million
10.2.4. By Sales Channel- Market Insights and Forecast 2022-2032, USD Million
11. Competitive Outlook
11.1.Company Profiles
11.1.1. Anheuser-Busch InBev NV
11.1.1.1. Business Description
11.1.1.2. Product Portfolio
11.1.1.3. Collaborations & Alliances
11.1.1.4. Recent Developments
11.1.1.5. Financial Details
11.1.1.6. Others
11.1.2. Heineken NV
11.1.2.1. Business Description
11.1.2.2. Product Portfolio
11.1.2.3. Collaborations & Alliances
11.1.2.4. Recent Developments
11.1.2.5. Financial Details
11.1.2.6. Others
11.1.3. Azende Corp Cía Ltda
11.1.3.1. Business Description
11.1.3.2. Product Portfolio
11.1.3.3. Collaborations & Alliances
11.1.3.4. Recent Developments
11.1.3.5. Financial Details
11.1.3.6. Others
11.1.4. Industrias Licoreras de Guatemala SA
11.1.4.1. Business Description
11.1.4.2. Product Portfolio
11.1.4.3. Collaborations & Alliances
11.1.4.4. Recent Developments
11.1.4.5. Financial Details
11.1.4.6. Others
11.1.5. Embotelladora Azuaya SA
11.1.5.1. Business Description
11.1.5.2. Product Portfolio
11.1.5.3. Collaborations & Alliances
11.1.5.4. Recent Developments
11.1.5.5. Financial Details
11.1.5.6. Others
11.1.6. Cartavio Rum Co SAC
11.1.6.1. Business Description
11.1.6.2. Product Portfolio
11.1.6.3. Collaborations & Alliances
11.1.6.4. Recent Developments
11.1.6.5. Financial Details
11.1.6.6. Others
11.1.7. Compania Embotelladora Industrial Licorera Manabi CA
11.1.7.1. Business Description
11.1.7.2. Product Portfolio
11.1.7.3. Collaborations & Alliances
11.1.7.4. Recent Developments
11.1.7.5. Financial Details
11.1.7.6. Others
11.1.8. Diageo Plc
11.1.8.1. Business Description
11.1.8.2. Product Portfolio
11.1.8.3. Collaborations & Alliances
11.1.8.4. Recent Developments
11.1.8.5. Financial Details
11.1.8.6. Others
11.1.9. United Dutch Breweries BV
11.1.9.1. Business Description
11.1.9.2. Product Portfolio
11.1.9.3. Collaborations & Alliances
11.1.9.4. Recent Developments
11.1.9.5. Financial Details
11.1.9.6. Others
11.1.10. Industria Licorera y Embotelladora del Norte SA
11.1.10.1. Business Description
11.1.10.2. Product Portfolio
11.1.10.3. Collaborations & Alliances
11.1.10.4. Recent Developments
11.1.10.5. Financial Details
11.1.10.6. Others
12. Disclaimer
| Segment | Sub-Segment |
|---|---|
| By Type |
|
| By Alcohol Content |
|
| By Flavor |
|
| By Packaging Type |
|
| By Sales Channel |
|
Research Methodology
This study followed a structured approach comprising four key phases to assess the size and scope of the electro-oxidation market. The process began with thorough secondary research to collect data on the target market, related markets, and broader industry context. These findings, along with preliminary assumptions and estimates, were then validated through extensive primary research involving industry experts from across the value chain. To calculate the overall market size, both top-down and bottom-up methodologies were employed. Finally, market segmentation and data triangulation techniques were applied to refine and validate segment-level estimations.
Secondary Research
The secondary research phase involved gathering data from a wide range of credible and published sources. This step helped in identifying industry trends, defining market segmentation, and understanding the market landscape and value chain.
Sources consulted during this phase included:
- Company annual reports, investor presentations, and press releases
- Industry white papers and certified publications
- Trade directories and market-recognized databases
- Articles from authoritative authors and reputable journals
- Gold and silver standard websites
Secondary research was critical in mapping out the industry's value chain and monetary flow, identifying key market segments, understanding regional variations, and tracking significant industry developments.
Other key sources:
- Financial disclosures
- Industry associations and trade bodies
- News outlets and business magazines
- Academic journals and research studies
- Paid industry databases
Primary Research
To validate secondary data and gain deeper market insights, primary research was conducted with key stakeholders across both the supply and demand sides of the market.
On the demand side, participants included decision-makers and influencers from end-user industries—such as CIOs, CTOs, and CSOs—who provided first-hand perspectives on market needs, product usage, and future expectations.
On the supply side, interviews were conducted with manufacturers, industry associations, and institutional participants to gather insights into current offerings, product pipelines, and market challenges.
Primary interviews provided critical inputs such as:
- Market size and revenue data
- Product and service breakdowns
- Market forecasts
- Regional and application-specific trends
Stakeholders consulted included:
- Leading OEM and solution providers
- Channel and distribution partners
- End users across various applications
- Independent consultants and industry specialists
Market Size Estimation and Data Triangulation
- Identifying Key Market Participants (Secondary Research)
- Goal: To identify the major players or companies in the target market. This typically involves using publicly available data sources such as industry reports, market research publications, and financial statements of companies.
- Tools: Reports from firms like Gartner, Forrester, Euromonitor, Statista, IBISWorld, and others. Public financial statements, news articles, and press releases from top market players.
- Extracting Earnings of Key Market Participants
- Goal: To estimate the earnings generated from the product or service being analyzed. This step helps in understanding the revenue potential of each market player in a specific geography.
- Methods: Earnings data can be gathered from:
- Publicly available financial reports (for listed companies).
- Interviews and primary data sources from professionals, such as Directors, VPs, SVPs, etc. This is especially useful for understanding more nuanced, internal data that isn't publicly disclosed.
- Annual reports and investor presentations of key players.
- Data Collation and Development of a Relevant Data Model
- Goal: To collate inputs from both primary and secondary sources into a structured, data-driven model for market estimation. This model will incorporate key market KPIs and any independent variables relevant to the market.
- Key KPIs: These could include:
- Market size, growth rate, and demand drivers.
- Industry-specific metrics like market share, average revenue per customer (ARPC), or average deal size.
- External variables, such as economic growth rates, inflation rates, or commodity prices, that could affect the market.
- Data Modeling: Based on this data, the market forecasts are developed for the next 5 years. A combination of trend analysis, scenario modeling, and statistical regression might be used to generate projections.
- Scenario Analysis
- Goal: To test different assumptions and validate how sensitive the market is to changes in key variables (e.g., market demand, regulatory changes, technological disruptions).
- Types of Scenarios:
- Base Case: Based on current assumptions and historical data.
- Best-Case Scenario: Assuming favorable market conditions, regulatory environments, and technological advancements.
- Worst-Case Scenario: Accounting for adverse factors, such as economic downturns, stricter regulations, or unexpected disruptions.


