South Africa Cards and Payments Market Report: Trends, Growth and Forecast (2026-2032)
By By Instrument Type (Cards (Debit Card, Charge Card, ATM Card, Pre-Paid Card, Credit Card, Store Card), Mobile Wallets, Cheques, Others), By By Card Type (Contact Smart Card, Contactless Smart Card, Non-Smart Card), By By Type of Payments (B2B, B2C, C2C, C2B (E-commerce Shopping, Payment at POS Terminals)), By By Transaction Type (Domestic, Foreign), By By Application (Food & Groceries, Health & Pharmacies, Travel & Tourism, Hospitality, Others (Media & Entertainment)) ... Read more

|
Major Players
|
South Africa Cards and Payments Market Statistics and Insights, 2026
- Market Size Statistics
- Cards and Payments in South Africa is estimated at $ 73.35 Billion.
- The market size is expected to grow to $ 80.66 Billion by 2032.
- Market to register a CAGR of around 1.37% during 2026-32.
- Instrument Type Shares
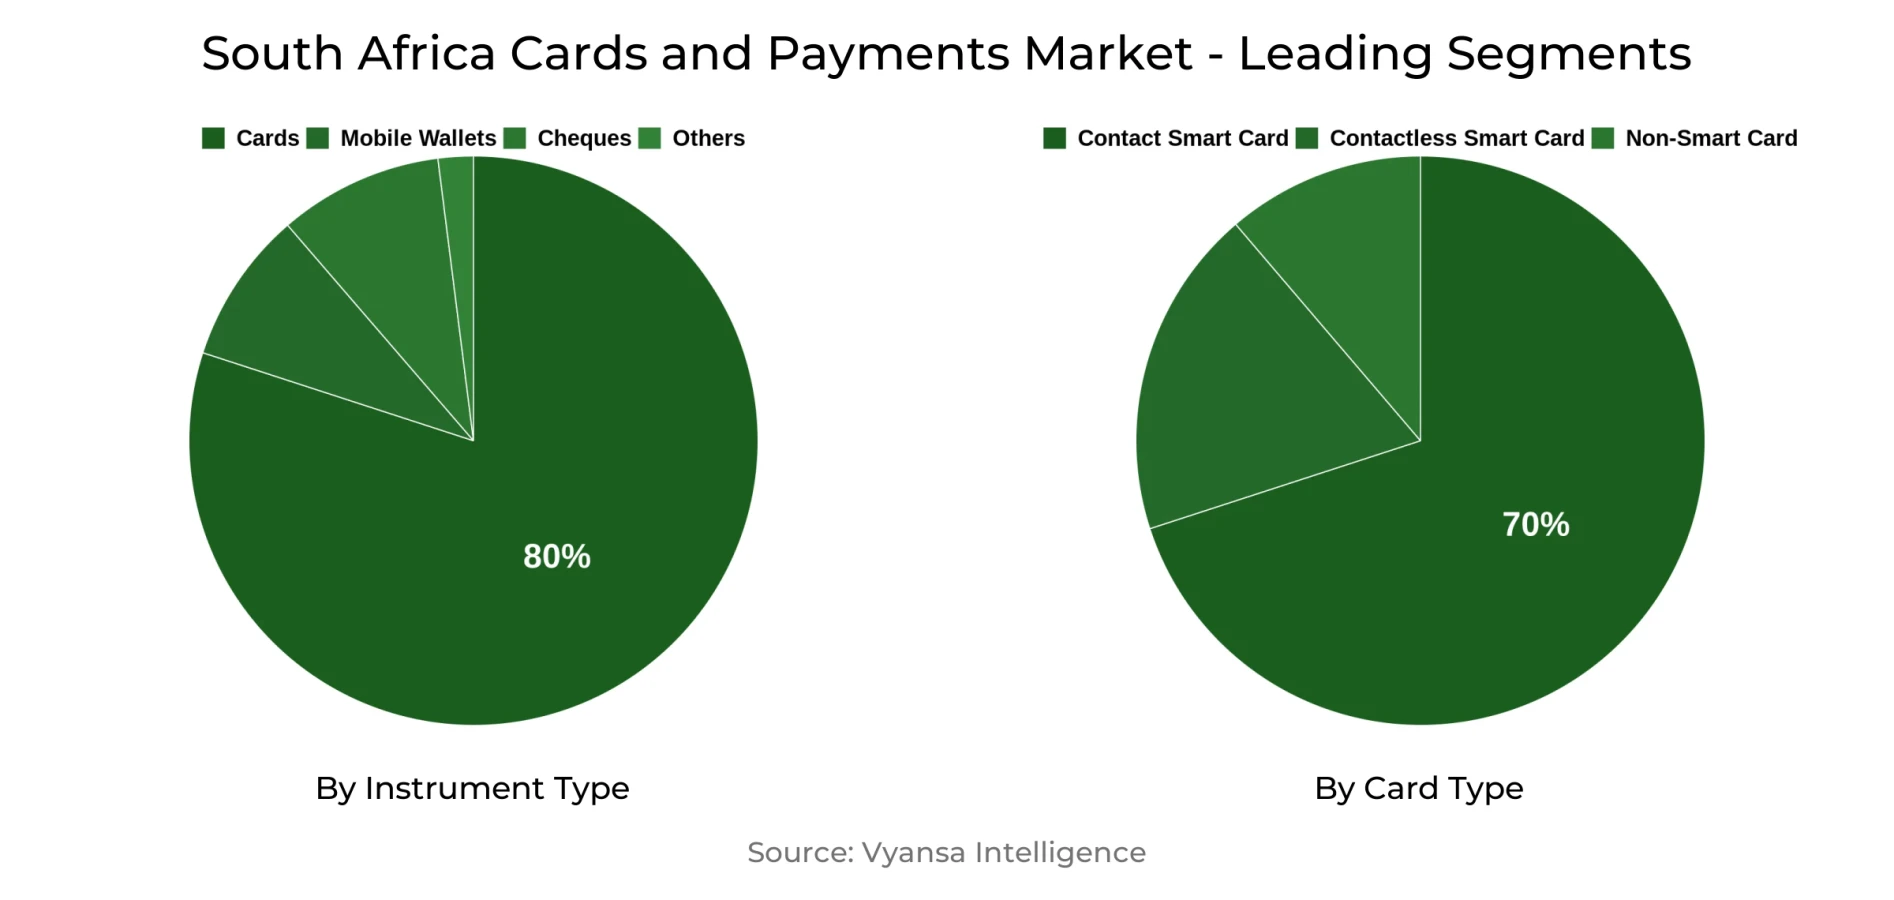
- Cards grabbed market share of 80%.
- Cards to witness a volume CAGR of around 1.6%.
- Competition
- More than 15 companies are actively engaged in producing Cards and Payments in South Africa.
- Top 5 companies acquired 80% of the market share.
- South African Postbank (SOC) Ltd, Capitec Bank Holdings Ltd, Foschini Group Ltd, The, FirstRand Bank Ltd, Standard Bank of South Africa etc., are few of the top companies.
- Card Type
- Contact Smart Card grabbed 70% of the market.
South Africa Cards and Payments Market Outlook
The South Africa cards and payments market will continue to grow steadily during the forecast period, fueled by continued economic development, technological acceptance, and shifting end user attitudes. The market is valued at $73.35 billion currently and is forecasted to reach $80.66 billion by 2032, with card purchase volumes anticipated to increase at a CAGR of approximately 1.6%. Contact smart cards continue to hold sway, representing about 70% of the market share, a testament to end users demand for secure and easy payment options.
The use of digital wallets and fast payment options like PayShap will grow as end users value convenience and safety. Increase in functionalities such as increased limits on transactions and corporate Request-to-Pay capabilities will drive growth, particularly for small and medium enterprises. In contrast, the decommissioning of magnetic stripe cards and the introduction of EMV fleet and contactless cards at the toll gates will speed up modernization further, decreasing cash reliance.
Competition among the banking and payments market is expected to heat up. New entrants such as Postbank and Old Mutual, as well as fintech collaborations with retailers and telecommunication operators such as MTN, will propel innovation and inclusion. Long-established banks such as FirstRand, Absa, Standard Bank, and Nedbank will maintain their emphasis on digitalisation, reward schemes, and end users engagement tactics to hold on to market share among young end users when they enter the workforce.
Overall, the South Africa cards and payments market is poised to gain from favorable economic conditions, rising adoption of digital solutions, and continuous infrastructure modernization. Although cash will continue to play its role, especially in the informal markets, the trend towards contactless and mobile payments will grow, underpinning both volume and value growth for the market until 2032.

South Africa Cards and Payments Market Growth Driver
Increasing Competition and Public Support Propelling Digital Payments
The South Africa cards and payments market witnesses a heightened level of competition with new entrants in the market introducing specialized products. The emerging banks specialize in addressing both mass-market and high-end end users by collaborating with them and introducing new-age services, persuading more individuals towards digital and card-based payments. This increased competition forces traditional banks to improve their digital services, increase reward schemes, and introduce hassle-free payment options, making the use of cards more appealing to the end users.
Simultaneously, government policies promote financial inclusion and market expansion. Policies like unbundling Postbank from the South Africa Post Office are designed to extend banking services to lower-income and rural communities, enhancing access to financial products. These actions reinforce wider use of cards and electronic payments throughout the nation, building the overall payments infrastructure.
South Africa Cards and Payments Market Trend
Fast Rise of Buy Now Pay Later (BNPL) Services
The South Africa cards and payments market experiences robust growth in Buy Now Pay Later (BNPL) services as end users look for easier and more flexible payment modes. With economic stress, end users favor BNPL over personal charge cards more than ever before, enabling them to manage short-term cash flows and gain access to goods and services. This represents an overarching trend toward creative credit solutions addressing price-conscious and digitally engaged end users.
From the providers' side, BNPL assists providers to minimize operating risk like bad debt while being appealing in a competitive environment. Concurrently, digital wallets become increasingly popular as end users seek alternatives that are safer to online debit card payment. In the meantime, efforts at modernisation, like the deployment of EMV fleet cards and the gradual phase-out of magnetic stripe cards, serve to underscore growth of adaptable and secure digital payment tools in South Africa.
Unlock Market Intelligence
Explore the market potential with our data-driven report
South Africa Cards and Payments Market Opportunity
Growth in Digital Payment Infrastructure Developing Potential
South Africa cards and payments market is a robust opportunity with the central bank pushing the modernisation of payment systems for enhancing financial inclusion. The implementation of projects like PayShap and the use of EMV fleet cards make the infrastructure robust by making transactions secure, faster, and cheaper. The scheduled phase-out of magnetic stripe cards at toll booths also hastens the adoption of contactless payments, opening new opportunities for service providers to increase their digital offerings and take in greater transaction volumes.
Concurrently, increasing demand for debit cards gets a lift from these advancements, complemented by improved economic conditions that engender spending confidence. Store and credit cards also gain opportunities with younger end users entering the workforce and starting to establish credit histories. Collectively, these trends underscore the market's potential for increasing card usage and fueling increased adoption of digital payments nationwide.
Unlock Market Intelligence
Explore the market potential with our data-driven report
South Africa Cards and Payments Market Segmentation Analysis
By Instrument Type
- Cards
- Mobile Wallets
- Cheques
- Others
The highest segment in terms of market share under Instrument Type is cards, which represents close to 80% of the South Africa cards and payments market. This leadership is buttressed by the changing payment infrastructure of the country, increased usage of contactless solutions, and sustained use by end users of debit and credit cards for daily transactions. Despite continued use of cash in the informal economy, cards continue to be the most convenient and dependable tool, allowing greater inclusion for both low- and high-income households.
Ahead, cards will see a volume CAGR of approximately 1.6%, in line with gradual growth despite PayShap and digital wallets gaining ground. A combination of stabilizing economic conditions, lower interest rates, and young end users starting work will keep supporting the use of cards, in turn cementing its position as the mainstay of South Africa payment system.
By Card Type
- Contact Smart Card
- Contactless Smart Card
- Non-Smart Card
Its leading market share under Card Type is Contact Smart Card, which gained around 70% of the South Africa market. It owes its dominant position to the trend towards increased security and ease of payments due to the introduction of EMV technology and the retirement of magnetic stripe cards. end users have clearly indicated a preference for contact smart cards because of their convenience, simplicity, and applicability to small and large value transactions as well as their security.
This card type's leadership is supported further by central bank efforts towards digitalisation and modernisation of payment schemes. With the growth of contactless payments, led mainly by the younger generation and the expanding middle class, contact smart cards are anticipated to continue their dominance. Its acceptance by merchants in large numbers and integration with loyalty and reward programmes also supports its further growth in the prediction period.
Top Companies in South Africa Cards and Payments Market
The top companies operating in the market include South African Postbank (SOC) Ltd, Capitec Bank Holdings Ltd, Foschini Group Ltd, The, FirstRand Bank Ltd, Standard Bank of South Africa, Absa Bank Ltd, Nedbank Group Ltd, Investec Bank Ltd, Truworths International Ltd, Woolworths Holdings Ltd (South Africa), etc., are the top players operating in the South Africa Cards and Payments Market.
Frequently Asked Questions
Related Report
1. Market Segmentation
1.1. Research Scope
1.2. Research Methodology
1.3. Definitions and Assumptions
2. Executive Summary
3. South Africa Cards and Payments Market Policies, Regulations, and Standards
4. South Africa Cards and Payments Market Dynamics
4.1. Growth Factors
4.2. Challenges
4.3. Trends
4.4. Opportunities
5. South Africa Cards and Payments Market Statistics, 2022-2032F
5.1. Market Size & Growth Outlook
5.1.1. By Revenues in US$ Million
5.2. Market Segmentation & Growth Outlook
5.2.1. By Instrument Type
5.2.1.1. Cards- Market Insights and Forecast 2022-2032, USD Million
5.2.1.1.1. Debit Card- Market Insights and Forecast 2022-2032, USD Million
5.2.1.1.2. Charge Card- Market Insights and Forecast 2022-2032, USD Million
5.2.1.1.3. ATM Card- Market Insights and Forecast 2022-2032, USD Million
5.2.1.1.4. Pre-Paid Card- Market Insights and Forecast 2022-2032, USD Million
5.2.1.1.5. Credit Card- Market Insights and Forecast 2022-2032, USD Million
5.2.1.1.6. Store Card- Market Insights and Forecast 2022-2032, USD Million
5.2.1.2. Mobile Wallets- Market Insights and Forecast 2022-2032, USD Million
5.2.1.3. Cheques- Market Insights and Forecast 2022-2032, USD Million
5.2.1.4. Others- Market Insights and Forecast 2022-2032, USD Million
5.2.2. By Card Type
5.2.2.1. Contact Smart Card- Market Insights and Forecast 2022-2032, USD Million
5.2.2.2. Contactless Smart Card- Market Insights and Forecast 2022-2032, USD Million
5.2.2.3. Non-Smart Card- Market Insights and Forecast 2022-2032, USD Million
5.2.3. By Type of Payments
5.2.3.1. B2B- Market Insights and Forecast 2022-2032, USD Million
5.2.3.2. B2C- Market Insights and Forecast 2022-2032, USD Million
5.2.3.3. C2C- Market Insights and Forecast 2022-2032, USD Million
5.2.3.4. C2B- Market Insights and Forecast 2022-2032, USD Million
5.2.3.4.1. E-commerce Shopping- Market Insights and Forecast 2022-2032, USD Million
5.2.3.4.2. Payment at POS Terminals- Market Insights and Forecast 2022-2032, USD Million
5.2.4. By Transaction Type
5.2.4.1. Domestic- Market Insights and Forecast 2022-2032, USD Million
5.2.4.2. Foreign- Market Insights and Forecast 2022-2032, USD Million
5.2.5. By Application
5.2.5.1. Food & Groceries- Market Insights and Forecast 2022-2032, USD Million
5.2.5.2. Health & Pharmacies- Market Insights and Forecast 2022-2032, USD Million
5.2.5.3. Travel & Tourism- Market Insights and Forecast 2022-2032, USD Million
5.2.5.4. Hospitality- Market Insights and Forecast 2022-2032, USD Million
5.2.5.5. Others (Media & Entertainment)- Market Insights and Forecast 2022-2032, USD Million
5.2.6. By Competitors
5.2.6.1. Competition Characteristics
5.2.6.2. Market Share & Analysis
6. South Africa Cards Market Statistics, 2022-2032F
6.1. Market Size & Growth Outlook
6.1.1. By Revenues in US$ Million
6.2. Market Segmentation & Growth Outlook
6.2.1. By Card Type- Market Insights and Forecast 2022-2032, USD Million
6.2.2. By Type of Payments- Market Insights and Forecast 2022-2032, USD Million
6.2.3. By Transaction Type- Market Insights and Forecast 2022-2032, USD Million
6.2.4. By Application- Market Insights and Forecast 2022-2032, USD Million
7. South Africa Mobile Wallets Market Statistics, 2022-2032F
7.1. Market Size & Growth Outlook
7.1.1. By Revenues in US$ Million
7.2. Market Segmentation & Growth Outlook
7.2.1. By Type of Payments- Market Insights and Forecast 2022-2032, USD Million
7.2.2. By Transaction Type- Market Insights and Forecast 2022-2032, USD Million
7.2.3. By Application- Market Insights and Forecast 2022-2032, USD Million
8. South Africa Cheques Market Statistics, 2022-2032F
8.1. Market Size & Growth Outlook
8.1.1. By Revenues in US$ Million
8.2. Market Segmentation & Growth Outlook
8.2.1. By Type of Payments- Market Insights and Forecast 2022-2032, USD Million
8.2.2. By Transaction Type- Market Insights and Forecast 2022-2032, USD Million
8.2.3. By Application- Market Insights and Forecast 2022-2032, USD Million
9. Competitive Outlook
9.1. Company Profiles
9.1.1. FirstRand Bank Ltd
9.1.1.1. Business Description
9.1.1.2. Product Portfolio
9.1.1.3. Collaborations & Alliances
9.1.1.4. Recent Developments
9.1.1.5. Financial Details
9.1.1.6. Others
9.1.2. Standard Bank of South Africa
9.1.2.1. Business Description
9.1.2.2. Product Portfolio
9.1.2.3. Collaborations & Alliances
9.1.2.4. Recent Developments
9.1.2.5. Financial Details
9.1.2.6. Others
9.1.3. Absa Bank Ltd
9.1.3.1. Business Description
9.1.3.2. Product Portfolio
9.1.3.3. Collaborations & Alliances
9.1.3.4. Recent Developments
9.1.3.5. Financial Details
9.1.3.6. Others
9.1.4. Nedbank Group Ltd
9.1.4.1. Business Description
9.1.4.2. Product Portfolio
9.1.4.3. Collaborations & Alliances
9.1.4.4. Recent Developments
9.1.4.5. Financial Details
9.1.4.6. Others
9.1.5. Investec Bank Ltd
9.1.5.1. Business Description
9.1.5.2. Product Portfolio
9.1.5.3. Collaborations & Alliances
9.1.5.4. Recent Developments
9.1.5.5. Financial Details
9.1.5.6. Others
9.1.6. South African Postbank (SOC) Ltd
9.1.6.1. Business Description
9.1.6.2. Product Portfolio
9.1.6.3. Collaborations & Alliances
9.1.6.4. Recent Developments
9.1.6.5. Financial Details
9.1.6.6. Others
9.1.7. Capitec Bank Holdings Ltd
9.1.7.1. Business Description
9.1.7.2. Product Portfolio
9.1.7.3. Collaborations & Alliances
9.1.7.4. Recent Developments
9.1.7.5. Financial Details
9.1.7.6. Others
9.1.8. Foschini Group Ltd, The
9.1.8.1. Business Description
9.1.8.2. Product Portfolio
9.1.8.3. Collaborations & Alliances
9.1.8.4. Recent Developments
9.1.8.5. Financial Details
9.1.8.6. Others
9.1.9. Truworths International Ltd
9.1.9.1. Business Description
9.1.9.2. Product Portfolio
9.1.9.3. Collaborations & Alliances
9.1.9.4. Recent Developments
9.1.9.5. Financial Details
9.1.9.6. Others
9.1.10. Woolworths Holdings Ltd (South Africa)
9.1.10.1. Business Description
9.1.10.2. Product Portfolio
9.1.10.3. Collaborations & Alliances
9.1.10.4. Recent Developments
9.1.10.5. Financial Details
9.1.10.6. Others
10. Disclaimer
| Segment | Sub-Segment |
|---|---|
| By Instrument Type |
|
| By Card Type |
|
| By Type of Payments |
|
| By Transaction Type |
|
| By Application |
|
Research Methodology
This study followed a structured approach comprising four key phases to assess the size and scope of the electro-oxidation market. The process began with thorough secondary research to collect data on the target market, related markets, and broader industry context. These findings, along with preliminary assumptions and estimates, were then validated through extensive primary research involving industry experts from across the value chain. To calculate the overall market size, both top-down and bottom-up methodologies were employed. Finally, market segmentation and data triangulation techniques were applied to refine and validate segment-level estimations.
Secondary Research
The secondary research phase involved gathering data from a wide range of credible and published sources. This step helped in identifying industry trends, defining market segmentation, and understanding the market landscape and value chain.
Sources consulted during this phase included:
- Company annual reports, investor presentations, and press releases
- Industry white papers and certified publications
- Trade directories and market-recognized databases
- Articles from authoritative authors and reputable journals
- Gold and silver standard websites
Secondary research was critical in mapping out the industry's value chain and monetary flow, identifying key market segments, understanding regional variations, and tracking significant industry developments.
Other key sources:
- Financial disclosures
- Industry associations and trade bodies
- News outlets and business magazines
- Academic journals and research studies
- Paid industry databases
Primary Research
To validate secondary data and gain deeper market insights, primary research was conducted with key stakeholders across both the supply and demand sides of the market.
On the demand side, participants included decision-makers and influencers from end-user industries—such as CIOs, CTOs, and CSOs—who provided first-hand perspectives on market needs, product usage, and future expectations.
On the supply side, interviews were conducted with manufacturers, industry associations, and institutional participants to gather insights into current offerings, product pipelines, and market challenges.
Primary interviews provided critical inputs such as:
- Market size and revenue data
- Product and service breakdowns
- Market forecasts
- Regional and application-specific trends
Stakeholders consulted included:
- Leading OEM and solution providers
- Channel and distribution partners
- End users across various applications
- Independent consultants and industry specialists
Market Size Estimation and Data Triangulation
- Identifying Key Market Participants (Secondary Research)
- Goal: To identify the major players or companies in the target market. This typically involves using publicly available data sources such as industry reports, market research publications, and financial statements of companies.
- Tools: Reports from firms like Gartner, Forrester, Euromonitor, Statista, IBISWorld, and others. Public financial statements, news articles, and press releases from top market players.
- Extracting Earnings of Key Market Participants
- Goal: To estimate the earnings generated from the product or service being analyzed. This step helps in understanding the revenue potential of each market player in a specific geography.
- Methods: Earnings data can be gathered from:
- Publicly available financial reports (for listed companies).
- Interviews and primary data sources from professionals, such as Directors, VPs, SVPs, etc. This is especially useful for understanding more nuanced, internal data that isn't publicly disclosed.
- Annual reports and investor presentations of key players.
- Data Collation and Development of a Relevant Data Model
- Goal: To collate inputs from both primary and secondary sources into a structured, data-driven model for market estimation. This model will incorporate key market KPIs and any independent variables relevant to the market.
- Key KPIs: These could include:
- Market size, growth rate, and demand drivers.
- Industry-specific metrics like market share, average revenue per customer (ARPC), or average deal size.
- External variables, such as economic growth rates, inflation rates, or commodity prices, that could affect the market.
- Data Modeling: Based on this data, the market forecasts are developed for the next 5 years. A combination of trend analysis, scenario modeling, and statistical regression might be used to generate projections.
- Scenario Analysis
- Goal: To test different assumptions and validate how sensitive the market is to changes in key variables (e.g., market demand, regulatory changes, technological disruptions).
- Types of Scenarios:
- Base Case: Based on current assumptions and historical data.
- Best-Case Scenario: Assuming favorable market conditions, regulatory environments, and technological advancements.
- Worst-Case Scenario: Accounting for adverse factors, such as economic downturns, stricter regulations, or unexpected disruptions.


