South Africa Alcoholic Drinks Market Report: Trends, Growth and Forecast (2026-2032)
By Type (Beer, Cider/Perry, RTDs, Spirits, Wine), By Alcohol Content (High, Medium, Low), By Flavor (Unflavored, Flavored), By Packaging Type (Glass Bottles, Tins, Plastic Bottles, Others), By Sales Channel (On-Trade, Off-Trade (Retail Offline, Retail Online)) ... Read more

|
Major Players
|
South Africa Alcoholic Drinks Market Statistics and Insights, 2026
- Market Size Statistics
- Alcoholic Drinks in South Africa is estimated at $ 31.94 Billion.
- The market size is expected to grow to $ 39.48 Billion by 2032.
- Market to register a CAGR of around 3.07% during 2026-32.
- Type Shares
- Beer grabbed market share of 45%.
- Beer to witness a volume CAGR of around 1.98%.
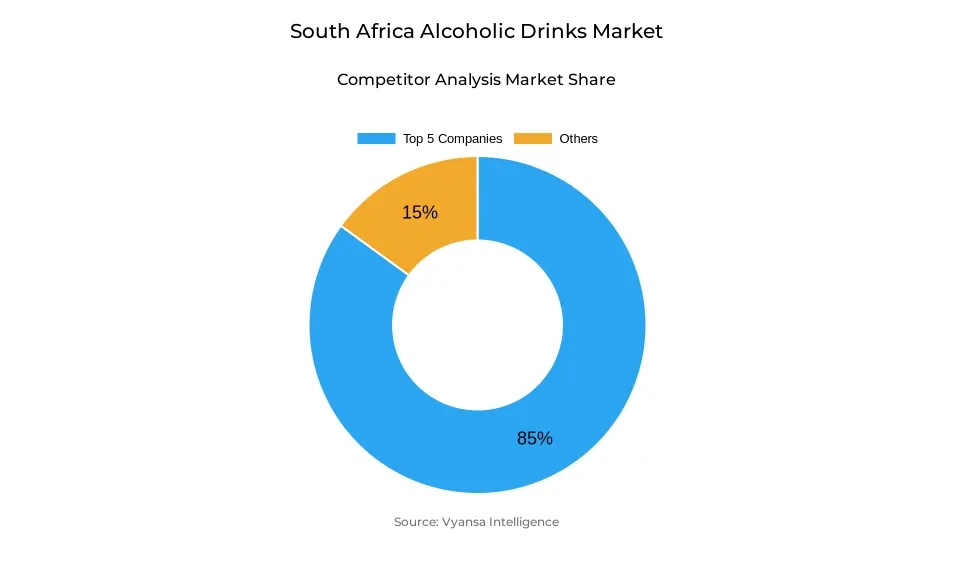
- Competition
- More than 10 companies are actively engaged in producing Alcoholic Drinks in South Africa.
- Top 5 companies acquired 85% of the market share.
- Raisin Social Ltd, Molson Coors Brewing Co, Halewood International Ltd, Anheuser-Busch InBev NV, Heineken NV etc., are few of the top companies.
- Sales Channel
- Off-Trade grabbed 60% of the market.
South Africa Alcoholic Drinks Market Outlook
South Africa Alcoholic Drinks Market are likely to increase consistently throughout the forecast period. The market, worth $31.94 billion in 2025, will be worth $39.48 billion in 2032. Growth will benefit from increasing urbanisation, better end users purchasing power, and the growing appeal of social and recreation activities. Beer, the biggest segment, is likely to see a volume CAGR of approximately 1.98%, fueled by both cheap local products and upscale imported brands.
Off-trade channels that now occupy 60% of the market will remain on top when it comes to sales because end users like the convenience and affordability of home consumption. Retailers, wine shops, and online sites will broaden their reach, providing a broader selection of products that include premium, non-alcoholic, and low-alcohol ones. This will respond to evolving end users lifestyles and increasing health awareness.
Ready-to-Drink (RTD) drinks are set to be the most vibrant category, with ongoing innovation in flavor, packaging, and marketing attracting younger adults. Spirit RTDs and wine RTDs will be aided by their convenience, premium positioning, and social acceptability. Wine drinking will also continue to increase, fueled by alternative packaging solutions like canned wine and bag-in-box, which appeal both to convenience-driven and value-driven end users.
Low-alcohol and non-alcoholic drinks are anticipated to increase in growth pace, a testament to growing health consciousness and wellness-oriented lifestyles. Domestic brands will be anticipated to keep benefiting from this trend by launching new products that serve end users needs for healthier alternatives. Generally, the South Africa Alcoholic Drinks Market is anticipated to grow consistently, with changing end users and dynamic retail channels dictating the trajectory of the market.
South Africa Alcoholic Drinks Market Growth Driver
Urbanisation Boosts Consumption
The rapid pace of urbanisation in South Africa is drawing a growing share of the population into towns and cities, reshaping lifestyles and consumption patterns. The urbanization inspires greater demand for leisure and social activities, including alcoholic drinks, as the increasingly urbanized population seeks places for entertainment, socializing, and lifestyle indulgence. Improved access to off-trade outlets and on-trade venues ensures that alcohol products are widely available to a growing urban population.
The growth in end users purchasing power combined with urbanisation further drives market expansion. With stabilising disposable incomes and improving economic conditions, end users can spend more on premium and mainstream alcohol beverages. Beer remains attractive to a wide range of end users, while Ready-to-Drink products increase in popularity among young adults looking for convenience and fashionable alternatives. All these factors together drive steady expansion in the Alcoholic Drinks Market.
South Africa Alcoholic Drinks Market Challenge
Increasing Illicit Consumption of Alcohol
The expansion of the illicit alcohol industry poses a major challenge to the South Africa Alcoholic Drinks Market. High prices and economic pressures instigate many end users to seek cheaper and unregulated products. This diminishes the market share of legal brands and also creates health and safety concerns, as illicit alcohol tends to be manufactured using unsafe and uncontrolled methods.
The prevalence of illicit alcohol erodes tax and duty revenues and brand loyalty while creating challenges in keeping prices competitive and building end users confidence for legal producers. The government must also address enforcement and regulation issues. These serve as constant barriers to the overall development and stability of the market.
Unlock Market Intelligence
Explore the market potential with our data-driven report
South Africa Alcoholic Drinks Market Trend
Shift Towards Health-Conscious Choices
End users in South Africa increasingly demand low-alcohol and non-alcoholic drinks to meet increased health consciousness and wellness sentiments. Young adults, in particular, demand alternatives that are part of a healthier lifestyle, prompting brands to create low or no-alcohol offerings to satisfy the need.
This trend is affecting product innovation as manufacturers are launching lower-alcohol versions of mainstream beverages. Low-alcohol Ready-to-Drink items are picking up pace owing to convenience and popularity among trendy end users. Wellness-oriented consumption pattern is influencing companies to invest in wellness-driven products without compromising product appeal and market significance.
South Africa Alcoholic Drinks Market Opportunity
Mid-Tier Wine Segment Expansion
The mid-tier wine segment is poised to witness notable growth in South Africa, supported by rising consumer interest and evolving purchasing patterns. A noticeable gap exists in the ZAR80–200 price range, where end users seek value-driven options that balance quality and affordability. Producers can capitalise on this unmet demand by introducing innovative packaging formats and mid-priced offerings tailored to diverse end users preferences.
As health and wellness trends persist, end users increasingly seek out low-cost and convenient alternatives, including canned wines and bag-in-box. Targeting the middle segment enables businesses to appeal to both price-sensitive and quality-oriented end users. This will facilitate growth in market share, differentiation against premium and economy segments, and the possibility of generating sustainable growth over the next few years.
Unlock Market Intelligence
Explore the market potential with our data-driven report
South Africa Alcoholic Drinks Market Segmentation Analysis

By Type
- Beer
- Cider/Perry
- RTDs
- Spirits
- Wine
The segment with highest market share under Type segment is beer, responsible for 45% of the South Africa Alcoholic Drinks Market. Beer is the most popular among the end users because it is inexpensive, readily available, and versatile. Local mid-range lagers lead the category, appealing both to recreational drinkers and those looking for value-for-money. The category is likely to experience a volume CAGR of approximately 1.98%, indicative of steady growth under economic constraints.
All other alcohol beverages like wine, spirits, RTDs, and cider/perry also demonstrate mixed performance. RTDs are the most dynamic as they are led by young adults who prefer convenient and socially relevant drinks. Wine posts steady progress with alternative packaging forms like bag-in-box and canned wines on the rise. Spirits, particularly gin and vodka, are promoted by craft movements and cocktail culture, adding to the broader diversity of the market.
By Sales Channel
- On-Trade
- Off-Trade
The segment with highest market share under Sales Channel is Off-Trade, accounting for 60% of South Africa Alcoholic Drinks Market. People prefer buying liquor for consumption at home as it is affordable, convenient, and gives people flexibility. Retailers like supermarkets and liquor stores are most involved, with end users making use of promotions and special deals to shop for value-for-money items. Supermarkets continue to dominate wine sales, with liquor stores dominating sales of beer, spirits, RTDs, and cider/perry.
E-commerce became an energetic channel, offering quick and convenient access to all beverage segments. Channels such as Checkers Sixty60, Pick n Pay ASAP, Woolies Dash, and Takealot have spurred online drinking alcohol sales, particularly among metropolitan customers. On-trade is still developing, with restaurants, bars, and wineries providing special occasion experiences, but off-trade is still the driver of total alcohol consumption in South Africa.
Top Companies in South Africa Alcoholic Drinks Market
The top companies operating in the market include Raisin Social Ltd, Molson Coors Brewing Co, Halewood International Ltd, Anheuser-Busch InBev NV, Heineken NV, Diageo Plc, Delta Corp Ltd, Robertson Winery, Pernod Ricard Groupe, DGB (Pty) Ltd, etc., are the top players operating in the South Africa Alcoholic Drinks Market.
Frequently Asked Questions
Related Report
1. Market Segmentation
1.1. Research Scope
1.2. Research Methodology
1.3. Definitions and Assumptions
2. Executive Summary
3. South Africa Alcoholic Drinks Market Policies, Regulations, and Standards
4. South Africa Alcoholic Drinks Market Dynamics
4.1. Growth Factors
4.2. Challenges
4.3. Trends
4.4. Opportunities
5. South Africa Alcoholic Drinks Market Statistics, 2022-2032F
5.1. Market Size & Growth Outlook
5.1.1. By Revenues in US$ Million
5.1.2. By Quantity Sold in Million Litres
5.2. Market Segmentation & Growth Outlook
5.2.1. By Type
5.2.1.1. Beer- Market Insights and Forecast 2022-2032, USD Million
5.2.1.2. Cider/Perry- Market Insights and Forecast 2022-2032, USD Million
5.2.1.3. RTDs- Market Insights and Forecast 2022-2032, USD Million
5.2.1.4. Spirits- Market Insights and Forecast 2022-2032, USD Million
5.2.1.5. Wine- Market Insights and Forecast 2022-2032, USD Million
5.2.2. By Alcohol Content
5.2.2.1. High- Market Insights and Forecast 2022-2032, USD Million
5.2.2.2. Medium- Market Insights and Forecast 2022-2032, USD Million
5.2.2.3. Low- Market Insights and Forecast 2022-2032, USD Million
5.2.3. By Flavor
5.2.3.1. Unflavored- Market Insights and Forecast 2022-2032, USD Million
5.2.3.2. Flavored- Market Insights and Forecast 2022-2032, USD Million
5.2.4. By Packaging Type
5.2.4.1. Glass Bottles- Market Insights and Forecast 2022-2032, USD Million
5.2.4.2. Tins- Market Insights and Forecast 2022-2032, USD Million
5.2.4.3. Plastic Bottles- Market Insights and Forecast 2022-2032, USD Million
5.2.4.4. Others- Market Insights and Forecast 2022-2032, USD Million
5.2.5. By Sales Channel
5.2.5.1. On-Trade- Market Insights and Forecast 2022-2032, USD Million
5.2.5.2. Off-Trade- Market Insights and Forecast 2022-2032, USD Million
5.2.5.2.1. Retail Offline- Market Insights and Forecast 2022-2032, USD Million
5.2.5.2.2. Retail Online- Market Insights and Forecast 2022-2032, USD Million
5.2.6. By Competitors
5.2.6.1. Competition Characteristics
5.2.6.2. Market Share & Analysis
6. South Africa Beer Market Statistics, 2022-2032F
6.1. Market Size & Growth Outlook
6.1.1. By Revenues in US$ Million
6.1.2. By Quantity Sold in Million Litres
6.2. Market Segmentation & Growth Outlook
6.2.1. By Alcohol Content- Market Insights and Forecast 2022-2032, USD Million
6.2.2. By Flavor- Market Insights and Forecast 2022-2032, USD Million
6.2.3. By Packaging Type- Market Insights and Forecast 2022-2032, USD Million
6.2.4. By Sales Channel- Market Insights and Forecast 2022-2032, USD Million
7. South Africa Cider/Perry Market Statistics, 2022-2032F
7.1. Market Size & Growth Outlook
7.1.1. By Revenues in US$ Million
7.1.2. By Quantity Sold in Million Litres
7.2. Market Segmentation & Growth Outlook
7.2.1. By Alcohol Content- Market Insights and Forecast 2022-2032, USD Million
7.2.2. By Flavor- Market Insights and Forecast 2022-2032, USD Million
7.2.3. By Packaging Type- Market Insights and Forecast 2022-2032, USD Million
7.2.4. By Sales Channel- Market Insights and Forecast 2022-2032, USD Million
8. South Africa Ready-to-Drink Market Statistics, 2022-2032F
8.1. Market Size & Growth Outlook
8.1.1. By Revenues in US$ Million
8.1.2. By Quantity Sold in Million Litres
8.2. Market Segmentation & Growth Outlook
8.2.1. By Alcohol Content- Market Insights and Forecast 2022-2032, USD Million
8.2.2. By Flavor- Market Insights and Forecast 2022-2032, USD Million
8.2.3. By Packaging Type- Market Insights and Forecast 2022-2032, USD Million
8.2.4. By Sales Channel- Market Insights and Forecast 2022-2032, USD Million
9. South Africa Spirits Market Statistics, 2022-2032F
9.1. Market Size & Growth Outlook
9.1.1. By Revenues in US$ Million
9.1.2. By Quantity Sold in Million Litres
9.2. Market Segmentation & Growth Outlook
9.2.1. By Alcohol Content- Market Insights and Forecast 2022-2032, USD Million
9.2.2. By Flavor- Market Insights and Forecast 2022-2032, USD Million
9.2.3. By Packaging Type- Market Insights and Forecast 2022-2032, USD Million
9.2.4. By Sales Channel- Market Insights and Forecast 2022-2032, USD Million
10. South Africa Wine Market Statistics, 2022-2032F
10.1.Market Size & Growth Outlook
10.1.1. By Revenues in US$ Million
10.1.2. By Quantity Sold in Million Litres
10.2.Market Segmentation & Growth Outlook
10.2.1. By Alcohol Content- Market Insights and Forecast 2022-2032, USD Million
10.2.2. By Flavor- Market Insights and Forecast 2022-2032, USD Million
10.2.3. By Packaging Type- Market Insights and Forecast 2022-2032, USD Million
10.2.4. By Sales Channel- Market Insights and Forecast 2022-2032, USD Million
11. Competitive Outlook
11.1.Company Profiles
11.1.1. Anheuser-Busch InBev NV
11.1.1.1. Business Description
11.1.1.2. Product Portfolio
11.1.1.3. Collaborations & Alliances
11.1.1.4. Recent Developments
11.1.1.5. Financial Details
11.1.1.6. Others
11.1.2. Heineken NV
11.1.2.1. Business Description
11.1.2.2. Product Portfolio
11.1.2.3. Collaborations & Alliances
11.1.2.4. Recent Developments
11.1.2.5. Financial Details
11.1.2.6. Others
11.1.3. Diageo Plc
11.1.3.1. Business Description
11.1.3.2. Product Portfolio
11.1.3.3. Collaborations & Alliances
11.1.3.4. Recent Developments
11.1.3.5. Financial Details
11.1.3.6. Others
11.1.4. Delta Corp Ltd
11.1.4.1. Business Description
11.1.4.2. Product Portfolio
11.1.4.3. Collaborations & Alliances
11.1.4.4. Recent Developments
11.1.4.5. Financial Details
11.1.4.6. Others
11.1.5. Robertson Winery
11.1.5.1. Business Description
11.1.5.2. Product Portfolio
11.1.5.3. Collaborations & Alliances
11.1.5.4. Recent Developments
11.1.5.5. Financial Details
11.1.5.6. Others
11.1.6. Raisin Social Ltd
11.1.6.1. Business Description
11.1.6.2. Product Portfolio
11.1.6.3. Collaborations & Alliances
11.1.6.4. Recent Developments
11.1.6.5. Financial Details
11.1.6.6. Others
11.1.7. Molson Coors Brewing Co
11.1.7.1. Business Description
11.1.7.2. Product Portfolio
11.1.7.3. Collaborations & Alliances
11.1.7.4. Recent Developments
11.1.7.5. Financial Details
11.1.7.6. Others
11.1.8. Halewood International Ltd
11.1.8.1. Business Description
11.1.8.2. Product Portfolio
11.1.8.3. Collaborations & Alliances
11.1.8.4. Recent Developments
11.1.8.5. Financial Details
11.1.8.6. Others
11.1.9. Pernod Ricard Groupe
11.1.9.1. Business Description
11.1.9.2. Product Portfolio
11.1.9.3. Collaborations & Alliances
11.1.9.4. Recent Developments
11.1.9.5. Financial Details
11.1.9.6. Others
11.1.10. DGB (Pty) Ltd
11.1.10.1. Business Description
11.1.10.2. Product Portfolio
11.1.10.3. Collaborations & Alliances
11.1.10.4. Recent Developments
11.1.10.5. Financial Details
11.1.10.6. Others
12. Disclaimer
| Segment | Sub-Segment |
|---|---|
| By Type |
|
| By Alcohol Content |
|
| By Flavor |
|
| By Packaging Type |
|
| By Sales Channel |
|
Research Methodology
This study followed a structured approach comprising four key phases to assess the size and scope of the electro-oxidation market. The process began with thorough secondary research to collect data on the target market, related markets, and broader industry context. These findings, along with preliminary assumptions and estimates, were then validated through extensive primary research involving industry experts from across the value chain. To calculate the overall market size, both top-down and bottom-up methodologies were employed. Finally, market segmentation and data triangulation techniques were applied to refine and validate segment-level estimations.
Secondary Research
The secondary research phase involved gathering data from a wide range of credible and published sources. This step helped in identifying industry trends, defining market segmentation, and understanding the market landscape and value chain.
Sources consulted during this phase included:
- Company annual reports, investor presentations, and press releases
- Industry white papers and certified publications
- Trade directories and market-recognized databases
- Articles from authoritative authors and reputable journals
- Gold and silver standard websites
Secondary research was critical in mapping out the industry's value chain and monetary flow, identifying key market segments, understanding regional variations, and tracking significant industry developments.
Other key sources:
- Financial disclosures
- Industry associations and trade bodies
- News outlets and business magazines
- Academic journals and research studies
- Paid industry databases
Primary Research
To validate secondary data and gain deeper market insights, primary research was conducted with key stakeholders across both the supply and demand sides of the market.
On the demand side, participants included decision-makers and influencers from end-user industries—such as CIOs, CTOs, and CSOs—who provided first-hand perspectives on market needs, product usage, and future expectations.
On the supply side, interviews were conducted with manufacturers, industry associations, and institutional participants to gather insights into current offerings, product pipelines, and market challenges.
Primary interviews provided critical inputs such as:
- Market size and revenue data
- Product and service breakdowns
- Market forecasts
- Regional and application-specific trends
Stakeholders consulted included:
- Leading OEM and solution providers
- Channel and distribution partners
- End users across various applications
- Independent consultants and industry specialists
Market Size Estimation and Data Triangulation
- Identifying Key Market Participants (Secondary Research)
- Goal: To identify the major players or companies in the target market. This typically involves using publicly available data sources such as industry reports, market research publications, and financial statements of companies.
- Tools: Reports from firms like Gartner, Forrester, Euromonitor, Statista, IBISWorld, and others. Public financial statements, news articles, and press releases from top market players.
- Extracting Earnings of Key Market Participants
- Goal: To estimate the earnings generated from the product or service being analyzed. This step helps in understanding the revenue potential of each market player in a specific geography.
- Methods: Earnings data can be gathered from:
- Publicly available financial reports (for listed companies).
- Interviews and primary data sources from professionals, such as Directors, VPs, SVPs, etc. This is especially useful for understanding more nuanced, internal data that isn't publicly disclosed.
- Annual reports and investor presentations of key players.
- Data Collation and Development of a Relevant Data Model
- Goal: To collate inputs from both primary and secondary sources into a structured, data-driven model for market estimation. This model will incorporate key market KPIs and any independent variables relevant to the market.
- Key KPIs: These could include:
- Market size, growth rate, and demand drivers.
- Industry-specific metrics like market share, average revenue per customer (ARPC), or average deal size.
- External variables, such as economic growth rates, inflation rates, or commodity prices, that could affect the market.
- Data Modeling: Based on this data, the market forecasts are developed for the next 5 years. A combination of trend analysis, scenario modeling, and statistical regression might be used to generate projections.
- Scenario Analysis
- Goal: To test different assumptions and validate how sensitive the market is to changes in key variables (e.g., market demand, regulatory changes, technological disruptions).
- Types of Scenarios:
- Base Case: Based on current assumptions and historical data.
- Best-Case Scenario: Assuming favorable market conditions, regulatory environments, and technological advancements.
- Worst-Case Scenario: Accounting for adverse factors, such as economic downturns, stricter regulations, or unexpected disruptions.


