Singapore Energy Drink Market Report: Trends, Growth and Forecast (2025-2030)
By Product Type (Alcoholic, Non-Alcoholic), By Consumption (Drinks, Shots, Mixers), By Nature (Conventional, Natural/Organic), By Flavour (Flavoured, Unflavoured), By Packaging (Bottles, Metal Cans, Pouches, Others), By Packaging Size (Small, Medium, Large), By End User (Teenagers, Adults, Geriatric), By Sales Channel (On-Trade, Off-Trade) ... Read more

|
Major Players
|
Singapore Energy Drink Market Statistics, 2025
- Market Size Statistics
- Energy Drink in Singapore is estimated at $ 25 Million.
- The market size is expected to grow to $ 30 Million by 2030.
- Market to register a CAGR of around 3.09% during 2025-30.
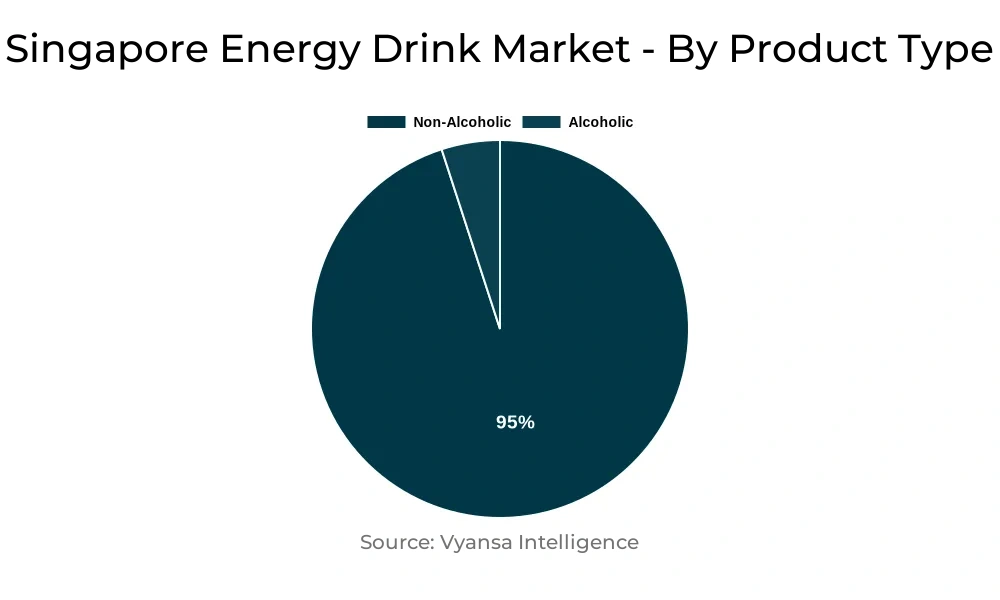
- Product Shares
- Non Alcoholic Energy Drinks grabbed market share of 95%.
- Non Alcoholic Energy Drinks to witness a volume CAGR of around 0.29%.
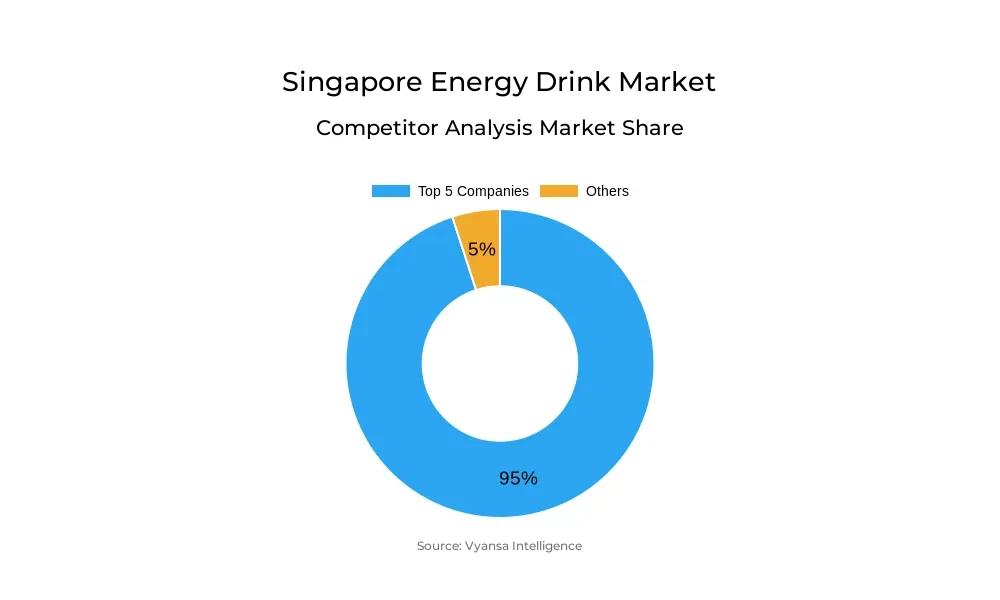
- Competition
- More than 5 companies are actively engaged in producing Energy Drink in Singapore.
- Top 5 companies acquired 95% of the market share.
- Monster Energy Singapore Pte Ltd, TC Pharmaceutical Industry Co Ltd, Red Bull Singapore Pte Ltd etc., are few of the top companies.
- Sales Channel
- Off-Trade grabbed 65% of the market.
Singapore Energy Drink Market Outlook
Singapore market for energy drinks is projected to grow steadily between 2025 and 2030 with demand driven by physically active industries such as construction, logistics, and delivery. Employees in these sectors tend to need continuous energy during work hours, so energy drinks are a favorite. As such sectors continue to grow with ongoing infrastructural projects and economic diversification initiatives, the market base for energy drinks is also expected to expand. Products that deliver at good prices and with extensive coverage will be best placed to reap the benefits of this trend.
The market also experiences challenges as it matures. Consumers' tastes are evolving, especially driven by an ageing population and increasing health consciousness. This change is compelling brands to rethink their formulations and marketing approaches. Beverages emphasizing sustained energy and overall wellness—particularly those aimed at middle-aged and aging consumers—may find greater acceptance. Concurrently, competition is still fierce with big-brand players such as Red Bull and Monster dominating the scene, leaving fewer gaps for new competitors.
Young adults remain a prime target segment for Singapore energy drink brands. Promotion strategies targeting extreme sports, music events, and e-gaming continue to be effective in establishing brand loyalty among young adults. More recent brands, such as Prime Energy, have leveraged youth culture and social media fads, achieving instant popularity through limited-edition launches and influencer promotions.
In the future, increasing health issues regarding caffeine levels could lead to regulation. Furthermore, natural and low-sugar energy drinks—although still niche—have increasing popularity as healthier options. Their development will likely hinge on the degree to which they succeed in balancing clean ingredients with functionality and price competitiveness.
Singapore Energy Drink Market Challenge
Lack of stringent rules on caffeine levels in energy drinks is causing health worries within the nation. The drinks, which are particularly favored by children and adolescents, usually have high amounts of caffeine that can cause side effects like heightened heart rate, elevated blood pressure, and insomnia. For instance, Prime Energy has 200mg of caffeine per 335ml can, twice the content in beverages such as Red Bull Classic and Monster Energy Original. Although 400mg per day is safe for healthy adults, this is not appropriate for children who are more sensitive to caffeine.
Additional concern comes from the fact that Prime Energy and Prime Hydration, a sport drink with no caffeine, come in identical packaging. This can be mistaken for younger consumers drinking high-caffeine beverages by mistake. As more concern mounts, governments may have to implement measures such as transparent labeling, caffeine restrictions, and age bans to secure public health.
Singapore Energy Drink Market Trend
As conventional energy drinks remain popular on the shelves, natural energy drinks gradually catch attention in Singapore. Being composed of green tea, yerba mate, and coffee beans, these drinks are picking up traction due to a growing interest in healthier alternatives. Health-conscious customers, particularly youth, are opting for them owing to their smoother and longer-lasting energy without the crashes usually associated with artificial caffeine.
Brands are resorting to colorful packaging, influencer collaborations, and esports sponsorships to reach youth. Mate Mate, for instance, collaborated with Team SMG and artist JJ Lin to push its brand, besides getting visibility during activities such as the Singapore National Day Parade. Nonetheless, premium prices are a factor, Mate Mate selling at approximately SAR 33 per liter compared to SAR 27.50 per liter for Red Bull Energy Sugar Free.
Unlock Market Intelligence
Explore the market potential with our data-driven report
| Report Coverage | Details |
|---|---|
| Market Forecast | 2025-30 |
| USD Value 2024 | $ 25 Million |
| USD Value 2030 | $ 30 Million |
| CAGR 2025-2030 | 3.09% |
| Largest Category | Non Alcoholic Energy Drinks segment leads with 95% market share |
| Top Challenges | Lack of Caffeine Regulations Raises Health Concerns |
| Top Trends | Rising Shift Toward Natural Alternatives in Energy Drinks |
| Key Players | Monster Energy Singapore Pte Ltd, TC Pharmaceutical Industry Co Ltd, Red Bull Singapore Pte Ltd, AriZona Beverages, PepsiCo. Inc., The Coca-Cola Company and Others. |
Unlock Market Intelligence
Explore the market potential with our data-driven report
Singapore Energy Drink Market Segmentation Analysis
The most market-share segment under the end-users segment is Singapore Energy Drinks Market is teenagers during 2025-30. Energy drink companies typically appeal to young people with marketing associated with extreme sports, e-gaming sponsorships, and music festivals. This stimulates teenagers that are attracted to adventurous living and cultural trends. One can cite the example of Prime Energy, launched in 2023 by social media influencers Logan Paul and KSI, both popular among youths. It became popular overnight, with special edition cans in Singapore selling between SGD5 and SGD350.
In Singapore, this youthful appeal is anticipated to fuel market expansion, particularly as these types of brands broaden their distribution. Whereas Prime Energy currently features distribution in vending machines, online channels, and limited speciality stores, its hydration equivalent has already found itself in mainstream channels. If Prime Energy joins it, it may further solidify its place amongst tenns in Singapore, who are apt to respond favorably to brands marrying cultural and lifestyle salience.
Top Companies in Singapore Energy Drink Market
The top companies operating in the market include Monster Energy Singapore Pte Ltd, TC Pharmaceutical Industry Co Ltd, Red Bull Singapore Pte Ltd, AriZona Beverages, PepsiCo. Inc., The Coca-Cola Company, etc., are the top players operating in the Singapore Energy Drink Market.
Frequently Asked Questions
Related Report
1. Market Segmentation
1.1. Research Scope
1.2. Research Methodology
1.3. Definitions and Assumptions
2. Executive Summary
3. Singapore Energy Drinks Market Policies, Regulations, and Standards
4. Singapore Energy Drinks Market Dynamics
4.1. Growth Factors
4.2. Challenges
4.3. Trends
4.4. Opportunities
5. Singapore Energy Drinks Market Statistics, 2020-2030F
5.1. Market Size & Growth Outlook
5.1.1.By Revenues in US$ Million
5.1.2.By Quantity Sold (Million Liters)
5.2. Market Segmentation & Growth Outlook
5.2.1.By Product Type
5.2.1.1. Alcoholic- Market Insights and Forecast 2020-2030, USD Million
5.2.1.2. Non-Alcoholic- Market Insights and Forecast 2020-2030, USD Million
5.2.2.By Consumption
5.2.2.1. Drinks- Market Insights and Forecast 2020-2030, USD Million
5.2.2.2. Shots- Market Insights and Forecast 2020-2030, USD Million
5.2.2.3. Mixers- Market Insights and Forecast 2020-2030, USD Million
5.2.3.By Nature
5.2.3.1. Conventional- Market Insights and Forecast 2020-2030, USD Million
5.2.3.2. Natural/Organic- Market Insights and Forecast 2020-2030, USD Million
5.2.4.By Flavour
5.2.4.1. Flavoured- Market Insights and Forecast 2020-2030, USD Million
5.2.4.2. Unflavoured- Market Insights and Forecast 2020-2030, USD Million
5.2.5.By Packaging
5.2.5.1. Bottles- Market Insights and Forecast 2020-2030, USD Million
5.2.5.1.1. PET Bottles- Market Insights and Forecast 2020-2030, USD Million
5.2.5.1.2. Glass Bottles- Market Insights and Forecast 2020-2030, USD Million
5.2.5.2. Metal Cans- Market Insights and Forecast 2020-2030, USD Million
5.2.5.3. Pouches- Market Insights and Forecast 2020-2030, USD Million
5.2.5.4. Others- Market Insights and Forecast 2020-2030, USD Million
5.2.6.By Packaging Size
5.2.6.1. Small- Market Insights and Forecast 2020-2030, USD Million
5.2.6.2. Medium- Market Insights and Forecast 2020-2030, USD Million
5.2.6.3. Large- Market Insights and Forecast 2020-2030, USD Million
5.2.7.By End User
5.2.7.1. Teenagers- Market Insights and Forecast 2020-2030, USD Million
5.2.7.2. Adults- Market Insights and Forecast 2020-2030, USD Million
5.2.7.3. Geriatric- Market Insights and Forecast 2020-2030, USD Million
5.2.8.By Sales Channel
5.2.8.1. On-Trade- Market Insights and Forecast 2020-2030, USD Million
5.2.8.2. Off-Trade- Market Insights and Forecast 2020-2030, USD Million
5.2.9.By Competitors
5.2.9.1. Competition Characteristics
5.2.9.2. Market Share & Analysis
6. Singapore Alcoholic Energy Drinks Market Outlook, 2020-2030F
6.1. Market Size & Growth Outlook
6.1.1.By Revenues in US$ Million
6.1.2.By Quantity Sold (Million Liters)
6.2. Market Segmentation & Growth Outlook
6.2.1.By Consumption- Market Insights and Forecast 2020-2030, USD Million
6.2.2.By Nature- Market Insights and Forecast 2020-2030, USD Million
6.2.3.By Flavour- Market Insights and Forecast 2020-2030, USD Million
6.2.4.By Packaging- Market Insights and Forecast 2020-2030, USD Million
6.2.5.By Packaging Size- Market Insights and Forecast 2020-2030, USD Million
6.2.6.By End Users- Market Insights and Forecast 2020-2030, USD Million
6.2.7.By Sales Channel- Market Insights and Forecast 2020-2030, USD Million
7. Singapore Non-Alcoholic Energy Drinks Market Outlook, 2020-2030F
7.1. Market Size & Growth Outlook
7.1.1.By Revenues in US$ Million
7.1.2.By Quantity Sold (Million Liters)
7.2. Market Segmentation & Growth Outlook
7.2.1.By Consumption- Market Insights and Forecast 2020-2030, USD Million
7.2.2.By Nature- Market Insights and Forecast 2020-2030, USD Million
7.2.3.By Flavour- Market Insights and Forecast 2020-2030, USD Million
7.2.4.By Packaging- Market Insights and Forecast 2020-2030, USD Million
7.2.5.By Packaging Size- Market Insights and Forecast 2020-2030, USD Million
7.2.6.By End Users- Market Insights and Forecast 2020-2030, USD Million
7.2.7.By Sales Channel- Market Insights and Forecast 2020-2030, USD Million
8. Competitive Outlook
8.1. Company Profiles
8.1.1.TC Pharmaceutical Industry Co Ltd
8.1.1.1. Business Description
8.1.1.2. Product Portfolio
8.1.1.3. Collaborations & Alliances
8.1.1.4. Recent Developments
8.1.1.5. Financial Details
8.1.1.6. Others
8.1.2.Red Bull Singapore Pte Ltd
8.1.2.1. Business Description
8.1.2.2. Product Portfolio
8.1.2.3. Collaborations & Alliances
8.1.2.4. Recent Developments
8.1.2.5. Financial Details
8.1.2.6. Others
8.1.3.Monster Energy Singapore Pte Ltd
8.1.3.1. Business Description
8.1.3.2. Product Portfolio
8.1.3.3. Collaborations & Alliances
8.1.3.4. Recent Developments
8.1.3.5. Financial Details
8.1.3.6. Others
8.1.4.AriZona Beverages
8.1.4.1. Business Description
8.1.4.2. Product Portfolio
8.1.4.3. Collaborations & Alliances
8.1.4.4. Recent Developments
8.1.4.5. Financial Details
8.1.4.6. Others
8.1.5.PepsiCo. Inc.
8.1.5.1. Business Description
8.1.5.2. Product Portfolio
8.1.5.3. Collaborations & Alliances
8.1.5.4. Recent Developments
8.1.5.5. Financial Details
8.1.5.6. Others
8.1.6.The Coca-Cola Company
8.1.6.1. Business Description
8.1.6.2. Product Portfolio
8.1.6.3. Collaborations & Alliances
8.1.6.4. Recent Developments
8.1.6.5. Financial Details
8.1.6.6. Others
8.1.7.Company 7
8.1.7.1. Business Description
8.1.7.2. Product Portfolio
8.1.7.3. Collaborations & Alliances
8.1.7.4. Recent Developments
8.1.7.5. Financial Details
8.1.7.6. Others
8.1.8.Company 8
8.1.8.1. Business Description
8.1.8.2. Product Portfolio
8.1.8.3. Collaborations & Alliances
8.1.8.4. Recent Developments
8.1.8.5. Financial Details
8.1.8.6. Others
8.1.9.Company 9
8.1.9.1. Business Description
8.1.9.2. Product Portfolio
8.1.9.3. Collaborations & Alliances
8.1.9.4. Recent Developments
8.1.9.5. Financial Details
8.1.9.6. Others
8.1.10. Company 10
8.1.10.1. Business Description
8.1.10.2. Product Portfolio
8.1.10.3. Collaborations & Alliances
8.1.10.4. Recent Developments
8.1.10.5. Financial Details
8.1.10.6. Others
9. Disclaimer
| Segment | Sub-Segment |
|---|---|
| By Product Type |
|
| By Consumption |
|
| By Nature |
|
| By Flavour |
|
| By Packaging |
|
| By Packaging Size |
|
| By End User |
|
| By Sales Channel |
|
Research Methodology
This study followed a structured approach comprising four key phases to assess the size and scope of the electro-oxidation market. The process began with thorough secondary research to collect data on the target market, related markets, and broader industry context. These findings, along with preliminary assumptions and estimates, were then validated through extensive primary research involving industry experts from across the value chain. To calculate the overall market size, both top-down and bottom-up methodologies were employed. Finally, market segmentation and data triangulation techniques were applied to refine and validate segment-level estimations.
Secondary Research
The secondary research phase involved gathering data from a wide range of credible and published sources. This step helped in identifying industry trends, defining market segmentation, and understanding the market landscape and value chain.
Sources consulted during this phase included:
- Company annual reports, investor presentations, and press releases
- Industry white papers and certified publications
- Trade directories and market-recognized databases
- Articles from authoritative authors and reputable journals
- Gold and silver standard websites
Secondary research was critical in mapping out the industry's value chain and monetary flow, identifying key market segments, understanding regional variations, and tracking significant industry developments.
Other key sources:
- Financial disclosures
- Industry associations and trade bodies
- News outlets and business magazines
- Academic journals and research studies
- Paid industry databases
Primary Research
To validate secondary data and gain deeper market insights, primary research was conducted with key stakeholders across both the supply and demand sides of the market.
On the demand side, participants included decision-makers and influencers from end-user industries—such as CIOs, CTOs, and CSOs—who provided first-hand perspectives on market needs, product usage, and future expectations.
On the supply side, interviews were conducted with manufacturers, industry associations, and institutional participants to gather insights into current offerings, product pipelines, and market challenges.
Primary interviews provided critical inputs such as:
- Market size and revenue data
- Product and service breakdowns
- Market forecasts
- Regional and application-specific trends
Stakeholders consulted included:
- Leading OEM and solution providers
- Channel and distribution partners
- End users across various applications
- Independent consultants and industry specialists
Market Size Estimation and Data Triangulation
- Identifying Key Market Participants (Secondary Research)
- Goal: To identify the major players or companies in the target market. This typically involves using publicly available data sources such as industry reports, market research publications, and financial statements of companies.
- Tools: Reports from firms like Gartner, Forrester, Euromonitor, Statista, IBISWorld, and others. Public financial statements, news articles, and press releases from top market players.
- Extracting Earnings of Key Market Participants
- Goal: To estimate the earnings generated from the product or service being analyzed. This step helps in understanding the revenue potential of each market player in a specific geography.
- Methods: Earnings data can be gathered from:
- Publicly available financial reports (for listed companies).
- Interviews and primary data sources from professionals, such as Directors, VPs, SVPs, etc. This is especially useful for understanding more nuanced, internal data that isn't publicly disclosed.
- Annual reports and investor presentations of key players.
- Data Collation and Development of a Relevant Data Model
- Goal: To collate inputs from both primary and secondary sources into a structured, data-driven model for market estimation. This model will incorporate key market KPIs and any independent variables relevant to the market.
- Key KPIs: These could include:
- Market size, growth rate, and demand drivers.
- Industry-specific metrics like market share, average revenue per customer (ARPC), or average deal size.
- External variables, such as economic growth rates, inflation rates, or commodity prices, that could affect the market.
- Data Modeling: Based on this data, the market forecasts are developed for the next 5 years. A combination of trend analysis, scenario modeling, and statistical regression might be used to generate projections.
- Scenario Analysis
- Goal: To test different assumptions and validate how sensitive the market is to changes in key variables (e.g., market demand, regulatory changes, technological disruptions).
- Types of Scenarios:
- Base Case: Based on current assumptions and historical data.
- Best-Case Scenario: Assuming favorable market conditions, regulatory environments, and technological advancements.
- Worst-Case Scenario: Accounting for adverse factors, such as economic downturns, stricter regulations, or unexpected disruptions.


